The tipping point WIDER Working Paper 2018/32 - The impact of rising electricity tariffs on large firms in South Africa - The tipping point: The ...
←
→
Page content transcription
If your browser does not render page correctly, please read the page content below

WIDER Working Paper 2018/32

The tipping point

The impact of rising electricity tariffs on large firms in South
Africa

Angelika Goliger1 and Landon McMillan2

March 2018

Abstract: While much research has been done on the economic impacts of load-shedding in South
Africa, fewer studies have focused on the effects of the rapidly rising electricity tariffs. The issue
of tariff increases has now become even more critical, with technological developments making it
easier and cheaper for consumers to reduce their demand for grid-based electricity. There have
been some South African studies that have attempted to estimate the price elasticity of electricity
demand or to show vulnerable sectors, but all have struggled to demonstrate the potential impacts
on the competitiveness of individual firms and their decisions to invest in their own generation,
and the longer-run impacts on electricity demand. This study examines the timing and type of
own-generation investment decisions that are viable for 21 large companies, and the likely impact
of this on South Africa’s electricity utility.

Keywords: net present value, own-generation, elasticity of demand, investment, firm profitability
JEL classification: D22, D25, L51, L94

Acknowledgements: The authors would like to thank Wian Boonzaaier and Konstantin
Makrelov.

Disclaimer: The views expressed in this paper are the personal views of the authors and do not
represent those of the National Treasury, South African Revenue Services, or Government of the
Republic of South Africa. While every precaution is taken to ensure the accuracy of information,
the National Treasury shall not be liable to any person for inaccurate information, omissions, or
opinions contained herein.

1 National Treasury, Pretoria, South Africa, corresponding author: angelika.goliger@treasury.gov.za; 2 Ministry of Business,
Innovation and Employment, Wellington, New Zealand (previously National Treasury, Pretoria, South Africa)
This study has been prepared within the UNU-WIDER project ‘Southern Africa—Towards inclusive economic development (SA-
TIED)’.
Copyright © UNU-WIDER 2018
Information and requests: publications@wider.unu.edu
ISSN 1798-7237 ISBN 978-92-9256-474-2 https://doi.org/10.35188/UNU-WIDER/2018/474-2
Typescript prepared by Merl Storr.
The United Nations University World Institute for Development Economics Research provides economic analysis and policy
advice with the aim of promoting sustainable and equitable development. The Institute began operations in 1985 in Helsinki,
Finland, as the first research and training centre of the United Nations University. Today it is a unique blend of think tank, research
institute, and UN agency—providing a range of services from policy advice to governments as well as freely available original
research.
The Institute is funded through income from an endowment fund with additional contributions to its work programme from
Finland, Sweden, and the United Kingdom as well as earmarked contributions for specific projects from a variety of donors.
Katajanokanlaituri 6 B, 00160 Helsinki, Finland
The views expressed in this paper are those of the author(s), and do not necessarily reflect the views of the Institute or the United
Nations University, nor the programme/project donors.
1      Introduction

Globally, technological changes have been occurring on multiple fronts in the electricity space:
new and cheaper energy generation options, and the rise of distributed generation; improvements
in storage technologies; new information systems enabling the Internet of Things and smart grids;
new energy-related industry technologies such as electric vehicles, fuel cells, and logistics
technologies, amongst others. These developments are resulting in lower electricity prices, as well
as new ways for consumers to manage their electricity usage, sell power back into the grid, or
become (partly or fully) independent of traditional grid-based electricity. While these developments
are positive for electricity consumers, they are challenging for electricity providers with more
traditional business models, and can lead to what is known as a utility ‘death spiral’ (O’Boyle 2017).

In South Africa’s case, the electricity sector is dominated by Eskom, a state-owned and integrated
electricity provider. Around 90 per cent of the country’s electricity is generated by Eskom’s coal-
fired power stations (Eskom n.d.). There is minimal competition in the generation space from
independent power producers, which are largely in the renewable space and have to sell power
back to Eskom. Eskom has a monopoly on transmission, and also distributes power. Municipalities
also act as distributors, accounting for about 40 per cent of electricity sales (Eskom 2017).

Electricity is generally a relatively small proportion of a firm’s overall operating expenditure or a
household’s consumption expenditure, but it is nonetheless critical for the operation of machinery
and the running of lights and appliances. Hence firms and individuals were relatively inelastic in
their demand patterns when electricity prices were historically low in South Africa before 2008. In
addition, the direct prices of alternatives energy sources at the time, and the indirect costs
associated with the installation of the necessary infrastructure and the logistics of sourcing and
obtaining it, meant there was little or no cross-price elasticity. Essentially, electricity demand was
largely determined by the income effect, and for firms by output or value-added growth. However,
starting in 2008, electricity prices in South Africa started to rise steeply (Figure 1), changing the
relative costs of electricity with respect to alternative energy options and in relation to output
prices. This in turn should have made consumers more elastic.
Figure 1: Electricity tariff trends in South Africa

Source: authors’ illustration based on data from Eskom (n.d.a) and StatsSA (n.d.).

                                                        1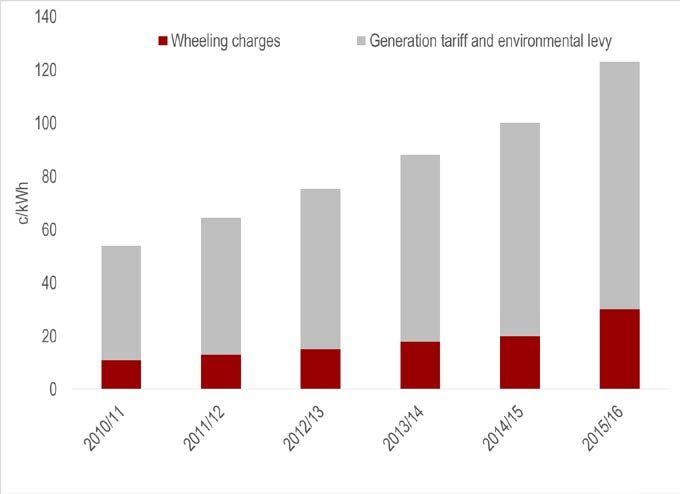
The price elasticity of demand for electricity, and the strongly related energy intensity of economic
growth, has been difficult to estimate because of the current electricity shortfalls, which artificially
constrain the market, thereby masking price elasticity effects. 1 The timing of the price increases,
which largely coincided with an economic recession, also make estimation difficult, as does the
lumpy long-term nature of energy-intensive investments. Finally, the quality of data in South
Africa, including the availability of municipal data and data disaggregated for sector-specific
analysis, is problematic. Nevertheless, anecdotal evidence suggests that steep electricity price
increases over recent years, combined with lower economic growth, low commodity prices,
generally low inflation rates, and excess productive capacity in many countries around the world,
means that many firms are under severe price pressure, and that electricity demand is more elastic.

With rising electricity prices in South Africa, there are a number of possible electricity cost ‘tipping
points’ that might result in firms making decisions that significantly alter their electricity demand
profiles, including:

     •   deciding to generate their own electricity,
     •   deciding not to invest any further,
     •   deciding to invest elsewhere in the region or in another sector,
     •   deciding to invest in large energy efficiency programmes, or
     •   deciding to shut down one or more parts of their business.

These kinds of decision will have large ramifications for Eskom sales, and for the South African
economy more broadly. If firms choose to delay or cancel investment, or indeed to shut plants
down, this will affect forecasts not only of economic growth, but also of electricity demand, and
of how much supply is required to meet that demand. Whilst decisions to invest in other sectors
may not affect growth, they will contribute to structural transformation, and could have an impact
on variables such as employment and exports. The decision to build own-generation may be
viewed by some in a positive light, as it is better than shutting down facilities and will result in
some investment expenditure. However, it could have large impacts on Eskom’s revenue, and this
in turn could have large implications for the average price level for those still supplied from the
grid. Furthermore, it could impact the South African fiscus in terms of Eskom’s demands for
government guarantees or recapitalization. A decision to invest in energy efficiency is generally
viewed in a positive light (despite some potential decline in sales revenue for Eskom) in that firms
will become less energy-intensive and potentially more competitive and sustainable, and it will
contribute to environmental objectives whilst also contributing to investment expenditure.

This paper attempts to model where and when such tipping points might be reached, using
financial information from 21 companies from various sectors in South Africa, cost information
for own-generation technologies, and tariff increase scenarios. The literature review that follows
highlights relevant research on demand elasticities and the effects of electricity tariff increases on
various sectors, and an electricity tipping-point study previously commissioned by Eskom. This is
followed by sections that look at the impact of electricity tariff increases on the operating profits
of firms used in the study, and the ability of these firms to move their electricity consumption off-
grid by investing in their own generation. The paper ends with concluding remarks.

1
  For example, Eskom’s key industrial customers have been load-curtailed by about 10 per cent from pre-2008
baselines since 2008. From January to June 2015 there was load-shedding on 82 days and for 709 hours, with unserved
energy amounting to 1,095 gigawatts.

                                                        2
2 Literature review
There have been a few elasticity and sector-level studies related to electricity tariffs in South Africa.
Research by Deloitte (2009) tried to calculate the price elasticity of demand for electricity by sector
by estimating an error correction model, using detailed sector-level data from Eskom on their key
industrial customers. Although the data did not cover residential and commercial customers
sufficiently to be considered representative of South Africa, it did cover a significant proportion
of most mining and many manufacturing sectors, where Eskom tends to supply large customers
directly. The results showed demand to be very inelastic, but the authors argued that there had
been insufficient variation in price in the data set to test the price effect sufficiently. A longer-run
estimation—based on publicly available data sets—showed more elastic demand responses, with
electricity consumption increasing as real prices declined over a period of 20 years, although there
are some methodological issues with using this data. 2
Inglesi and Pouris (2010) used Engle-Granger methodology to model electricity demand with data
for 1980–2007, and found that while in the short run firm demand for electricity is influenced by
economic and population growth, in the long run income and the price of electricity are larger
determinants. Inglesi-Lotz and Blignaut, in their 2011 panel data analysis of various sectors’
responses to electricity price increases during 1993–2006, found that the industrial sector had a
statistically significant negative price elasticity of demand of -0.869, whilst other sectors were found
not to be sensitive to historical electricity price increases. However, the paper concludes that
structural change is expected in economic sectors due to high increases in electricity prices, which
may spur sectors to invest in more efficient technologies or other forms of energy that are more
affordable.
All these studies recommended that changing levels of elasticity or ‘tipping points’ should be
examined. More recently, Kohler (2013) shows that while price elasticity of demand might have
been an inelastic -0.738 for 1989–2009, it has become more elastic. Kohler suggests a long-run
elasticity of up to -3.4 for industry.
In their paper on effects of electricity shortages on productivity, Fisher-Vanden et al. (2013) found
that in Chinese firms exposed to power shortages there was no indication of an increase in own-
generation in the early 2000s. 3 However, the generation market has changed substantially since
then, and the costs of own-generation have been on the decline (SAPVIA 2013). According to
Edwards (2012), higher electricity tariffs encourage innovation in terms of production processes
as well as investment in own-generation.
2
Publicly available data from supply use tables shows values in South African rand of electricity outputs consumed as
inputs in various sectors. It does not, however, show actual volume in kilowatt-hours consumed, and average electricity
prices vary greatly between sectors. It is possible to get broad categories of electricity sales by value and volume using
Eskom’s high-level categorization: mining, manufacturing, rural, resellers, traction, commercial, residential.
3
In the Manufacturing Circle’s review for the second quarter of 2015, ongoing electricity supply challenges were
widely identified as a key concern for manufacturers, with load-shedding, supply uncertainty, and rising electricity
tariffs having an impact on profitability. The Manufacturing Circle (2015) surveyed its members about mitigation
strategies against electricity shortages: 63 per cent of those surveyed had their own generation (likely fuel generators),
53 per cent rescheduled production, 19 per cent reduced production, and 15 per cent either closed down production
lines or substituted imports for local manufacture. Furthermore, 33 per cent of firms upgraded their existing capacity
for greater energy and water efficiency.
3Looking from a firm-level perspective, Montmasson-Clair and Ryan (2014) explored the impact
of electricity price increases on the competitiveness of mining industries, and the role these
increases have played in renewable energy and energy investments in mining value chains. The
study used annual financial statements and company interviews, and found surface mining, coal,
and platinum group metal firms to have been marginally affected by electricity price increases,
whilst gold miners were strongly affected. Deloitte (2011) found the electricity and non-ferrous
metals sectors to be particularly vulnerable to electricity prices. Overall, the analysis by
Montmasson-Clair and Ryan concluded that the effect of electricity price increases has not been
sufficient to change firm behaviour and processes substantially, although some firms were reported
to have already explored options around energy-efficient technologies, co-generation, and
renewables.
Cameron and Rossouw (2012), in a study commissioned by Eskom, looked directly at the issue of
tipping points by using key industrial customer information about electricity consumption and
operating expenditure (obtained through Eskom-run surveys) to model the shutdown point of
these firms. Cameron and Rossouw found that customers in 13 sectors—particularly in
‘manufacturing of basic and fabricated metals’ and ‘manufacturing of coke, refined petroleum
products, nuclear, chemicals, rubber, plastic’—had the potential to reach the tipping point. These
customers account for about 25 per cent of Eskom’s revenue. Further, six customers—accounting
for 4.1 per cent of Eskom’s revenue—were identified as ‘in jeopardy’ based on their tipping-point
analysis.
There have been numerous studies on the economic impact of supply shortages and load-shedding
in South Africa. Studies on the economic impact of price increases have been less common.
This paper attempts to build on the research that has already been done on elasticity of demand
and tipping points by updating older research with newer, higher electricity prices, and looks at the
impacts on individual firm profitability. Not only have electricity prices continued to increase since
Cameron and Rossouw conducted their research in 2012, but commodity prices have also come
under pressure. An additional contribution is that this paper extends the tipping-point analysis to
the potential for own-generation in various electricity scenarios in the midst of falling levelized
costs of own-generation.
3 Impacts of electricity tariffs on operating profits and firm-level decisions
3.1 Method
This section of the paper uses financial and sustainability information from the publicly available
annual reports of 21 companies across different sectors (12 energy-intensive firms 4 and nine less
energy-intensive firms 5). Nominal data for the last four available years of the annual financial
statements of companies is extrapolated until 2040–41, using various assumptions around variables
such as revenue growth, increases in costs, and tax-to-operating-profit ratios. The electricity costs
of these companies are determined using annual electricity consumption data taken from firm
sustainability reports. Where not available in the companies’ annual reports, electricity cost
information has been taken from existing literature or obtained from the companies directly.
4
Sibanye, Harmony Gold, AngloPlat, Lonmin, Implats, Kumba Iron Ore, Evraz Highveld Steel, ArcelorMittal,
Hulamin, PPC, AECI, and Transnet.
5
Astral Foods, Clover, Pioneer Foods, Distell, Nampak, Nedbank, Telkom, Tsogo Sun, and Netcare.
4Electricity price data is sourced from Eskom as well as municipal benchmark data from the
National Energy Regulator of South Africa. Electricity price increases are forecast until 2040–41
using three tariff scenarios: a base/low-tariff scenario, a high-tariff scenario, and a moderate-tariff
scenario. In the outer years, it is assumed that electricity prices rise by an assumed consumer price
inflation rate. As municipalities are allowed by the regulator to charge a surcharge on top of their
Eskom rate, the municipal tariff increase differential is assumed to be one percentage point, for
the sake of simplicity.
Table 1: Eskom tariff scenarios
2015/16 2016/17 2017/18 2018/19 2019/20 2020/21 2021/22 2022/23 2023/24 2024/25 2025/26
Base (low) 12.7% 8.0% 8.0% 8.0% 5.8% 5.8% 5.8% 5.8% 5.8% 5.8% 5.8%
High 12.7% 25.0% 25.0% 20.0% 8.0% 8.0% 8.0% 5.8% 5.8% 5.8% 5.8%
Moderate 12.7% 15.0% 15.0% 15.0% 10.0% 8.0% 8.0% 5.8% 5.8% 5.8% 5.8%
Source: authors’ calculations.
Table 2: Municipal tariff scenarios
2015/16 2016/17 2017/18 2018/19 2019/20 2020/21 2021/22 2022/23 2023/24 2024/25 2025/26
Base (low) 13.7% 9.0% 9.0% 9.0% 6.8% 6.8% 6.8% 6.8% 6.8% 6.8% 6.8%
High 13.7% 26.0% 26.0% 21.0% 9.0% 9.0% 9.0% 6.8% 6.8% 6.8% 6.8%
Moderate 13.7% 16.0% 16.0% 16.0% 11.0% 9.0% 9.0% 6.8% 6.8% 6.8% 6.8%
Source: authors’ calculations.
Individual firm electricity costs are linked to the tariff scenarios above. It is assumed that the 12
energy-intensive electricity users are supplied directly from Eskom, and that the less energy-
intensive firms are municipal customers. In order to determine the impacts of electricity price
increases on the firms in the analysis, the net present value (NPV) of the operating profits from
2015–16 until 2040–41 are calculated for each firm. For comparison purposes, the NPV of the
base scenario (the best case from a business perspective) for each firm is compared with the high-
and moderate-increase scenarios to see the size of the loss in NPV due to higher electricity tariffs.
3.2 Results
When we evaluate the energy-intensive firms in the study, there is no clear shutdown point in the
base, high- or moderate-tariff scenarios. In other words, there is no point where the NPVs of
firms’ operating profits becomes marginal or negative. However, there is a significant loss in the
NPVs of the operating profits of energy-intensive users between 2015–16 and 2040–41 when we
compare the base scenario with high and moderate electricity price increases, as Figure 2 indicates.
In the high-tariff scenario, declines in the NPVs of the operating profits of energy-intensive firms
are between 0.4 per cent and 17.1 per cent, whilst in the moderate scenario the declines are between
0.2 and 8.5 per cent. As expected, the largest declines in operating profit NPVs can be seen in
firms with the highest energy intensities. The biggest declines are seen in Evraz Highveld Steel
(17.1 per cent), Implats (14.1 per cent), and PPC (12.4 per cent) in the high-tariff scenario. Kumba
Iron Ore and AECI (a chemicals manufacturer) are the least affected energy-intensive users, due
to their relatively low electricity intensities and costs.
Regarding the less energy-intensive users, the picture is rather similar: these firms do not reach a
shutdown point in any scenario, but they do have lower operating profit NPVs in the high and
moderate scenarios in comparison with the base scenario. However, the magnitude of the decline
in NPV is much smaller than in the case of energy-intensive users (Figure 3).
5Figure 2: The impact of high- and moderate-tariff scenarios on operating profits in comparison with the base
scenario—energy-intensive users
Source: authors’ calculations.
Figure 3: The impact of high- and moderate-tariff scenarios on operating profits in comparison with the base
scenario—other users
Source: authors’ calculations.
In the high-tariff scenario, declines in the NPVs of operating profits are between 0.2 per cent and
two per cent, whilst in the moderate scenario the declines are between 0.1 per cent and one per
cent, in comparison with the base scenario. Nampak, Astral Foods, and the Tsogo Sun hotel group
are the most affected in this group.
The analysis of the impact of tariff increases on operating profits indicates that while firms may
not reach shutdown point, there is a material impact on the future operating profits of several
firms. This in turn will likely have an impact on decisions to invest, depending on shareholders’
willingness to tolerate lower returns.
64 The ability of firms to invest in their own generation
The levelized costs of alternative technologies have been declining dramatically over the past few
years, and are expected to continue falling until at least 2020 (Table 3)—although more recently
there are indications that the costs of renewable generation will fall further (International
Renewable Energy Agency 2016).
Table 3: Anticipated changes in the levelized cost of electricity for various generation technologies
R/kWh 2012 2020 % change
Concentrating solar power 2.40 1.71 -29%
Coal 0.80 1.69 111%
Open cycle gas turbines 6.93 1.63 -76%
Wind 0.86 0.76 -12%
Photovoltaics 1.79 1.05 -41%
Source: SAPVIA (2013), reproduced here with permission.
The likelihood of firms investing in own-generation depends on several factors, such as electricity
intensity, scope for energy efficiency gains, ability to pass costs on, and cost of own-generation
relative to direct electricity costs. The general investment climate is an additional consideration for
firms looking to invest in own-generation, particularly for long-term investments such as coal or
closed-cycle gas turbines (CCGTs). It may be difficult for a firm to invest in a 20-year project,
given that South Africa’s investor and business confidence remains weak. Also, shareholders may
not have the appetite to spend a significant amount of money investing in a non-core asset.
However, Cloete et al. (2011) found that, although rising electricity tariffs were a major concern,
sustainability of electricity supply was the most important factor for companies seeking to move
towards own-generation technologies.
4.1 Method
This component of the study weighs the costs of investing in own-generation (including capital
expenditure, operating expenditure, and financing costs) against the avoided electricity costs (i.e.
benefits) in the different tariff scenarios for each company. For each scenario, the NPV of the net
benefits of each own-generation technology 6 over its lifespan is determined for each firm. Then
the internal rates of return (IRRs) are compared with an assumed market return of 12 per cent. In
other words, if the IRRs of the net benefits of a particular technology are less than 12 per cent for
a firm, the company could make a better return by continuing to rely on the national grid and
investing elsewhere.
The capex and opex data for the various technologies was obtained from the Electric Power
Research Institute’s (2011) ‘Power Generation Technology Data for the Integrated Resource Plan’,
and was adjusted from 2011–12 to 2020–21 by price forecasts from the South African Photovoltaic
Industry Association. From 2021–22 onwards, it is assumed that the costs of these technologies
rise by the inflation assumption. The avoided electricity costs are equivalent to the electricity costs
calculated in the first component of the study (Section 3). It is assumed that firms start investing
6
For energy-intensive users, the following technologies are evaluated: a large (750-megawatt) coal plant; a small (250-
megawatt) coal plant; a CCGT plant (711 megawatts); a 200-megawatt wind farm; a 50-megawatt wind farm; 10-
megawatt photovoltaic and concentrating solar technologies. For the less energy-intensive firms, the coal, gas, and
large-capacity wind plants are excluded, and the net benefits of 50-megawatt wind farms, 20-megawatt wind farms,
and 10-megawatt photovoltaic and concentrating solar technologies are determined.
7in 2015–16 7 and only start benefitting from avoided electricity costs once construction is complete.
A critical assumption in the model is the location of generation plant with respect to the location
of the firm’s plants, branches, factories, head offices, depots, or mines. As all the statements used
are group financial statements, they include sites of different types (and energy intensities) across
a wide range of locations.
Some firms might have relatively concentrated sites of electricity use, whilst others will be spread
out across South Africa. 8 Building own-generation and supplying different sites will require the
use of existing transmission and distribution infrastructure. All transmission infrastructure is
owned by Eskom, and distribution infrastructure by both Eskom and municipalities. Wheeling
charges, i.e. charges for the use of this transmission and distribution infrastructure, are not taken
into account in the first set of models, but we attempt to account for them in the second. Again,
there are assumptions that need to be made about where the generation plant is located and what
proportion needs to be wheeled, as financial statements do not disaggregate the information to
this level. It is assumed to be unviable to invest in particular generation plant (by source of energy
and size) if the load factor or operating capacity required of that plant in order to meet a firm’s
electricity demand is less than 55 per cent. This assumes, therefore, that any generation plant
investment made by a firm is done only for its own consumption (not for feeding back into the
grid with feed-in tariffs, or for selling to another firm). The model includes various assumptions
around load factors, 9 maintenance and energy costs, financing costs, debt/equity ratios, build
times, and so on.
4.2 Results
Table 4 summarizes the viability of various own-generation technologies across all three tariff
scenarios. In the base, moderate-, and high-tariff scenarios, it is viable for three energy-intensive
firms to build a large coal plant; a 100x two-megawatt wind plant is viable for between seven and
10 firms out of the energy-intensive users. In terms of the other firms, for whom coal, CCGTs
and large wind plants are not viable, a 25x two-megawatt wind plant is viable for six firms in the
base and moderate scenarios, and for eight firms in the high-tariff scenario.
Table 4: Number of firms for whom own-generation is viable in various tariff scenarios
Large Small CCGT Wind Wind (25 Wind (10 Solar PV Concentr
coal (750 coal (250 (711 (100 x x 2MW) x 2MW) (10 MW) ating
MW) MW) MW) 2MW) solar (10
MW)
Energy intensive firms (out of 12 firms)
Base 3 5 4 7 4 n/a 4 4
High 3 6 4 10 8 n/a 7 7
Moderate 3 5 4 10 6 n/a 5 6
Other firms (out of 9 firms)
Base n/a n/a n/a n/a 6 5 5 5
High n/a n/a n/a n/a 8 7 6 7
Moderate n/a n/a n/a n/a 6 6 6 6
Source: authors’ calculations.
7 If firms choose to invest later, own-generation becomes progressively more viable.
8
Although these firms are international, we attempt to isolate South African operations and energy use.
9
For example, the load factors for solar and wind are assumed at 25 per cent, although latest estimates by Knorr et
al. (2016) show wind load factors exceed 30 per cent in many parts of the country.
84.3 Wheeling charges
The above analysis of own-generation potential does not include wheeling charges. Wheeling
charges are a significant cost component of private generation, according to SAPVIA (2013).
Wheeling charges, which are regulated by the energy regulator, have been highlighted as a
significant barrier to the growth of alternative generation, particularly smaller generators
(Nkabinde 2015).
Figure 4: Average tariff structure
Source: SAPVIA (2013), reproduced here with permission.
Figure 5: Own-generation potential in various wheeling-charge and tariff scenarios
Source: authors’ calculations.
9The own-generation component of the net benefit model was expanded to include a wheeling
charge in the costs of own-generation projects, 10 in order to determine the impacts of wheeling
charges on the viability of these projects for firms. The impacts of three wheeling-charge burden
scenarios (zero per cent, 60 per cent, and 100 per cent), 11 assumed to apply to all firms in the study
for simplification purposes, are compared with one another to see the impact on own-generation
potential across the 21 firms in the study.
The potential size of own-generation is determined by selecting the technology with the highest
generation capacity, with an IRR of 12 per cent or more, for each firm in each tariff scenario. As
shown by the results in Figure 5, wheeling charges do make some own-generation projects
unviable; however, the bulk of the projects (at least 16,000 megawatt-hours’ worth) remain viable.
This is likely due to the fact that this study only looks at large and generally profitable firms.
4.4 Implications for Eskom
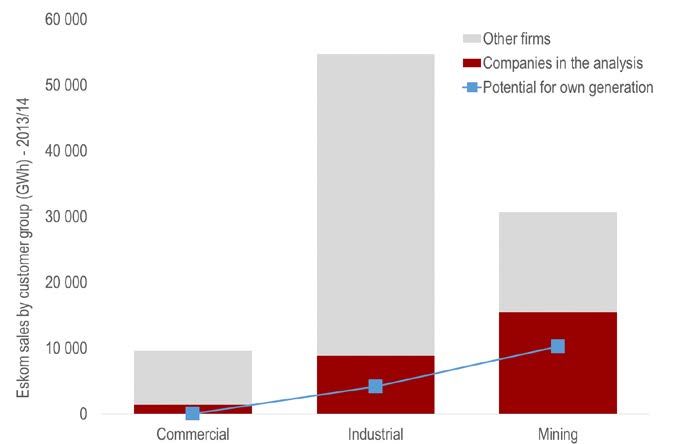
Figure 6: Maximum own-generation potential in the moderate-tariff scenario compared with Eskom’s sales by
customer 12
Source: authors’ calculations.
Figure 6 depicts Eskom’s total sales by customer group for industrial, commercial and mining
customers. For example, Eskom sells 54,658 gigawatt-hours to industrial customers, and 30,667
gigawatt-hours to mining customers. The four commercial companies in this analysis account for
14 per cent of Eskom’s commercial sales, the 10 industrial companies account for 16 per cent of
Eskom’s industrial sales, and the six mining firms in the study account for 51 per cent of mining
sales. The estimated potential for own-generation among these customer groups—assuming grid
access, a 60 per cent wheeling charge, and the moderate-tariff scenario—is equivalent to one per
10
These costs were taken from SAPVIA (2013) and extrapolated forward using the electricity tariff growth
assumptions.
11
The 60 per cent wheeling-charge scenario assumes that the own-generation plant is built at the location of the most
energy-intensive plant of the firm, which consumes 40 per cent of the electricity produced, and that the remaining 60
per cent of the generation capacity is wheeled. The zero per cent and 100 per cent wheeling-charge scenarios are used
in order to determine the range of wheeling costs.
12
With a 60 per cent wheeling-charge burden in the moderate-tariff scenario.
10cent of Eskom’s commercial sales, eight per cent of Eskom’s industrial sales, and 34 per cent of
Eskom’s mining sales. This finding has significant implications for Eskom’s sales and financial
sustainability. As prices rise and alternative generation technologies become cheaper, Eskom could
lose a portion of its customer base.
5 Sensitivities and model limitations
The models’ results are not very sensitive to changes in energy efficiency, as the NPV impacts of
improvements in energy efficiency to counter higher electricity tariffs are marginal over the entire
26-year period. But there is some sensitivity to changes in the revenue growth assumption. The
operating profit model is not very sensitive to changes in the assumption of required rates of
return, whilst the effects of changes to this assumption are different from firm to firm in the
potential for own-generation model. However, many of the technologies have very high IRRs for
some companies, far exceeding any reasonable assumption of rate of return.
The model assumes fixed and homogenous rates of growth in revenues and operating profits for
the various companies, and does not model individual management decisions at firms, such as
cutting costs or undertaking investments to increase revenues. The analysis also does not take into
account firms’ ability to pass costs on to consumers: it assumes that firms absorb all the costs of
electricity price increases, and that these firms do not adjust to higher prices by cutting costs,
making energy efficiency investments, etc., over the period of analysis. Further, it assumes away
external influences such as cost escalations, changes to exchange rates, or sector-specific changes
in demand or commodity price.
Second-round effects of the tariff increases (i.e. the knock-on impacts of electricity prices on other
energy-intensive inputs) are also not included in the operating profit and own-generation models.
The potential own-generation model does not take into account the appetite of shareholders to
invest in a potentially costly project that is not core to their business, or the impact of the current
investment climate on firms’ willingness to invest in potentially long-term projects (such as a 30-
year coal plant). The cost of land is not included, and, critically, the own-generation model does
not include the cost of unserved energy, which is likely to increase the net benefit of own-
generation significantly—particularly if firms are very dependent on stable and consistent
electricity supply. Finally, this analysis only focuses on large firms and does not look at the impacts
of rising tariffs on smaller firms, which is likely to be larger, particularly as many of them already
face higher charges in the municipalities and face constraints on their decision-making or the
options available to them.
6 Concluding remarks
Historically, the total impact of electricity price increases on gross value added in South Africa has
not been severe, given the relatively small proportion of electricity as an input cost. However,
demand for electricity has been becoming more elastic. The impact of rising electricity tariffs on
firm operating profits, and the potential for own-generation, is explored in this paper. Although
only two of the firms in this analysis are near a potential estimated shutdown point, the net present
values of all firms and their future operating profits are eroded in the higher-tariff scenarios—
significantly so for many of the energy-intensive users. This erosion in operating profits will likely
have an impact on investment decisions. Firms may decide to cut costs, implement energy
11efficiency measures, close parts of their operations, move operations to neighbouring countries,
invest in other sectors, or invest in their own generation capacity.
Investing in own-generation capacity is relatively viable, and some firms appear to have already
reached a tipping point, even in a low-tariff scenario. Whilst this can have a positive outcome from
a business sustainability and economic growth perspective, it can also impose costs on the
economy more broadly and over the long term, as these smaller generation options are less efficient
or do not benefit from economies of scale. In addition, it poses significant threats to the financial
sustainability of Eskom and municipalities that rely heavily on energy-intensive users for revenue;
this has been the experience of many other utilities around the world that have had to adjust to
the changing business environment (O’Boyle 2017).
Own-generation decisions, whilst able to temporarily add electricity capacity in the short term, do
not, however, affect overall electricity consumption and output over the longer period. When
prices rise, some firms will choose to generate their own power, but others will simply look to
reduce consumption and output, invest less in energy-intensive sectors, or shut down. With rising
tariffs and falling costs of own-generation technologies, decisions taken by large energy-intensive
firms in response to electricity tariff increases may lead to significant structural changes in the
South African economy in the coming years. South Africa’s integrated monopoly electricity
provider will need to be prepared for a world where electricity consumers increasingly become
prosumers (Sajn 2016).
References
Cameron, M., and R. Rossouw (2012). ‘Modelling the Impact of Electricity Tariff Increases on
Eskom’s Top Customer Segment’. Available at: www.nersa.org.za/SAERC/Documents/
SAERC/Martin%20Cameron%20and%20Riaan%20Rossouw.pdf (accessed 3 December
2015).
Cloete, B., S. Chisadza, Y. Ramkolowan, B. Cohen, K. Mason-Jones, and C. Ras (2011). ‘Ability
of Firms to Adjust to Higher Energy Costs’. Report prepared for the National Treasury.
Available at:
www.dnaeconomics.com/assets/Usematthew/Ability_of_firms_to_adjust_to_higher_energ
y_costs_Non-conf_Executive_Summary_Website_-_Feb_2012.pdf (accessed 19 February
2018).
Deloitte. (2009). ‘Estimating the Elasticity of Electricity Prices in South Africa’. Johannesburg:
Deloitte.
Deloitte (2011). ‘The Economic Impact of Electricity Price Increases on Various Sectors of the
South African Economy’. Johannesburg: Deloitte. Available at: www.eskom.co.za/
CustomerCare/MYPD3/Documents/Economic_Impact_of_Electrcity_Price_Increases_D
ocument1.pdf (accessed 16 February 2018).
Edwards, T. (2012). ‘China’s Power Sector Restructuring and Electricity Price Reforms’. Asia Paper,
6(2): 11.
Electric Power Research Institute (2012). ‘Power Generation Technology Data for Integrated
Resource Plan of South Africa’. Palo Alto: Electric Power Research Institute.
Eskom (n.d.a) ‘Tariff History’. Available at: http://www.eskom.co.za/CustomerCare/
TariffsAndCharges/Pages/Tariff_History.aspx (accessed 23 February 2018).
12Eskom (n.d.b). ‘Understanding Electricity’. Available at: www.eskom.co.za/AboutElectricity/
ElectricityTechnologies/Pages/Understanding_Electricity.aspx (accessed 19 February 2018).
Eskom (2017). ‘Integrated Results 2017’. Available at: www.eskom.co.za/IR2017/Pages/
default.aspx (accessed 19 February 2018).
Fisher-Vanden, K., E. Mansur, and Q. Wang (2013). ‘Costly Blackouts? Measuring Productivity
and Environmental Effects of Electricity Shortages’. NBER Working Paper 17741.
Cambridge, MA: NBER.
Inglesi, R., and A. Pouris (2010). ‘Forecasting Electricity Demand in South Africa: A Critique of
Eskom’s Projections’. South African Journal of Science, 106(1–2): 1–4.
Inglesi-Lotz, R., and J. Blignaut, (2011). ‘Estimating the Price Elasticity of Demand for Electricity
by Sector in South Africa’. South African Journal of Economic and Management Science, 14(4): 449–
65.
International Renewable Energy Agency (2016). ‘The Power to Change: Solar and Wind Cost
Reduction Potential to 2025’. Available at: www.irena.org/DocumentDownloads/
Publications/IRENA_Power_to_Change_2016.pdf (accessed 23 February 2018).
Kohler, M. (2013). ‘Differential Electricity Pricing and Energy Efficiency in South Africa’.
Working Paper 396. Cape Town: ERSA.
Knorr, K., B. Zimmermann, S. Bofinger, A. Fraunhofer, T. Bischof-Niemz, and C. Mushwana
(2016). ‘Wind and Solar PV Resource Aggregation Study for South Africa’. Pretoria: CSIR.
Available at: www.csir.co.za/study-shows-abundance-wind-and-solar-resources-south-africa
(accessed 23 February 2018).
Manufacturing Circle (2015). ‘Manufacturing Bulletin Quarterly Review, Second Quarter 2015’.
Available at: www.plasticsinfo.co.za/wp-content/uploads/2015/08/Manufacturing-Circle-
Bulletin-Sept-2015.pdf (accessed 19 February 2018).
Montmasson-Clair, G., and G. Ryan (2014). ‘The Impact of Electricity Price Increases on Selected
Mining Sector and Smelting Value Chains in South Africa’. Pretoria: TIPS. Available at:
www.tips.org.za/research-archive/sustainable-growth/green-economy-3/item/2905-the-
impact-of-electricity-price-increases-on-the-competitiveness-of-selected-mining-sector-and-
smelting-value-chains-in-south-africa (accessed 19 February 2018).
Nkabinde, S. (2015). ‘Wheeling the Power’. Moneyweb, 24 July. Available at: www.moneyweb.co.za/
in-depth/moneyweb-business-insights/wheeling-the-power/ (accessed 19 February 2018).
O’Boyle, M. (2017). ‘Three Ways Electric Utilities Can Avoid A Death Spiral’. Forbes, 25
September. Available at: www.forbes.com/sites/energyinnovation/2017/09/25/three-ways-
electric-utilities-can-avoid-a-death-spiral/2/#2f46d49713ea (accessed 19 February 2018).
Sajn, N. (2016). ‘Electricity “Prosumers”’. Brussels: European Parliamentary Research Service.
Available at:
www.europarl.europa.eu/thinktank/en/document.html?reference=EPRS_BRI(2016)59351
8 (accessed 19 February 2018).
SAPVIA (2013). ‘Overview of Solar PV in South Africa’. Cape Town: SAPVIA. Available at:
www.sapvia.co.za/wp-content/uploads/2013/05/African-Utility-Week-Presentation-May-
2013.pdf (accessed 15 June 2016).
StatsSA (n.d.). ‘Consumer Price Index, 1987–2016’. Available at: www.statssa.gov.za/ (accessed 23
February 2018).
13Appendix: additional tables
Table A1: Impact on operating profits—base versus high- and moderate-tariff scenarios
Company Electricity Base High Difference % Moderate Difference %
intensity Scenario* Scenario between difference Scenario between difference
NPV @12% NPV base and high NPV base and
(Rmillions) @12% (R scenario @12% (R moderate
millions) (Rmillions) millions) scenario
(Rmillions)
ELECTRICITY INTENSIVE FIRMS
Sibanye 20.0% 107 120 95 357 -11 763 -11.0% 101 238 -5 882 -5.5%
Harmony Gold 15.0% 83 597 75 897 -7 700 -9.2% 79 747 -3 851 -4.6%
AngloPlat 11.0% 211 746 199 221 -12 525 -5.9% 205 483 -6 263 -3.0%
Lonmin 7.2% 39 560 36 687 -2 872 -7.3% 38 123 -1 436 -3.6%
Implats 12.0% 45 529 39 101 -6 428 -14.1% 42 315 -3 215 -7.1%
Kumba Iron Ore 3.4% 321 465 320 093 -1 372 -0.4% 320 779 -686 -0.2%
Evraz Highveld Steel 15.9% 18 767 15 567 -3 200 -17.1% 17 167 -1 600 -8.5%
Arcelor Mittal 10.1% 114 379 106 508 -7 871 -6.9% 110 443 -3 936 -3.4%
Hulamin 20.0% 34 831 34 192 -639 -1.8% 34 511 -320 -0.9%
PPC 10.0% 38 918 34 088 -4 830 -12.4% 36 503 -2 415 -6.2%
AECI 10.0% 70 570 70 082 -487 -0.7% 70 326 -244 -0.3%
Transnet 11.2% 387 468 375 857 -11 611 -3.0% 381 662 -5 807 -1.5%
OTHER FIRMS
Astral Foods 2.5% 91 583 90 224 -1 359 -1.5% 90 889 -695 -0.8%
Clover 2.3% 92 601 92 166 -435 -0.5% 92 379 -222 -0.2%
Pioneer Foods 2.0% 275 523 274 234 -1 289 -0.5% 274 864 -659 -0.2%
Distell 2.3% 157 727 157 326 -401 -0.3% 157 522 -205 -0.1%
Nampak 6.0% 124 011 121 544 -2 467 -2.0% 122 750 -1 261 -1.0%
Nedbank 0.8% 474 575 473 775 -801 -0.2% 474 166 -409 -0.1%
Telkom 0.8% 428 541 425 393 -3 149 -0.7% 426 932 -1 609 -0.4%
Tsogo Sun 2.0% 120 561 119 326 -1 235 -1.0% 119 930 -631 -0.5%
Netcare 2.0% 429 053 427 553 -1 500 -0.3% 428 286 -767 -0.2%
Source: authors’ calculations.
14Tables A2–A22: Rates of return of net benefits of various own-generation technology options, without wheeling
charges (in comparison with assumed market IRR of 12 per cent)
Table A2
Sibanye
2014/15 electricity consumption (MWh) 4 274 290
Energy intensity 20%
Technology Capacity of MWH % of total Base case IRR High Moderate
plant produced p.a demand scenario IRR scenario IRR
Large coal 66.0% 3 976 295 93.0% 11% 20% 16%
Small coal 85.0% 1 682 796 39.4% 16% 30% 24%
CCGT 71.0% 3 926 856 91.9% 79% 111% 95%
Wind (100 x 2MW) 15.0% 250 974 5.9% 10% 22% 17%
Wind (25 x 2MW) 15.0% 62 744 1.5% 4% 15% 10%
Solar PV 26.0% 22 320 0.5% 3% 12% 8%
Concentrating solar 26.0% 21 637 0.5% 5% 14% 9%
Source: authors’ calculations.
Table A3
Harmony Gold
2014/15 electricity consumption (MWh) 2 798 000
Energy intensity 15%
Technology Capacity of MWH % of total Base case IRR High Moderate
plant produced p.a demand scenario IRR scenario IRR
Large coal 45.0% 2 711 111 96.9% 0% 9% 5%
Small coal 85.0% 1 682 796 60.1% 8% 24% 17%
CCGT 49.0% 2 710 084 96.9% 44% 76% 61%
Wind (100 x 2MW) 15.0% 250 974 9.0% 4% 17% 11%
Wind (25 x 2MW) 15.0% 62 744 2.2% -1% 10% 5%
Solar PV 26.0% 22 320 0.8% -1% 8% 4%
Concentrating solar 26.0% 21 637 0.8% 0% 10% 5%
Source: authors’ calculations.
15Table A4
AngloPlat
2014/15 electricity consumption (MWh) 4 551 144
Energy intensity 11%
Technology Capacity of MWH % of total Base case IRR High Moderate
plant produced p.a demand scenario IRR scenario IRR
Large coal 70.0% 4 217 283 92.7% 22% 29% 26%
Small coal 85.0% 1 682 796 37.0% 31% 43% 37%
CCGT 80.0% 4 424 627 97.2% 123% 147% 135%
Wind (100 x 2MW) 15.0% 250 974 5.5% 22% 33% 28%
Wind (25 x 2MW) 15.0% 62 744 1.4% 15% 25% 20%
Solar PV 26.0% 22 320 0.5% 13% 21% 17%
Concentrating solar 26.0% 21 637 0.5% 15% 24% 19%
Source: authors’ calculations.
Table A5
Lonmin
2014/15 electricity consumption (MWh) 1 043 777
Energy intensity 7%
Technology Capacity of MWH % of total Base case IRR High Moderate
plant produced p.a demand scenario IRR scenario IRR
Large coal 16.0% 963 950 92.4% #NUM! -6% -10%
Small coal 52.0% 1 029 475 98.6% 1% 13% 8%
CCGT 19.0% 1 050 849 100.7% 17% 36% 27%
Wind (100 x 2MW) 15.0% 250 974 24.0% 6% 18% 13%
Wind (25 x 2MW) 15.0% 62 744 6.0% 0% 12% 7%
Solar PV 26.0% 22 320 2.1% 0% 9% 5%
Concentrating solar 26.0% 21 637 2.1% 1% 11% 6%
Source: authors’ calculations.
Table A6
Implats
2014/15 electricity consumption (MWh) 2 335 790
Energy intensity 12%
Technology Capacity of MWH % of total Base case IRR High Moderate
plant produced p.a demand scenario IRR scenario IRR
Large coal 40.0% 2 409 876 103.2% 3% 11% 8%
Small coal 85.0% 1 682 796 72.0% 17% 31% 25%
CCGT 40.0% 2 212 313 94.7% 53% 78% 66%
Wind (100 x 2MW) 15.0% 250 974 10.7% 11% 23% 17%
Wind (25 x 2MW) 15.0% 62 744 2.7% 5% 16% 11%
Solar PV 26.0% 22 320 1.0% 4% 12% 8%
Concentrating solar 26.0% 21 637 0.9% 5% 14% 10%
Source: authors’ calculations.
16Table A7
Kumba Iron Ore
2014/15 electricity consumption (MWh) 498 600
Energy intensity 3%
Technology Capacity of MWH % of total Base case IRR High Moderate
plant produced p.a demand scenario IRR scenario IRR
Large coal 8.0% 481 975 96.7% -7% -4% -5%
Small coal 25.0% 494 940 99.3% 11% 16% 14%
CCGT 8.0% 442 463 88.7% 30% 37% 34%
Wind (100 x 2MW) 15.0% 250 974 50.3% 37% 46% 42%
Wind (25 x 2MW) 15.0% 62 744 12.6% 31% 40% 35%
Solar PV 26.0% 22 320 4.5% 26% 35% 30%
Concentrating solar 26.0% 21 637 4.3% 30% 39% 34%
Source: authors’ calculations.
Table A8
Evraz Highveld Steel
2014/15 electricity consumption (MWh) 1 431 000
Energy intensity 16%
Technology Capacity of MWH % of total Base case IRR High Moderate
plant produced p.a demand scenario IRR scenario IRR
Large coal 23.0% 1 385 679 96.8% -14% -4% -8%
Small coal 70.0% 1 385 832 96.8% 0% 14% 8%
CCGT 25.0% 1 382 696 96.6% 15% 36% 26%
Wind (100 x 2MW) 15.0% 250 974 17.5% 0% 12% 7%
Wind (25 x 2MW) 15.0% 62 744 4.4% -5% 6% 2%
Solar PV 26.0% 22 320 1.6% -4% 4% 1%
Concentrating solar 26.0% 21 637 1.5% -3% 6% 2%
Source: authors’ calculations.
Table A9
Arcelor Mittal
2014/15 electricity consumption (MWh) 3 520 000
Energy intensity 10%
Technology Capacity of MWH % of total Base case IRR High Moderate
plant produced p.a demand scenario IRR scenario IRR
Large coal 58.0% 3 494 320 99.3% 12% 19% 16%
Small coal 85.0% 1 682 796 47.8% 22% 33% 28%
CCGT 62.0% 3 429 086 97.4% 86% 108% 97%
Wind (100 x 2MW) 15.0% 250 974 7.1% 15% 24% 20%
Wind (25 x 2MW) 15.0% 62 744 1.8% 9% 17% 13%
Solar PV 26.0% 22 320 0.6% 7% 14% 10%
Concentrating solar 26.0% 21 637 0.6% 9% 16% 12%
Source: authors’ calculations.
17Table A10
Hulamin
2014/15 electricity consumption (MWh) 285 848
Energy intensity 20%
Technology Capacity of MWH % of total Base case IRR High Moderate
plant produced p.a demand scenario IRR scenario IRR
Large coal 4.0% 240 988 84.3% -3% -1% -2%
Small coal 13.0% 257 369 90.0% 20% 22% 21%
CCGT 5.0% 276 539 96.7% 51% 54% 52%
Wind (100 x 2MW) 15.0% 250 974 87.8% 84% 87% 86%
Wind (25 x 2MW) 15.0% 62 744 21.9% 91% 96% 93%
Solar PV 26.0% 22 320 7.8% 94% 100% 97%
Concentrating solar 26.0% 21 637 7.6% 104% 110% 107%
Source: authors’ calculations.
Table A11
PPC
2014/15 electricity consumption (MWh) 2 160 000
Energy intensity 10%
Technology Capacity of MWH % of total Base case IRR High Moderate
plant produced p.a demand scenario IRR scenario IRR
Large coal 32.0% 1 927 901 89.3% #NUM! -8% #NUM!
Small coal 85.0% 1 682 796 77.9% #NUM! 4% -7%
CCGT 35.0% 1 935 774 89.6% #NUM! 24% 8%
Wind (100 x 2MW) 15.0% 250 974 11.6% #NUM! 0% -9%
Wind (25 x 2MW) 15.0% 62 744 2.9% #NUM! -4% -13%
Solar PV 26.0% 22 320 1.0% #NUM! -4% -10%
Concentrating solar 26.0% 21 637 1.0% #NUM! -3% -8%
Source: authors’ calculations.
Table A12
AECI
2014/15 electricity consumption (MWh) 217 959
Energy intensity 10%
Technology Capacity of MWH % of total Base case IRR High Moderate
plant produced p.a demand scenario IRR scenario IRR
Large coal 3.0% 180 741 82.9% -2% -1% -1%
Small coal 11.0% 217 774 99.9% 25% 26% 26%
CCGT 3.0% 165 924 76.1% 44% 46% 45%
Wind (100 x 2MW) 15.0% 250 974 115.1% 104% 106% 105%
Wind (25 x 2MW) 15.0% 62 744 28.8% 121% 125% 123%
Solar PV 26.0% 22 320 10.2% 138% 144% 141%
Concentrating solar 26.0% 21 637 9.9% 151% 157% 153%
Source: authors’ calculations.
18Table A13
Transnet
2014/15 electricity consumption (MWh) 3 554 822
Energy intensity 11%
Technology Capacity of MWH % of total Base case IRR High Moderate
plant produced p.a demand scenario IRR scenario IRR
Large coal 57.0% 3 434 073 96.6% 13% 22% 18%
Small coal 85.0% 1 682 796 47.3% 24% 39% 32%
CCGT 63.0% 3 484 394 98.0% 91% 121% 106%
Wind (100 x 2MW) 15.0% 250 974 7.1% 16% 29% 23%
Wind (25 x 2MW) 15.0% 62 744 1.8% 10% 22% 16%
Solar PV 26.0% 22 320 0.6% 8% 18% 13%
Concentrating solar 26.0% 21 637 0.6% 10% 20% 15%
Source: authors’ calculations.
Table A14
Astral Foods
2014/15 electricity consumption (MWh) 280 560
Energy intensity 3%
Technology Capacity of MWH % of total Base case IRR High Moderate
plant produced p.a demand scenario IRR scenario IRR
Wind (10 x 2MW) 15.0% 25 097 8.9% 4% 14% 10%
Wind (25 x 2MW) 15.0% 62 744 22.4% 1% 11% 7%
Solar PV 26.0% 22 320 8.0% 3% 11% 7%
Concentrating solar 26.0% 21 637 7.7% 4% 13% 9%
Source: authors’ calculations.
Table A15
Clover
2014/15 electricity consumption (MWh) 89 849
Energy intensity 2%
Technology Capacity of MWH % of total Base case IRR High Moderate
plant produced p.a demand scenario IRR scenario IRR
Wind (10 x 2MW) 15.0% 25 097 27.9% 24% 32% 28%
Wind (25 x 2MW) 15.0% 62 744 69.8% 21% 30% 26%
Solar PV 26.0% 22 320 24.8% 20% 28% 24%
Concentrating solar 26.0% 21 637 24.1% 23% 32% 27%
Source: authors’ calculations.
Table A16
Pioneer Foods
2014/15 electricity consumption (MWh) 266 172
Energy intensity 2%
Technology Capacity of MWH % of total Base case IRR High Moderate
plant produced p.a demand scenario IRR scenario IRR
Wind (10 x 2MW) 15.0% 25 097 9.4% 11% 20% 16%
Wind (25 x 2MW) 15.0% 62 744 23.6% 8% 17% 13%
Solar PV 26.0% 22 320 8.4% 8% 16% 12%
Concentrating solar 26.0% 21 637 8.1% 10% 18% 14%
Source: authors’ calculations.
19Table A17
Distell
2014/15 electricity consumption (MWh) 82 793
Energy intensity 2%
Technology Capacity of MWH % of total Base case IRR High Moderate
plant produced p.a demand scenario IRR scenario IRR
Wind (10 x 2MW) 15.0% 25 097 30.3% 65% 70% 68%
Wind (25 x 2MW) 15.0% 62 744 75.8% 77% 84% 80%
Solar PV 26.0% 22 320 27.0% 82% 89% 85%
Concentrating solar 26.0% 21 637 26.1% 90% 98% 94%
Source: authors’ calculations.
Table A18
Nampak
2014/15 electricity consumption (MWh) 509 385
Energy intensity 6%
Technology Capacity of MWH % of total Base case IRR High Moderate
plant produced p.a demand scenario IRR scenario IRR
Wind (10 x 2MW) 15.0% 25 097 4.9% 22% 31% 27%
Wind (25 x 2MW) 15.0% 62 744 12.3% 20% 29% 24%
Solar PV 26.0% 22 320 4.4% 19% 27% 23%
Concentrating solar 26.0% 21 637 4.2% 22% 30% 26%
Source: authors’ calculations.
Table A19
Nedbank
2014/15 electricity consumption (MWh) 165 273
Energy intensity 1%
Technology Capacity of MWH % of total Base case IRR High Moderate
plant produced p.a demand scenario IRR scenario IRR
Wind (10 x 2MW) 15.0% 25 097 15.2% 15% 24% 20%
Wind (25 x 2MW) 15.0% 62 744 38.0% 12% 21% 17%
Solar PV 26.0% 22 320 13.5% 12% 20% 16%
Concentrating solar 26.0% 21 637 13.1% 14% 22% 18%
Source: authors’ calculations.
Table A20
Telkom
2014/15 electricity consumption (MWh) 650 000
Energy intensity 1%
Technology Capacity of MWH % of total Base case IRR High Moderate
plant produced p.a demand scenario IRR scenario IRR
Wind (10 x 2MW) 15.0% 25 097 3.9% #NUM! 2% -5%
Wind (25 x 2MW) 15.0% 62 744 9.7% #NUM! 0% -7%
Solar PV 26.0% 22 320 3.4% -12% 1% -4%
Concentrating solar 26.0% 21 637 3.3% -11% 2% -3%
Source: authors’ calculations.
20Table A21
Tsogo Sun
2014/15 electricity consumption (MWh) 255 000
Energy intensity 2%
Technology Capacity of MWH % of total Base case IRR High Moderate
plant produced p.a demand scenario IRR scenario IRR
Wind (10 x 2MW) 15.0% 25 097 9.8% 0% 12% 7%
Wind (25 x 2MW) 15.0% 62 744 24.6% -2% 9% 4%
Solar PV 26.0% 22 320 8.8% 0% 9% 5%
Concentrating solar 26.0% 21 637 8.5% 1% 10% 6%
Source: authors’ calculations.
Table A22
Netcare
2014/15 electricity consumption (MWh) 309 733
Energy intensity 2%
Technology Capacity of MWH % of total Base case IRR High Moderate
plant produced p.a demand scenario IRR scenario IRR
Wind (10 x 2MW) 15.0% 25 097 8.1% 15% 24% 20%
Wind (25 x 2MW) 15.0% 62 744 20.3% 12% 21% 17%
Solar PV 26.0% 22 320 7.2% 12% 19% 16%
Concentrating solar 26.0% 21 637 7.0% 14% 22% 18%
Technologies with IRRs greater than 12 are highlighted in green. If plant capacity falls below 55 per cent, i.e.
turns red, then the technology is unviable.
Source: authors’ calculations.
Table A23: Own-generation potential with 100 per cent wheeling charges
Base High Moderate
Sibanye 3 926 856 3 926 856 3 926 856
Harmony Gold - - -
AngloPlat 4 424 627 4 424 627 4 424 627
Lonmin - - -
Implats - 250 974 -
Kumba Iron Ore 250 974 62 744 62 744
Evraz Highveld Steel - - -
Arcelor Mittal 3 429 086 3 429 086 3 429 086
Hulamin 250 974 250 974 250 974
PPC - - -
AECI 250 974 250 974 250 974
Transnet 3 484 394 3 484 394 3 484 394
Astral Foods - - -
Clover 22 320 22 320 22 320
Pioneer Foods - 25 097 21 637
Distell 62 744 62 744 62 744
Nampak 62 744 62 744 62 744
Nedbank - 25 097 22 320
Telkom - - -
Tsogo Sun - - -
Netcare 21 637 25 097 25 097
Total (MWH) 16 187 330 16 303 728 16 046 517
Eskom sales (2013/14) GWH 217 903 217 903 217 903
Eskom sales (2013/14) MWH 217 903 000 217 903 000 217 903 000
% of Eskom sales 7.4% 7.5% 7.4%
Source: authors’ calculations.
21Table A24: Own-generation potential with 60 per cent wheeling charges
Base High Moderate
Sibanye 3 926 856 3 976 295 3 926 856
Harmony Gold - 1 682 796 -
AngloPlat 4 424 627 4 424 627 4 424 627
Lonmin - - -
Implats - 1 682 796 1 682 796
Kumba Iron Ore 250 974 250 974 250 974
Evraz Highveld Steel - - -
Arcelor Mittal 3 429 086 3 494 320 3 494 320
Hulamin 250 974 250 974 250 974
PPC - - -
AECI 250 974 250 974 250 974
Transnet 3 484 394 3 484 394 3 484 394
Astral Foods - - -
Clover 25 097 25 097 25 097
Pioneer Foods - 25 097 25 097
Distell 62 744 62 744 62 744
Nampak 62 744 62 744 62 744
Nedbank 21 637 25 097 25 097
Telkom - - -
Tsogo Sun - - -
Netcare 25 097 62 744 25 097
Total (MWH) 16 215 204 19 761 673 17 991 791
Eskom sales (2013/14) GWH 217 903 217 903 217 903
Eskom sales (2013/14) MWH 217 903 000 217 903 000 217 903 000
% of Eskom sales 7.4% 9.1% 8.3%
Source: authors’ calculations.
Table A25: Own-generation potential with zero per cent wheeling charges
Base High Moderate
Sibanye 3 926 856 3 976 295 3 976 295
Harmony Gold - 1 682 796 1 682 796
AngloPlat 4 424 627 4 424 627 4 424 627
Lonmin - 250 947 250 974
Implats 1 682 796 1 682 796 1 682 796
Kumba Iron Ore 250 947 250 947 250 974
Evraz Highveld Steel - 1 385 832 -
Arcelor Mittal 3 494 320 3 494 320 3 494 320
Hulamin 250 947 250 947 250 974
PPC - - -
AECI 250 947 250 947 250 974
Transnet 3 484 394 3 484 394 3 484 394
Astral Foods - 62 744 -
Clover 62 744 62 744 62 744
Pioneer Foods 25 097 62 744 62 744
Distell 62 744 62 744 62 744
Nampak 62 744 62 744 62 744
Nedbank 62 744 62 744 62 744
Telkom - - -
Tsogo Sun - 25 097 -
Netcare 62 744 62 744 62 744
Total (MWH) 18 104 651 21 599 153 20 125 588
Eskom sales (2013/14) GWH 217 903 217 903 217 903
Eskom sales (2013/14) MWH 217 903 000 217 903 000 217 903 000
% of Eskom sales 8.3% 9.9% 9.2%
Source: authors’ calculations.
22You can also read