SCENAR 2030 PATHWAYS FOR THE EUROPEAN AGRICULTURE AND FOOD SECTOR BEYOND 2020 - Europa EU
←
→
Page content transcription
If your browser does not render page correctly, please read the page content below
SCENAR 2030
PATHWAYS FOR THE EUROPEAN AGRICULTURE
    AND FOOD SECTOR BEYOND 2020
          SUMMARY REPORT
         FOOD SYSTEMS EFFICIENT, INCLUSIVE AND RESILIENT

                                                           SUSTAINABLE USE OF NATURAL RESOURCES

                                                                                                  ADDRESS CLIMATE CHANGE

                                                                                                                           SUSTAINABLE RURAL AREAS

                                                                                                                                                     ECO FRIENDLINESS

                                                                                                                                                                                R. M'barek, J. Barreiro-Hurle,
                                                                                                                                                                        P. Boulanger, A. Caivano, P. Ciaian,
                                                                                                                                                                        H. Dudu, M. Espinosa, T. Fellmann,
                                                                                                                                                                             E. Ferrari, S. Gomez y Paloma,
                                                                                                                                                                             C. Gorrin Gonzalez, M. Himics,
                                                                                                                                                                         K. Louhichi, A. Perni, G. Philippidis,
                                                                                                                                                                        G. Salputra, P. Witzke, G. Genovese
                                                                                                                                                                                                 EUR 28883 EN
                                                                     Joint
                                                                     Research
                                                                     Centre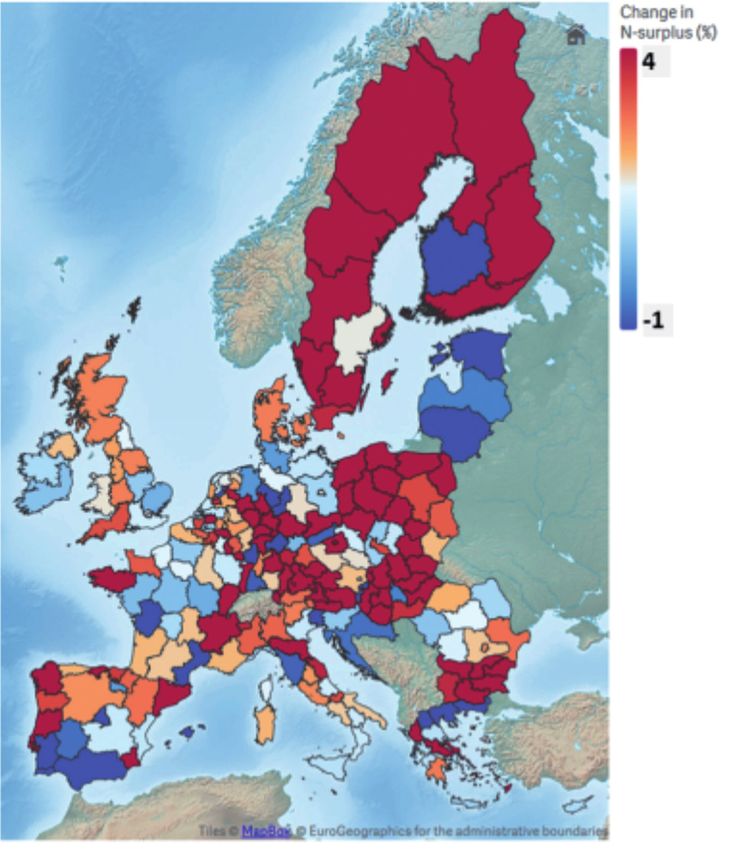
This publication is a Science for Policy report by the Joint Research Centre (JRC), the European Commission’s science and
knowledge service. It aims to provide evidence-based scientific support to the European policymaking process. The scientific
output expressed does not imply a policy position of the European Commission. Neither the European Commission nor any
person acting on behalf of the Commission is responsible for the use that might be made of this publication.

Contact information
Name: Robert M’barek
Address:
Email: Robert.M’barek@ec.europa.eu
Tel.: +34-954488489

JRC Science Hub
https://ec.europa.eu/jrc

JRC109053

EUR 28883 EN

PDF     ISBN 978-92-79-76678-7 ISSN 1831-9424                doi:10.2760/749027

Luxembourg: Publications Office of the European Union, 2017

© European Union, 2017

Reuse is authorised provided the source is acknowledged. The reuse policy of European Commission documents is regulated by
Decision 2011/833/EU (OJ L 330, 14.12.2011, p. 39).
For any use or reproduction of photos or other material that is not under the EU copyright, permission must be sought directly
from the copyright holders.

How to cite this report: R. M’barek, J. Barreiro-Hurle, P. Boulanger, A. Caivano, P. Ciaian, H. Dudu, M. Espinosa, T. Fellmann, E. Ferrari,
S. Gomez y Paloma, C. Gorrin Gonzalez, M. Himics, K. Louhichi, A. Perni, G. Philippidis, G. Salputra, P. Witzke, G. Genovese; Scenar
2030 - Pathways for the European agriculture and food sector beyond 2020 (Summary report), EUR 28883 EN, Publications
Office of the European Union, Luxembourg, 2017, ISBN 978-92-79-76678-7, doi:10.2760/749027, JRC109053.

All images © European Union 2017.

Complex pathways for the European agriculture and food sector by 2030
Analysing stylised scenarios with economic modelling tools reveals complex relations, incentives and trade-offs of the different
policy instruments, in particular regarding the environmental dimension. Marginal areas of the EU are most vulnerable to drastic
policy changes.

Visualisation of results
The reader is invited to consult the JRC agro-economic portal DataM at https://datam.jrc.ec.europa.eu for more details of the
modelling results in interactive dashboards. The interactive infographics about this study is under the “Agro-economic studies”
visualisation section.

Direct link:

Printed in Spain

SCENAR 2030
Pathways for the European agriculture
and food sector beyond 2020
SUMMARY REPORT

TABLE OF CONTENTS

Acknowledgements
Executive summary

1   The Scenar 2030 approach
2   The scenarios
3   The EU agri-food system between markets and
    societal challenges (scenarios)
    3.1 Economic dimension
    3.2 Social dimension
    3.3 Environmental dimension

4   Scenar 2030 and the long road ahead: achievements
    and remaining challenges
Table of contents
Acknowledgements............................................................................................................................................................................................. 9
Executive summary............................................................................................................................................................................................ 10
1 The Scenar 2030 approach.............................................................................................................................................................. 15
2 The scenarios................................................................................................................................................................................................ 17
3 The EU agri-food system between markets and societal challenges (scenarios)......................... 19
3.1 Economic dimension............................................................................................................................................................................. 19
3.2 Social dimension..................................................................................................................................................................................... 23
3.3 Environmental dimension................................................................................................................................................................... 25
4 Scenar 2030 and the long road ahead: achievements and remaining challenges...................... 31
List of figures and tables.............................................................................................................................................................................. 33
Scenar 2030 - Pathways for the European agriculture and food sector beyond 2020 - Summary report 7ACKNOWLEDGEMENTS / 0 EXECUTIVE SUMMARY
Acknowledgements
The ‘Scenar 2030 – Pathways for the European agriculture       The CAPRI model work was carried out by the JRC CAPRI
and food sector beyond 2020’ report was prepared by the        team under the leadership of Jesus Barreiro-Hurle (JBH)
European Commission’s Joint Research Centre (JRC) with         with support from Peter Witzke (PW) at EuroCARE. The
support from Wageningen Economic Research (WECR) and           other team members are: Thomas Fellmann (TF), Mihaly
EuroCARE, as well as contributions from the Directorate-       Himics (MH) and Guna Salputra (GS). MH provided the
General for Agriculture and Rural Development.                 baseline; MH and GS, with the support of PW, implemented
                                                               the scenarios; and TF, MH, GS and JBH analysed and cross-
The overall coordination of the study was the responsibility   checked the results and drafted the relevant sections of
of Robert M’barek, who also edited the report together         the report.
with George Philippidis.
                                                               The IFM-CAP model work for Scenar 2030 was carried
The initial design of the study was supported by senior        out by the JRC IFM-CAP team under the leadership of
staff of the European Commission (John Bensted-Smith,          Pavel Ciaian (PC). The other team members are: Kamel
Tassos Haniotis, David Wilkinson, Jacques Delincé, Pierluigi   Louhichi (KL), Maria Espinosa (ME), Angel Perni (AP) and
Londero and Giampiero Genovese) and model experts, in          Sergio Gomez y Paloma (SGP). The tasks were performed
particular Hans van Meijl, Martin Banse, Wolfgang Britz,       by the team members as follows: data preparation and
Harald Grethe, Thomas Heckelei and John Helming.               implementation of CAP direct payments was performed
                                                               by ME, KL, PC and AP; baseline preparation was performed
The conceptual development was supported by colleagues         by PC, KL and ME; model setting and the implementation
from the Directorate-General for Agriculture and Rural         of scenarios was undertaken by KL, PC, ME and AP; result
Development, coordinated by Koen Dillen.                       visualisation was carried out by AP, KL and ME; and result
                                                               cross-checking and analysis, and drafting relevant sections
The MAGNET model work was carried out by the JRC CGE           of the report was conducted by PC, KL, ME, AP and SGP.
team under the leadership of Emanuele Ferrari (EF) with
valuable support from George Philippidis (GP) at WECR.         The visualisation of results was implemented mainly
The other team members are: Pierre Boulanger (PB), Hasan       by Arnaldo Caivano, Celso Gorrin Gonzalez and Saulius
Dudu (HD) and Robert M’barek (RM). GP and EF provided          Tamosiunas. Emiliano Bruno and Massimiliano Fucci
the baseline and implemented the scenarios; HD took care       designed the cover page. Administrative support was
of result visualisation; and RM, PB, HD and EF analysed        provided by Sandra Marcolini, Mathilde Drouin, Els De
the results and drafted the relevant sections of the report.   Rademaker and Tanja Acuna.

                      Scenar 2030 - Pathways for the European agriculture and food sector beyond 2020 - Summary report   9
Executive summary
The Common Agricultural Policy (CAP) of the European investigation before any conclusions are made with regard
Union (EU) faces the challenge of evolving towards a to which policy option best meets them. In this context,
multifunctional policy that responds to the constantly expanding the analysis to a food systems approach could
changing needs of society. The CAP must respond to provide further insights into other impacts of the policy
demands related to increased market efficiency and options.
competitiveness; guarantee a territorial balance; fostering
jobs and ‘smart’ growth; contributing to climate change The study considers three scenarios, designed beginning
mitigation while adapting to a changing climate; ensuring of 2016, that take polar paths, against a reference
responsible and sustainable biologically renewable scenario, to characterise different visions for the CAP. The
resource management; and still respecting its initial aim first scenario, Income & Environment (Inc&Env), assumes
of ensuring food security. a more restrictive compliance with agri-environmental
objectives needed for direct payment eligibility while
The present report was carried out by the Joint Research maintaining the EU’s CAP budget at its current nominal
Centre (JRC) and external experts in the context of the level. The second scenario, Liberalisation & Productivity
JRC’s analytical support to the Directorate-General for (Lib&Prod), assumes a strong reduction in subsidies (the
Agriculture and Rural Development. The report analyses removal of Pillar 1 direct payments, which are returned to
the impact on the agricultural sector of stylised scenarios, tax payers), with a shift of Pillar 2 payments to productivity-
reflecting the main drivers of policy debate. While the increasing measures and further trade liberalisation1. As a
scenarios presented do not represent real policy options, variant of the Lib&Prod scenario, the No Policy (NoCAP)
they underline the potential for changes to current agri- scenario also eliminates Pillar 2 payments, thus removing
food policies to address societal challenges and demands. all budgetary support to agriculture.
The analysis of the social, economic and environmental Scenario results emphasize the vulnerability of small
impacts of various options for the next CAP employs the farms, in particular in marginal areas of the EU, where
iMAP platform models MAGNET, CAPRI and IFM-CAP in agricultural subsidies are economically more important
an integrated manner, covering different spatial scales than market income. The trade liberalisation scenarios
(global, EU, Member State, NUTS 2 region and individual reveal opportunities for some but risks for most agri-food
farm levels). sectors. Special attention must be paid to the complex
relations, incentives and trade-offs of the different
The general caveats that apply to all modelling exercises instruments, in particular regarding the environmental
(i.e. a simplified representation of reality, no forecasting dimension. The objective of direct payments has to be
models, high uncertainty, etc.) apply to this study. Moreover, clearly defined and translated into implementation rules
many of the concerns that surround the agricultural policy (i.e. targeting, conditionality) during the policy design
debate, such as generational renewal, value distribution phase, as they still represent the largest share of the
along the food chain and structural change, cannot be budget dedicated to agriculture and steer most of the
captured in the model results and warrant additional sector’s responses. If the objective is redistribution,
1
Cumulative impact of 12 bilateral or regional trade agreements, as described JRC report (2016) “Cumulative economic impact of future trade agreements on EU agricul-
ture”, http://ec.europa.eu/agriculture/trade-analysis/impact-assessment/.
10 Scenar 2030 - Pathways for the European agriculture and food sector beyond 2020 - Summary reportthen the target population needs to be better defined; farm income, greenhouse gas (GHG) emissions from the
if the objective is environmental performance, then agri-food sector, nitrogen surplus, utilised agricultural area
conditionality has to be better designed. and farm jobs. Negative values show a reduction in these
indicators under a given scenario and positive values
The policy scenarios are assessed with regard to their an increase. While an increase in agricultural production
impact on markets (production, demand, trade and prices), and farm income are considered a positive outcome, an
land use, the environment and farmer income from the increase in GHG emissions and nitrogen surplus indicate a
global level to the farm level. The figure below summarises negative impact on the environment and the climate.
the impact of the three scenarios on agricultural production,
Overview of scenario impacts
Agricultural production
5,0%
0,0%
-5,0%
Farm jobs -10,0% Farm income
-15,0%
-20,0%
-25,0%
Utilized agricultural area GHG emissions agrifood
Nitrogen surplus
Inc&Env Lib&Prod NoCap Reference
The Inc&Env scenario shows only marginal changes for through extended greening measures and a limit on
production, land use and emissions. The more pronounced nitrogen use, is associated with a small, economy-wide
focus of this scenario on the environment, implemented cost, but contributes to an improving trend for agricultural
Scenar 2030 - Pathways for the European agriculture and food sector beyond 2020 - Summary report 11nitrogen balance. However, the reduction of about 1% of Under both the Lib&Prod and NoCAP scenarios, there
the nitrogen surplus in this scenario compared with the would be trade-offs between slightly reduced production,
reference is not sufficient to address the nitrogen balance a mixed impact on the environment and a strongly
problem in areas already in surplus. Under this scenario, negative impact on farm income. Beyond the structural
farm income in the EU increases, but not its distribution, job contraction common in baseline and all scenarios,
as measured by a Gini coefficient. Thus, key challenges most of the additional impacts on jobs will affect
related to the environment and a fair standard of living for small farms in the net beneficiary countries, and would
farmers are only partly addressed, suggesting that even increase farm income inequality even more and put the
more stringent environmental and distributional conditions resilience of many farms at risk. The scenarios show, also
are needed to achieve those objectives. as a consequence of further trade liberalisation, that
there would be an increase in the vulnerability of crop
The Lib&Prod scenario and its even more extreme and cattle/beef farmers. As production decreases and
variant, the NoCAP scenario, have a much stronger consumption remains more or less constant, Europe would
impact on farm income, land use, production and become a net importer of many commodities under these
emissions. The decrease in agricultural production, leading scenarios. This gives rise to concerns about the transfer
to price increases in the NoCAP scenario, is within the of the positive and negative externalities associated with
limit of interannual variation, but is associated with a agricultural production to other world regions.
pronounced reduction in land use. This affects territorial
balance, with marginal areas being further marginalised Finally, the aggregated welfare results are contingent on
or, at worst, abandoned, possibly leading to environmental how effectively the funds released from agricultural policy
degradation, with fewer jobs, and intensive agricultural are used for alternative public expenditure. Our analysis
areas being further concentrated. Less production, in assumes that expenditure in other sectors will increase
principle, reduces the overall use of resources and thus welfare.
reduces environmental impacts like, for example, GHG
emissions. However, if GHG emissions decline in the EU, The Scenar 2030 scenarios show that designing an
this decline is likely to be levelled out through the leakage agricultural policy that tackles all of its societal objectives
effect, by which increased emissions occur in the other is a daunting task. At best, the policy will have to focus on
world regions to which production is shifted. Releasing land key priorities and accept that trade-offs will have to be
from agricultural uses could also provide an opportunity made with regard to others. An internationally competitive
for the creation of carbon dioxide sinks, such as forests agriculture sector in Europe might come at the expense of
and other ecological areas, with important benefits for increased environmental pressures or further job losses in
biodiversity. However, additional measures would be the sector.
needed to ensure that abandoned land is indeed used
to benefit the environment. While a reduction in nitrogen Further research must also be dedicated to identifying
use could be seen as an environmental improvement its the areas in which investing in model linkage does in
reduction will not be homogenously distributed and might fact improve analytical capacity. The JRC should also
even lead to an increase in nitrogen use in some areas, invest some additional resources in improving key
which could increase the corresponding environmental parameters, such as the impact on productivity of
pressure. Pillar 2 payments.
12 Scenar 2030 - Pathways for the European agriculture and food sector beyond 2020 - Summary reportAt the time of finalising this report, the main uncertainties Brexit negotiations. The JRC will continue to support the
about the future of the agricultural sector and its related analysis of these topics using the tools described in this
policies stemmed from the early stages of discussions report.
on the Multiannual Financial Framework 2021-2027 and
Scenar 2030 - Pathways for the European agriculture and food sector beyond 2020 - Summary report 13THE SCENAR 2030 1 APPROACH
1         The Scenar 2030 approach
The CAP is evolving into a multifunctional policy that can                          models of the iMAP platform hosted by the JRC. This
respond to the constantly changing needs of society. The                            suite of economic models ranges from one that models
CAP must meet market-efficiency and competitiveness                                 macroeconomic aspects (a CGE model, i.e. MAGNET4) to
criteria; be a motor of job creation and ‘smart’ growth also in                     those that model more sectoral economic aspects (a PE
rural areas; continue to aid the fight against climate change                       model, i.e. CAPRI5) and microeconomic aspects related to
as an environmentally accountable policy measure; act (in                           the impact on individual farms (IFM-CAP6).
tandem with other policies) as a custodian of responsible and
sustainable biologically renewable resource management;                             MAGNET, CAPRI and IFM-CAP are run in an integrated
and still respect its initial aim of ensuring sufficient amounts                    manner on different spatial scales (global, EU, MS, NUTS 2,
of food for all citizens at affordable prices.                                      individual farm), having as a common reference the EU
                                                                                    Agricultural Outlook published at the end of 2015 (DG
Given the above, the design of post-2020 farm policy is                             AGRI, 2015), generated with the AGLINK-COSIMO7 PE
once again under consultation and a wide range of policy                            model.
options are being considered, from retaining the status
quo to radical reform.                                                              The reference scenario in Scenar 2030 is based on ‘EU
                                                                                    Agricultural Outlook: Prospects for EU agricultural markets
The present report2, in the tradition of the ‘Scenar 2020’                          and income 2015-2025’, published in December 2015
studies, contributes to the analysis of selected scenarios                          (DG AGRI, 2015). It assumes the implementation of the
and provides a framework for further exploration of the                             2013 CAP reforms, as well as the ratified FTAs.8
process of designing the future CAP.3 It complements
recent, more qualitative, forward-looking studies with                              The reader is reminded that the general caveats that apply
a well-elaborated baseline and multiple perspectives                                to all modelling exercises (i.e. a simplified representation
through the use of different models.                                                of reality, no forecasting models, high uncertainty, etc.)
                                                                                    apply here. Furthermore, using three different models and
This analysis of the social, economic and environmental                             their (soft) linkages adds complexity and a certain degree
impacts of several options for the next CAP employs                                 of inconsistency (e.g. different commodity categories).

                                                                     2025 DG AGRI
               PRIMES              GLOBIOM                           Market Outlook                                        PRIMES            IMAGE

                   GHG 2030        Trends 2030                             Production
                                                                           Net trade,                                GHG 2030       Land supply 2030

    Productivity
                                                     CAPRI 2025                                MAGNET                                  Productivity
                                                     CAPRI 2030                                 2030
                                                                                                                                       Models in
                                                            Prices         Yields                                                     Scenar 2030

                                                                                                                                         External
                                                                IFM-CAP                                                                  models

                                                                  2030                                                                  Data flow
FIGURE 1: MODEL CHAIN.
Source: own presentation.

2
  This report is a summary of the full Scenar 2030 report, https://datam.jrc.ec.europa.eu/datam/mashup/SCENAR2030.
3
  See http://ec.europa.eu/smart-regulation/roadmaps/docs/2017_agri_001_cap_modernisation_en.pdf.
4
  Modular Applied GeNeral Equilibrium Tool (MAGNET), http://www3.lei.wur.nl/magnet/.
5
  Common Agricultural Policy Regionalised Impact (CAPRI) model; http://www.capri-model.org/docs/capri_documentation.pdf.
6
  Individual Farm Model for Common Agricultural Policy Analysis (IFM-CAP); https://doi.org/10.1093/erae/jbx029.
7
  AGLINK-COSIMO; http://publications.jrc.ec.europa.eu/repository/bitstream/JRC92618/jrc92618%20online.pdf.
8
  Asian FTA means Japan, Vietnam, Thailand, Philippines and Indonesia.

                              Scenar 2030 - Pathways for the European agriculture and food sector beyond 2020 - Summary report                         15
THE SCENARIOS 2
2             The scenarios

Scenar 2030 looks at three scenarios that take polar paths,                                            eligibility, while keeping the EU CAP budget at its current
against a reference scenario (the baseline), to characterise                                           nominal level.
different visions for the CAP.
                                                                                                       The second scenario (Lib&Prod) was defined to include a
The baseline, or reference scenario (or the business-as-                                               strong reduction in subsidies (the removal of Pillar 1 direct
usual scenario), was generated on the basis of the latest                                              payments, which are returned to tax payers), with a shift
available reference at the time of the study, i.e. the 2015                                            to productivity-increasing measures and further trade
EU Agricultural Outlook9, with a perspective up to 2025.                                               liberalisation.
The baseline was extended up to 2030 in order to cover
the timeline of the Scenar 2030 study.                                                                 The third scenario (NoCAP) is a variant of the Lib&Prod
                                                                                                       scenario, but it also eliminates Pillar 2 payments, and is
The first scenario (Inc&Env) was defined on the basis of                                               basically intended to represent a removal of agricultural
a more restrictive level of farmer compliance with agri-                                               policy.
environmental objectives needed for direct payment

                    Income & Environment                                        Liberalisation & Productivity                                               NoCAP
                         (Inc&Env)                                                       (Lib&Prod)                                                (Incl. liberalisation)

          Extended greening,                   Pillar 1&2                     Trade               Pillar 1         Pillar 2           Trade                 Pillar 1         Pillar 2
            Nitrogen limits                  Budget changes               liberalisation      Budget removed    Investments       liberalisation        Budget removed      removed

                                                                                                                   Productivity

                               CAPRI                          MAGNET                   CAPRI                      MAGNET                      CAPRI                         MAGNET
                               2030                            2030                    2030                        2030                       2030                           2030

                                  Prices       Yields                                      Prices    Yields                                         Prices    Yields

    Extended greening,               IFM-CAP                                                  IFM-CAP                                                  IFM-CAP
      Nitrogen limits
                                       2030                                                     2030                                                     2030

                         Various indicators on different spatial scales          Various indicators on different spatial scales         Various indicators on different spatial scales

FIGURE 2: OVERVIEW OF THE SCENARIOS.
Source: own presentation.

The policy scenarios are assessed with regard to their                                                 to the farm level. In the following section, the key results
impact on markets (production, demand, trade and prices),                                              are presented in relation to their economic, social and
land use, environment and farmer income from the global                                                environmental dimensions.

9
 EU Agricultural Outlook: Prospects for EU agricultural markets and income 2015-2025. Directorate-General for Agriculture and Rural Development, European Com-
mission.

                                           Scenar 2030 - Pathways for the European agriculture and food sector beyond 2020 - Summary report                                              17
THE EU AGRI-FOOD SYSTEM
3 BETWEEN MARKETS AND
SOCIETAL CHALLENGES
(SCENARIO RESULTS)3 The EU agri-food system between markets
and societal challenges (scenario results)
In the following section, the key results of the three in terms of changes with respect to the results given by
scenarios are described according to the economic, social the baseline (reference or business as usual scenario).10
and environmental dimensions. The results are presented
3.1 | Economic dimension
Agricultural production is declining, but not disappearing, in most extreme
scenarios
The results show a small negative impact on agricultural 4% and 6%, respectively. The differences between EU-15
production under the Inc&Env scenario, whereas under the and EU-13 are negligible, and the variability between EU
Lib&Prod and NoCAP scenarios production decreases by MSs is greatest under the NoCAP scenario.
Inc&Env Lib&Prod NoCap
0%
-1%
-2%
-3%
-4%
-5%
-6%
-7%
EU28 EU15 EU13
FIGURE 3: AGRICULTURAL PRODUCTION, EU-28, TOTAL QUANTITY CHANGES COMPARED WITH REFERENCE (%).
Source: Scenar 2030, CAPRI model.
Producer prices increase if the CAP is eliminated
Following the small decreases in agricultural production elimination of all CAP payments, the stronger EU production
under the Inc&Env scenario, aggregated EU producer declines cannot be fully compensated by imports, leading
prices increase by about 1%. In the Lib&Prod scenario, to increased aggregated EU producer prices of about 5% in
EU producer prices drop by almost 1%, as EU production the NoCAP scenario.
decreases are compensated by cheaper imports. With the
6%
5%
4%
3%
2%
1%
0%
-1%
Inc&Env Lib&Prod NoCap
-2%
EU28 EU15 EU13
FIGURE 4: PRODUCER PRICE, EU-28, CHANGES COMPARED WITH REFERENCE (%).
Source: Scenar 2030, CAPRI model.
10
More details can be found under this link: https://datam.jrc.ec.europa.eu/datam/mashup/SCENAR2030.
Scenar 2030 - Pathways for the European agriculture and food sector beyond 2020 - Summary report 19More imports than exports 30.000
20.000
Imports increase in all scenarios, leading to a decrease in 10.000
Imports
the EU trade balance. Although exports in the Lib&Prod 0 Exports
scenario grow substantially, also thanks to the ambitious Trade Balance
-10.000
trade agenda pursued by the EU, they cannot compensate
for the higher level of imports. In the NoCAP scenario, -20.000
the trade balance is reduced by about EUR 25 billion, -30.000
Inc&Env Lib&Prod NoCap
billion trade surplus in 2030 under the reference scenario,
bringing back the EU to net importer status. FIGURE 5: EU IMPORTS, EXPORTS AND TRADE BALANCE CHANGES (EUR
MILLION) COMPARED WITH REFERENCE, 2030.
Source: Scenar 2030, MAGNET model.
Income of farms decreases strongly when the CAP is abolished
Under the Inc&Env scenario, gross farm income increases following the larger decreases in EU production. Again,
by around 4.5%, mainly through higher prices, with the the EU-13 farming sector experiences a stronger negative
CAP budget remaining stable. The negative effects in the impact on income than the EU-15, reflecting a generally
Lib&Prod scenario (–20%) mean that there is a slightly higher importance of CAP payments in total income..
larger income decrease than under the NoCAP scenario,
10,0%
Inc&Env Lib&Prod NoCap
0,0%
-10,0%
-20,0%
-30,0%
-40,0%
EU28 EU15 EU13
FIGURE 6: GROSS FARM INCOME (% CHANGE RELATIVE TO REFERENCE).
Source: Scenar 2030, CAPRI model.
The simulated effects are less heterogeneous between
Inc&Env Lib&Prod NoCAP
economic sizes classes than they are across farm
Specialist COP 1.2 –23.5 –22.6
specialisations. However, there is a relatively consistent
Specialist other field crops 0.4 –2.1 –0.2
pattern indicating an inverse relationship between the
Specialist horticulture –0.9 1.9 0.8
magnitude of the simulated impacts and economic farm
Specialist wine 0.4 –7.1 –7.6
size in all three simulated scenarios. Among the most
Specialist orchards – fruits –2.7 –4.0 –6.2
affected farm specialisations, mainly in the Lib&Prod and
Specialist olives –11.6 –20.6 –19.9
NoCAP scenarios, are the specialists cattle, COP (cereals,
Permanent crops combined –1.5 –7.7 –9.2
Specialist milk –0.1 –8.7 2.6
oilseeds and protein), and olives.
Specialist sheep and goats –0.5 –12.1 –11.9
Specialist cattle –2.3 –36.7 –31.8
Specialist granivores 1.0 –3.7 3.6
Mixed crops –0.3 –2.8 –3.6
Mixed livestock 1.8 –12.0 –3.0
Mixed crops and livestock 0.2 –14.8 –9.7
TABLE 1: INCOME VARIATION BY FARM SPECIALISATION IN THE EU-27 (%
CHANGE RELATIVE TO REFERENCE).
Source: Scenar2030, IFM-CAP.
20 Scenar 2030 - Pathways for the European agriculture and food sector beyond 2020 - Summary reportOverall, economic growth effects are small, but are substantial for some
Member States
The CAP has an important role to play in territorial cohesion. EU-13. In general, the gains observed in the scenarios with
The effect of the scenarios on GDP is very small (maximum a large or complete reduction in CAP payments for the EU-
–0.3% in the NoCAP scenario for the EU-13); however, 15 countries drive the EU-28 GDP to a small but positive
under all scenarios, changes in GDP are negative for the value.
0,3%
0,2%
0,1%
0,0%
Inc&Env Lib&Prod NoCap
-0,1%
-0,2%
-0,3%
-0,4%
EU28 EU15 EU13
FIGURE 7: GDP, CHANGE FROM REFERENCE (%), 2030.
Source: Scenar 2030, MAGNET model.
When looking at the individual MS results, sizeable One can observe that most of the EU-13 and some EU-15
impacts are observed for Croatia, Cyprus, Greece, Latvia countries not only experience a high absolute per capita
and Lithuania, who lose up to 1.7% of their GDP compared welfare loss, but even more in relative terms (here in %
with the reference scenario. change of household expenditure).
Small increase of prosperity, but only for richer EU-15 countries
Using so-called Equivalent variation (EV) as a welfare The welfare decomposition highlights the reasons behind
measure, i.e. the real income change, we observe a similar these developments. The EV results in, for instance, the
pattern as that observed for GDP, namely that the scenarios Lib&Prod scenario show losses for the ‘new’ EU-13 MSs
have only small impacts on welfare. Compared with the vis-à-vis EV gains for the ‘old’ EU-15 MSs. For the EU-13
reference scenario in 2030, the Inc&Env scenario for the MSs this result is mainly driven by changes to the CAP
EU-28 results in a slightly negative EV of EUR 2.6 billion budget, whereas efficiency gains and improving terms
(–0.08%), the Lib&Prod scenario shows a EUR 18.4 billion of trade occur in the EU-15 MSs and lead to an overall
welfare gain (+0.15%) and, finally, the NoCAP scenario positive welfare effect in the Lib&Prod scenario..
shows a EUR 0.1 billion welfare gain (+0.01%).
30.000
25.000
Allocative
20.000
15.000 CAP Budget
10.000 Distributional
5.000 Endowment
0 Population
-5.000 Technological
-10.000
Terms of Trade
-15.000
Total
-20.000
Inc&Env Lib&Prod NoCap Inc&Env Lib&Prod NoCap Inc&Env Lib&Prod NoCap
EU28 EU15 EU13
FIGURE 8: WELFARE (EV) DECOMPOSITION IN THE EU-28, EU-15 AND EU-13, 2030, EUR MILLIONS, SCENARIOS VS. REFERENCE.
Source: Scenar 2030, MAGNET model.
Scenar 2030 - Pathways for the European agriculture and food sector beyond 2020 - Summary report 21The time dimension of scenario shocks matters for welfare
The dynamics of the scenarios’ impacts on welfare (and In the Lib&Prod scenario, and even more so in the NoCAP
other indicators) have to be closely observed, on the one scenario, EU-13 welfare growth shows a substantial de-
hand to anticipate temporary hardships and the necessary cline in 2025 after the policy change in 2020, but recovers
accompanying measures, on the other hand to monitor the in the period from 2025 to 2030 due to the market evolu-
recovering of an economy after a (structural) adjustment. tion and structural adjustment of the economy.
EU28 EU15 EU13
3
2
1
0
-1
-2
-3
-4
-5
-6
-7
-8
2025 2030
Lib&Prod NoCap Lib&Prod NoCap
Inc&Env Inc&Env
FIGURE 9: WELFARE GROWTH, CHANGES (%) FROM BASELINE FROM ONE PERIOD TO THE NEXT WITHIN A SCENARIO, IN EUR BILLION.
Source: Scenar 2030, MAGNET model.
22 Scenar 2030 - Pathways for the European agriculture and food sector beyond 2020 - Summary report3.2 | Social dimension
In this subsection, the income distribution among farms
and the impacts on jobs are analysed.
Small farms lose a higher proportion of their incomes than larger farms
With the exception of the smallest farms in the Inc&Env higher than for larger farms. It should be noted that the
scenario, all farm sizes lose income under all scenarios. income calculation on the farm level is slightly different
The smaller farms are generally more affected because from the gross farm income calculation.
the share of subsidies in their total income is usually
8 000 -< 25 000 25 000 -< 100 000 100 000 -< 500 000
2 000 -< 8 000 EUR EUR EUR EUR >= 500 000 EUR
5
0
-5
-10
-15
-20
Inc&Env Lib&Prod NoCAP
FIGURE 10: INCOME VARIATION BY ECONOMIC FARM SIZE IN THE EU-28 (% CHANGE RELATIVE TO REFERENCE).
Source: Scenar 2030, IFM-CAP model.
CAP subsidies play an income equalisation role among inequality, where a higher Gini coefficient indicates higher
farms in the EU. Decreasing or cutting payments increases inequality.
Gini coefficient
0.77
0.76 0.758
0.752
0.75
0.74
0.73
0.72
0.71 0.707
0.705
0.7
0.69
0.68
0.67
Reference Inc&Env Lib&Prod NoCAP
FIGURE 11: GINI COEFFICIENT FOR INCOME DISTRIBUTION IN THE EU-27.
Source: Scenar 2030, IFM-CAP.
Scenar 2030 - Pathways for the European agriculture and food sector beyond 2020 - Summary report 23Job numbers decrease
Under all three scenarios, in addition to the job decline of and NoCAP scenarios (–5%) than in the Inc&Env scenario
about 25% in the reference scenario, there is a negative (–1.8%). Decreases in employment in the food industry are
effect on jobs in the agricultural sector. The decrease less noticeable.
in agricultural jobs is more pronounced in the Lib&Prod
Inc&Env Lib&Prod NoCap
0%
-1%
-2%
-3%
-4%
-5%
-6%
EU28 EU15 EU13
FIGURE 12: IMPACT OF SCENARIOS ON EMPLOYMENT NUMBERS, 2030.
Source: Scenar 2030, MAGNET model.
%
+2
-14
FIGURE 13: IMPACT OF LIB&PROD SCENARIO ON EMPLOYMENT NUMBERS
(IN % CHANGE), 2030.
Source: Scenar 2030, MAGNET model.
24 Scenar 2030 - Pathways for the European agriculture and food sector beyond 2020 - Summary report3.3 | Environmental dimension
With regard to the environmental dimension, the results
are considered in the context of land use, nitrogen surplus
and GHG emissions.
More land is abandoned with diverse impacts
The slight increase in UAA in the Inc&Env scenario of 0.3% directly linked to the removal of direct payments, which
(+0.6 million ha) contrasts with the substantial decreases immediately affect the profitability of all crop production
of 7.3% (–13.1 million ha) in the Lib&Prod scenario and activities, and the decreases in EU production levels, es-
about 6.9% (–12.4 million ha) in the NoCAP scenario. The pecially the decline in cereal production and pasture, i.e.
decreases in UAA in the Lib&Prod and NoCAP scenarios are part of the land is taken out as economic returns decrease.
2%
Inc&Env Lib&Prod NoCap
0%
-2%
-4%
-6%
-8%
-10%
EU28 EU15 EU13
FIGURE 14: UAA, % CHANGE.
Source: Scenar 2030, CAPRI model.
Under the Inc&Env scenario, UAA increases by 0.3% (+0.6 the Lib&Prod scenario and by about 6.9% (–12.4 million
million ha) compared with the reference scenario, whereas ha) in the NoCAP scenario.
UAA substantially declines, by 7.3% (–13.1 million ha), in
Inc&Env Lib&Prod NoCAP
5,0%
0,0%
-5,0%
-10,0%
-15,0%
-20,0%
ry
ly
lta
a
-28
-15
ria
m
en
d
a
ece
ic
in
any
m
d
and
atia
nce
ia
ic
Rom l
ia
via
tria
3
ark
nds
rus
a
lan
ani
oni
lan
-N1
ubl
Ita
ubl
Spa
nga
uan
ven
gdo
tug
giu
d
lga
Ma
Lat
Cyp
nm
Gre
Aus
Fra
EU
EU
rm
e
Pol
rla
Cro
Est
Ire
Fin
Rep
Rep
Sw
Bel
Por
EU
Slo
Hu
Bu
Lith
Kin
Ge
the
De
ch
vak
ited
Ne
Cze
Slo
Un
FIGURE 15: CHANGE IN UAA PER MS (CHANGE RELATIVE TO REF).
Source: Scenar 2030, CAPRI model.
A similar decrease in grassland area (–8.8%) can be maintenance of (permanent) grassland. This is relevant
observed, driven by the removal of direct payments from a public goods point of view (e.g. landscape, tourism).
and by the absence of any CAP measure targeting the
Scenar 2030 - Pathways for the European agriculture and food sector beyond 2020 - Summary report 25Nitrogen - a particular challenge
High concentrations of nitrates in the soil and water the Inc&Env scenario, by 1%. The increase of 3% in the
constitute a widespread problem caused by nitrogen Lib&Prod scenario illustrates the challenge of sustainable
surplus. Nitrogen surplus per ha decreases under only intensification.
4%
3%
2%
1%
0%
-1%
Inc&Env Lib&Prod NoCap
-2,%
EU28 EU15 EU13
FIGURE 16: NITROGEN SURPLUS PER HA.
Source: Scenar 2030, CAPRI model.
The limitation in animal stocking density and the restriction UAA, respectively. The increase in N-surplus is, on the one
on nitrogen use lead to a decrease in the N-surplus of hand, driven by the decrease in UAA and, on the other
0.8 kg N/ha UAA. A considerable reduction is reported hand, the intensification of livestock and crop production
in particular in Member States and regions with a high on the remaining UAA. In both scenarios, more substantial
N-surplus in the reference scenario, such as Belgium and increases in N-surplus are indicated for regions that already
the Netherlands, mostly related to reductions in stocking have the highest N-surplus in the reference scenario, as
densities. In contrast, under the Lib&Prod and NoCAP these are among the most competitive regions.
scenarios, the N-surplus increases by 2 and 0.5 kg N/ha
Inc&Env Lib&Prod NoCAP
7
6
5
4
3
2
1
0
-1
-2
-3
-4
-5
-6
-7
-28
-15
3
tria
m
ia
atia
ly
via
rus
ic
ark
a
d
nce
any
ece
ry
and
ia
nds
and
al
a
ic
ia
in
en
m
lan
oni
ani
-N1
ubl
ubl
Ita
Spa
gar
uan
ven
tug
nga
giu
gdo
d
Lat
Cyp
nm
Aus
Gre
Fra
rla
EU
EU
rm
e
Irel
Pol
Cro
Est
Rom
Fin
Rep
Rep
Sw
Bel
Bul
Por
EU
Slo
Lith
Hu
Kin
the
De
Ge
ch
vak
Ne
ited
Cze
Slo
Un
FIGURE 17: CHANGE IN N-SURPLUS PER MS (ABSOLUTE CHANGE IN KG N/HA UAA RELATIVE TO REF).
Note: Malta has been removed from the graph to improve the readability. The values for Malta are: Inc&Env -14%, Lib&Prod +17%, NoCAP +12%”.
Source: Scenar2030, CAPRI.
Looking at the regional distribution of the N-surplus the
increase is concentrated in productive areas that already
have high N-surplus in the reference scenario.
26 Scenar 2030 - Pathways for the European agriculture and food sector beyond 2020 - Summary reportGHG emissions – a question of leakage?
The GHG emissions of EU agriculture follow directly the
production developments. Therefore, changes are rather
limited in the Inc&Env scenario, with a decrease of 0.5% in
EU-28 emissions; however, considerably larger decreases
are indicated under the Lib&Prod scenario (–4.2%) and
NoCAP scenario (–5.8%). The impact of technological
GHG mitigation options is very limited in the scenarios
(i.e. the technologies are not widely applied), which is why
the predicted GHG changes mirror production changes so
closely. Moreover, the GHG emission analysis does not
take into account that the land taken out of EU production
could be used for afforestation and therefore as a carbon
sink. At the MS level, the changes in agricultural non CO2
GHG emissions also reflect the corresponding production
changes in the scenarios.
FIGURE 18: NITROGEN SURPLUS PER HA, % CHANGES IN THE LIB&PROD
SCENARIO.
Source: Scenar 2030, CAPRI model.
Inc&Env Lib&Prod NoCap
0,0%
-1,0%
-2,0%
-3,0%
-4,0%
-5,0%
-6,0%
-7,0%
EU28 EU15 EU13
FIGURE 19: CHANGE IN AGRICULTURAL NON-CO2 GHG EMISSIONS (%).
Source: Scenar 2030, CAPRI model.
REF Inc&Env Lib&Prod NoCAP
80
Mio tonnes CO2 eq
70
60
50
40
30
20
10
0
S in
De lic
Fin a
Ire y
ly
Gr y
Bu m
Po d
nd
tia
Ge ce
Sl lic
m
ia
Sl Rom al
ia
Lit ia
ria
er a
Re ia
Ki en
ia
nd
Hu ce
Es k
s
Re s
ar
an
ni
n
nd
u
ar
t
Ita
a
an
en
tv
g
n
ar
iu
do
b
l
b
an
ee
la
la
ec ypr
d
oa
la
st
Ne Ma
Sp
to
a
ng
rtu
nm
pu
pu
rm
la
lg
La
ite we
lg
Po
ov
hu
ng
Au
Fr
Cr
Be
C
th
h
ak
d
ov
Cz
Un
FIGURE 20: AGRICULTURAL NON-CO2 GHG EMISSIONS IN THE EU MSs (IN MIO TONNES CO2 EQ).
Source: Scenar 2030, CAPRI model.
Scenar 2030 - Pathways for the European agriculture and food sector beyond 2020 - Summary report 27From a worldwide perspective, the emission reductions the increase of agricultural GHG emissions in Mercosur
in the EU are widely compensated by emission increases or Australia & New Zealand. As a result of emission
in non-EU countries, mainly due to increased production leakage, the net benefit of EU emission reductions on
and exports of agricultural commodities to the EU. This global agricultural GHG emissions is minimal.
emission leakage effect is for example illustrated by
3,5
3,0
2,5
2,0
1,5
1,0
0,5
0,0
NAFTA Mercosur Australia & New Zealand Asian FTA
-0,5
Inc&Env Lib&Prod NoCap
FIGURE 21: GHG EMISSIONS IN AGRICULTURE, DIFFERENT REGIONS, 2030, DIFFERENCE (%) FROM REFERENCE.
Note: Asian FTA means bilateral trade agreements between the EU and Japan, Vietnam, Thailand, Philippines and Indonesia respectively.
Source: Scenar 2030, MAGNET model.
The main caveat in relation to the scenarios’ consideration importance of GHG emission leakage through increased
of GHG emissions is that only a rough estimation of GHG EU imports.
emissions is possible. However, the main message is the
28 Scenar 2030 - Pathways for the European agriculture and food sector beyond 2020 - Summary reportSCENAR 2030 AND THE
4 LONG ROAD AHEAD:
ACHIEVEMENTS AND
REMAINING CHALLENGES4 Scenar 2030 and the long road ahead:
achievements and remaining challenges
The present study offers a well-established, model- During the course of this study, experiences have revealed
based agro-economic analysis enriched with new repeatedly that the linkage of models is a challenge.
features, providing a framework for future policy analysis. Furthermore, the assumptions on the impact of policies on
In particular, an attempt has been made to deliver a productivity are of particular importance, pointing to the
fully transparent study report, linked to an interactive need for more research.
visualisation of the results.
At the time of finalising this report, many uncertainties
The scenarios chosen are instructive and show the about the future of the agricultural sector remain. They
existence of trade-offs. include the early stage of discussions on the Multiannual
Financial Framework (MFF) 2021-2027, the Brexit, the
In particular, the combination of different types of models ongoing free trade negotiations, the implementation of
allows the analysis of the scenarios from all three COP21 and SDGs, the Renewable Energy Directive, and the
sustainability perspectives and on different spatial scales, evolving bioeconomy among others.
i.e. from the global market to the individual farm level.
Scenar 2030 - Pathways for the European agriculture and food sector beyond 2020 - Summary report 31LIST OF FIGURES AND TABLES
List of figures
Figure 1:               Model chain..............................................................................................................................................................................................................       15
Figure 2:               Overview of the scenarios.............................................................................................................................................................................                          17
Figure 3:               Agricultural production, EU-28, changes compared with reference (%)......................................................................                                                                                       19
Figure 4:               Producer price, EU-28, changes compared with reference (%)..........................................................................................                                                                            19
Figure 5:               EU imports, exports and trade balance changes (EUR million) compared with reference, 2030..............                                                                                                                         20
Figure 6:               Gross farm Income (% change relative to reference)................................................................................................................                                                              20
Figure 7:               GDP, change from base line (%), 2030................................................................................................................................................                                            21
Figure 8:               Welfare (EV) decomposition in the EU-28, EU-15 and EU-13, 2030, EUR millions, scenarios vs.
                        reference....................................................................................................................................................................................................................   21
Figure 9:               Welfare growth, changes (%) from baseline from one period to the next within a scenario, in EUR
                        billion, for all scenarios in years 2025 and 2030.........................................................................................................................                                                      22
Figure 10: Income variation by economic farm size in the EU-28 (% change relative to reference)..............................                                                                                                                           23
Figure 11: Gini coefficient for income distribution in the EU-27.................................................................................................................                                                                       23
Figure 12: Impact of scenarios on employment numbers, 2030...............................................................................................................                                                                               24
Figure 13: Impact of Lib&Prod scenario on employment numbers (in % change), 2030........................................................                                                                                                                24
Figure 14: Utilised agricultural area (UAA), % change.......................................................................................................................................                                                            25
Figure 15: Change in UAA per MS (change relative to REF)...........................................................................................................................                                                                     25
Figure 16: Nitrogen surplus per ha...................................................................................................................................................................................                                   26
Figure 17: Change in N-surplus per MS (absolute change in kg N/ha UAA relative to REF)...................................................                                                                                                               26
Figure 18: Nitrates per ha, % changes in the Lib&Prod scenario...............................................................................................................                                                                           27
Figure 19: Global warming potential of agriculture, change in %.............................................................................................................                                                                            27
Figure 20: Agricultural non-CO2 GHG emissions in the EU MSs (in Mio tonnes CO2 eq)............................................................                                                                                                          27
Figure 21: GHG emissions in agriculture, different regions, 2030, difference (%) from reference.....................................                                                                                                                    28

List of tables
Table 1: Income variation by farm specialisation in the EU-27 (% change relative to reference).......................................                                                                                                                   20

                                           Scenar 2030 - Pathways for the European agriculture and food sector beyond 2020 - Summary report                                                                                                             33
Europe Direct is a service to help you find answers
to your questions about the European Union.
Freephone number (*):
00 800 6 7 8 9 10 11
(*) The information given is free, as are most calls (though some operators, phone boxes or hotels may charge you).
More information on the European Union is available on the internet (http://europa.eu).
HOW TO OBTAIN EU PUBLICATIONS
Free publications:
• one copy:
via EU Bookshop (http://bookshop.europa.eu);
• more than one copy or posters/maps:
from the European Union’s representations (http://ec.europa.eu/represent_en.htm);
from the delegations in non-EU countries (http://eeas.europa.eu/delegations/index_en.htm);
by contacting the Europe Direct service (http://europa.eu/europedirect/index_en.htm) or
calling 00 800 6 7 8 9 10 11 (freephone number from anywhere in the EU) (*).
(*) The information given is free, as are most calls (though some operators, phone boxes or hotels may charge you).
Priced publications:
• via EU Bookshop (http://bookshop.europa.eu).KJ-NA-28883-EN-N
JRC Mission
As the science and knowledge
service of the European Commission,
the Joint Research Centre’s mission
is to support EU policies with
independent evidence throughout
the whole policy cycle.
EU Science Hub
ec.europa.eu/jrc
@EU_ScienceHub
EU Science Hub - Joint Research Centre
Joint Research Centre
EU Science Hub
doi:10.2760/749027
ISBN 978-92-79-76678-7You can also read