Successfully and profitably transitioning to strip till or no-till maize production systems
←
→
Page content transcription
If your browser does not render page correctly, please read the page content below
Successfully and profitably transitioning to strip
    till or no-till maize production systems
           Why, how, and what to expect

                       Courtesy of
       Tuesday 8 December, Paul Hunter, Te Awamutu
     Wednesday 9 December, David Rawnsley, Kerepehi
      Thursday 10 December, Isaac Higham, South Head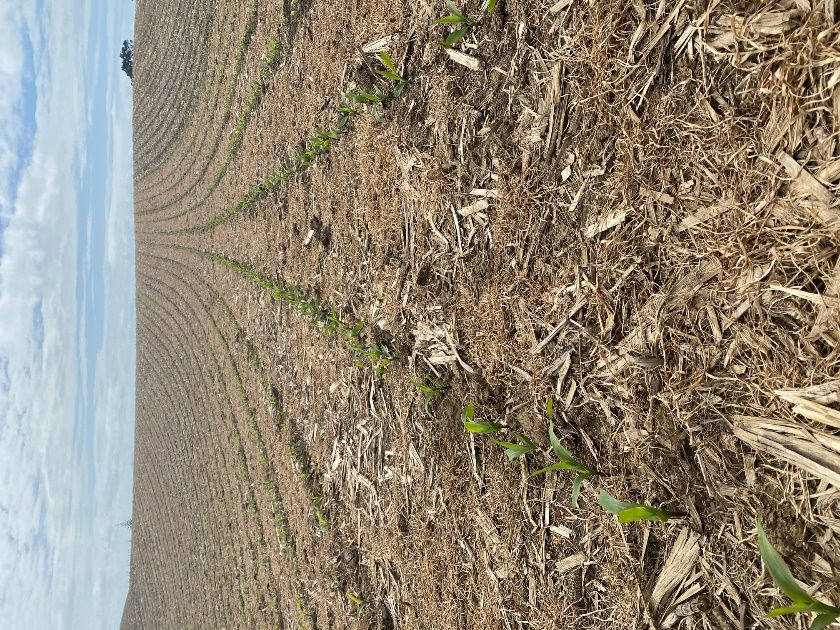
© Foundation for Arable Research (FAR), Seed Industry Research Centre (SIRC)

DISCLAIMER

This publication is copyright to the Foundation for Arable Research and may not be reproduced or copied in any
form whatsoever without written permission. It is intended to provide accurate and adequate information
relating to the subject matters contained in it. It has been prepared and made available to all persons and entities
strictly on the basis that FAR, its researchers and authors are fully excluded from any liability for damages arising
out of any reliance in part or in full upon any of the information for any purpose. No endorsement of named
products is intended nor is any criticism of other alternative, but unnamed product.
Paul Hunter Farm
Farm facts

Location:                  Andrew and Arapuni Road, Te Awamutu (Figure 1)
Soil type:                 Mairoa Ash – well drained soils
Maize prod. area:          180ha maize silage followed by annual ryegrass
First maize crop:          Late 1960s (grain)
Cropping system:           Late 1960s early 1970s – 2017 plough and power harrow
                           2018 - current strip till (one paddock strip tilled for the last seven years)

Why the transition?
Long term continuous cultivation caused soil erosion during heavy rain events and had depleted soil
structure. The journey to strip till was initiated as part of ‘there must be a better way’ review of the
maize production system. Strip till makes a lot of sense for many economic and environmental
reasons, and helps restore soil ‘wildlife’ lost through full cultivation practices.

How is the transition being made?
Pre strip till:         Uses a hooded sprayer to apply glyphosate in the strip till rows 2 to 3 weeks
                        prior to strip tilling
Fertiliser programme: Commenced grid soil sampling in 2020, and applied variable rate lime
                        accordingly (Figure 4)
                        Broadcast a percentage of base fertiliser, with the remainder of the base
                        applied in the strip till zone using the strip till unit
                        Starter fertiliser
                        Nitrogen side dressing

Planting focus:            Precision Planting equipment is utilised to achieve uniform seeding depth
                           and within row spacing (Figure 5)
                           Precision Planting Smart Firmer to provide real time soil condition feedback
                           at planting (i.e. moisture, temperature etc), and eventually to provide real
                           time soil organic matter
                           Row control
                           Variable rate seeding to be introduced in 2021

Pesticide plan:            Apply slug bait in a band at planting
                           Pre and post-emergent herbicides as required

Yield/yield variability:   Maize silage yields range from 18tDM/ha to 30tDM/ha, with average yields
                           for the last three years being:
                           2020 22.5tDM/ha
                           2019 27.5tDM/ha (Figure 2)
                           2018 25.0tDM/ha

Future focus:              Improve lime application uniformity
                           Strive to regain lost soil organic matter by maximising ‘living root days’,
                           Planting green, and explore in-row winter crop alternatives
                           Refine strip till programme to eliminate second pass
                           Variable rate seeding and fertiliser inputs
                           Identify and manage micronutrient needs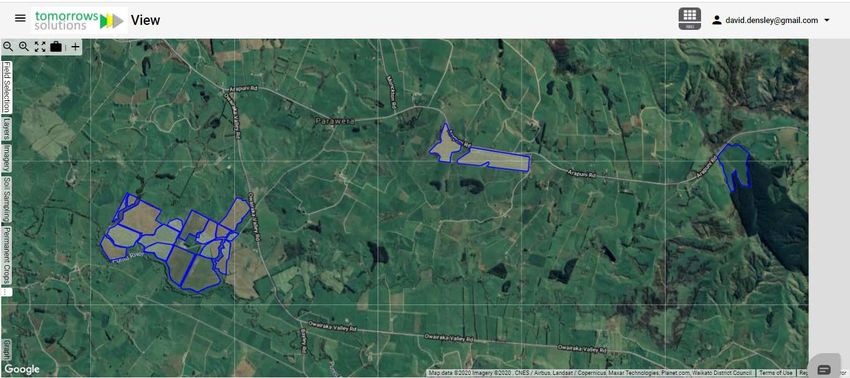
Figure 1: Location of Paul Hunter’s maize paddocks on Andrew and Arapuni Rd.
Paddock with 7
years of strip
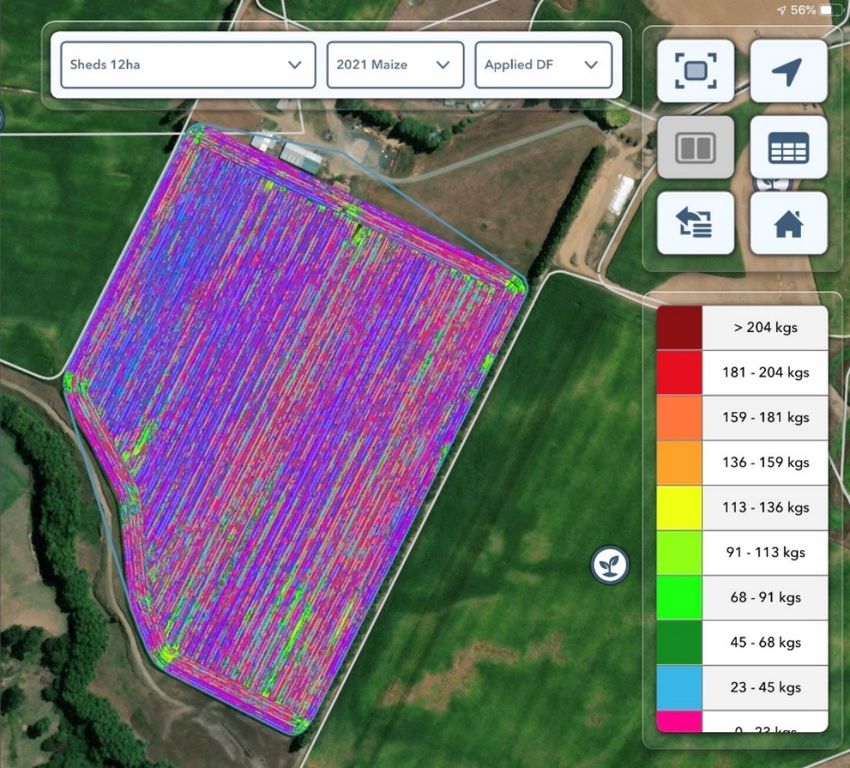
Figure 2: Maize silage yield map 2019. Higher yields shown in blue colours and lower yields in yellow
and red, with maize silage yield ranging from 18 to 30tDM/ha, with an average yield of 27.5tDM/ha.
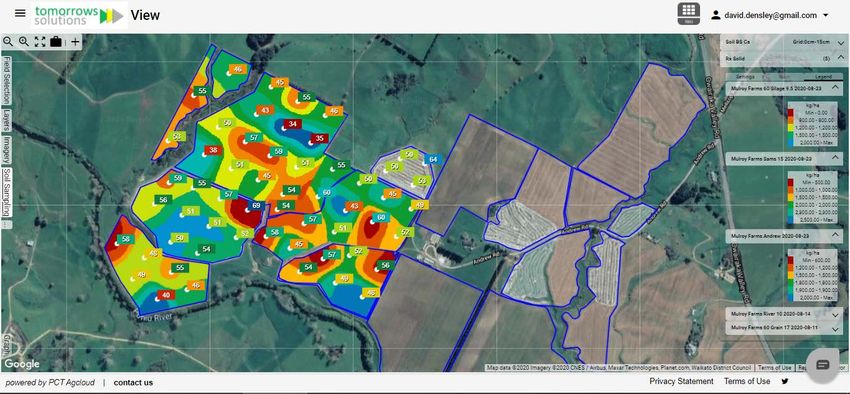
Figure 3: Geospatial soil organic matter. Highest organic matter in blue and green (9 to 12% range),
and lowest in orange, yellow and red (6 to 9% range).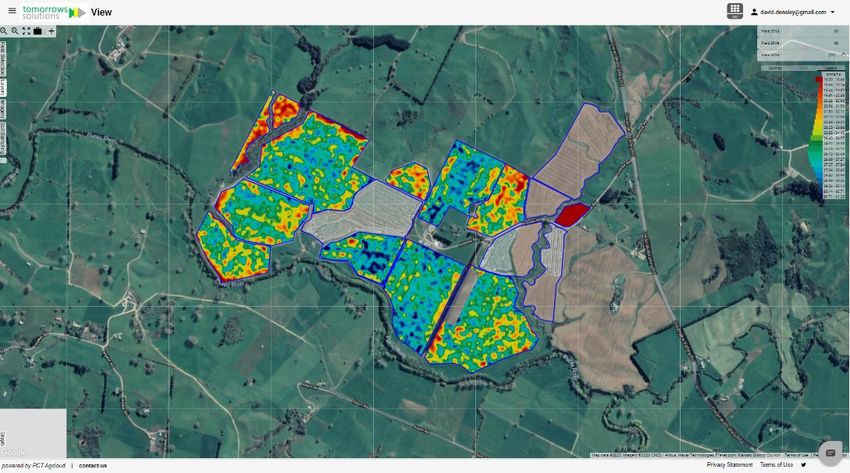
Figure 4: Variable rate lime prescription application map with Calcium Base Saturation percentage
(CaBS%) values shown within the map. CaBS% is used to determine liming rates with a target of
65%CaBS. Lime rates in red zones are 0 to 500kg/ha, orange = 500 -1,200kg, lime green = 1,200 –
1,500kg, dark green = 1,500 -1,900kg, and blue = 1,900kg and above.

Figure 5: Precision Planting planter applied downforce map from a field
assessed for soil compaction (Figure 6), showing active row unit downforce
changes to achieve uniform planting depth
What can you expect?

       Assessing compaction issues across strip till/planter soil compaction using a penetrometer
       Strip till equipment with fertiliser hoppers and centre fill planters carry a heavier load on the centre
       tyres of the planter. International research has shown that, in some circumstances, maize yield in
       the rows adjoining tractor and equipment tyre lines can be reduced. To determine if soil compaction
       is occurring on Paul Hunter’s strip till system, FAR undertook a soil density assessment across the 8-
       row strip till width (both within and between the maize rows). A FieldScout SC900 Soil Compaction
       Meter assessed soil compaction to 45cm, at 2.5cm increments. Four strip till passes at different
       locations were assessed on two different soil types. For averages and maximum values see Figure 6.

       According to international research, maize root development and yield potential can be
       compromised when soil density is greater than 2,500kPa. The average soil density (measured to a
       depth of 45cm) was below the acceptable maximum soil density in every row, but there were
       individual readings that were close to the maximum acceptable soil density level (red lines). Figure 6
       highlights two observations: a) in general, soil density is slightly higher in the between-rows where
       equipment tyres have travelled, i.e. between maize rows 2.5, 3.5, 5.5 and 6.5, and b) the strip unit
       has a lower soil density in the planter rows as a result of the strip till coulters.

Figure 6: Soil density across the 8-row strip till width in a maize crop established in the Waikato in 2020. A
FieldScout SC900 Soil Compaction Meter was used to assess soil density, as measured by soil penetration
resistance (kPa), to a depth of 45cm, at 2.5cm increments. Four sites across the 8-rows were assessed on two
different soil types with the averages (bars) and maximum values (red lines) provided for both the maize rows
and between the maize rows. The soil type in the top penetrometer assessment graph contains more clay than
the soil type in the bottom graph (as defined by an electromagnetic map).
Figure 7 is a summary of the average soil density across the 8-row strip till unit, including the rows between
the planter rows, through the soil profile on the two different soil types. In total 4 different sites where
assessed for each soil type, and 15 penetrometer measurements made per site (8 planter rows + 7 between
rows as indicated in Figure 6).

As shown, on average the soil density in the higher clay content soil is slightly higher at the 10 to 17cm depths,
but lower from 22.5 to 32.5cm soil depth.

                                 SO I L PE N E T RAT I O N RESI STA N C E (K PA )

                             0         500         1000        1500           2000          2500
                       0.0

                       2.5                                            Higher clay content

                       5.0
                                                                      Lower clay content
                       7.5

                      10.0

                      12.5

                      15.0

                      17.5
         DEPTH (CM)

                      20.0

                      22.5

                      25.0

                      27.5

                      30.0

                      32.5

                      35.0

                      37.5

                      40.0

                      42.5

                      45.0

Figure 7: Average penetrometer readings on two soil types across the 8-row strip till width (15 sample points x
4 sites) from the two soil types as summarised in Figure 6.

Further assessment of the Paul Hunter soil compaction analysis will be undertaken to determine differences
between in-row (i.e., planter rows) and between-row soil density, along with soil density and compaction
assessments across various soil textures and equipment types in other maize growing regions. FAR will also
undertake an evaluation of soil density and compaction occurrences on some maize research locations.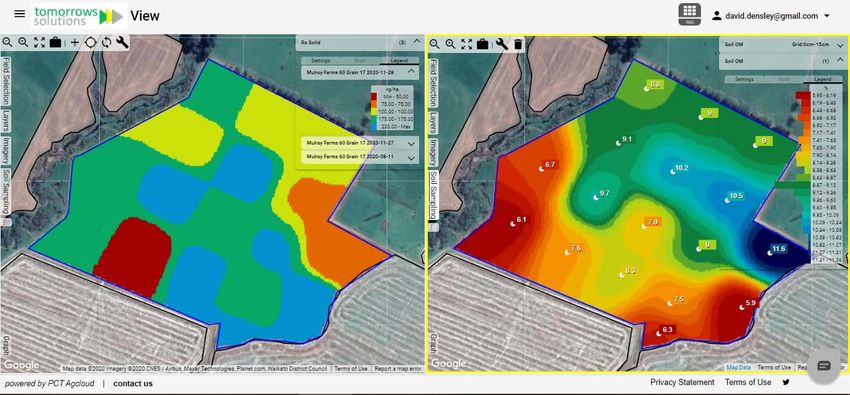
How does cultivation effect soil?
       As outlined in the Soil quality – what you see is what you get section of this handout, cultivation
       reduces soil organic matter, alters soil biology, and negatively changes the soil physical
       characteristics. A study conducted by Ballance Agri-Nutrients on Paul Hunter’s cropping soils affirms
       those findings (see Figure 8), with the soil organic matter in the cultivated fields half the level of the
       ‘undisturbed’ soil. In this study Ballance collected and analysed a number of soil samples across
       several paddocks within Paul’s maize operation.

       Paul’s ultimate objective is to restore soil organic matter in his long-term cropping land to close to
       pre-cropping levels. The challenge is daunting, but achieving this goal will ultimately improve
       profitability, provide increased yield stability and resilience during extreme weather events, and help
       meet near and long term environmental standard requirements.

Figure 8: Soil physical and chemical comparison between original state and 35 years of cultivation – courtesy
of Murray Lane, Ballance Agri-Nutrients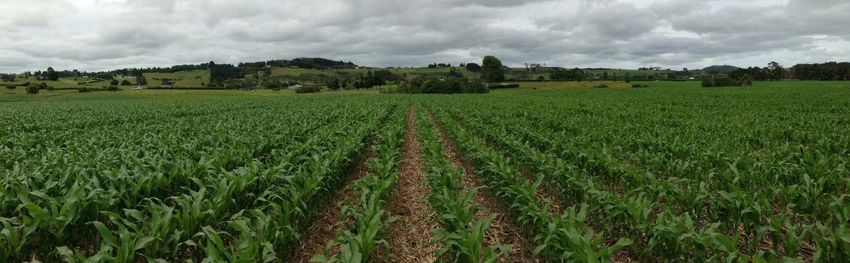
David Rawnsley Farm
Farm Facts

Farmer:                     David is a 4th generation dairy farmer on the dairy farm, and this is his
                            seventh milk production season
Location:                   Hauraki Plains
Soil type:                  Clay over loam, poorly drained soils
Milking herd:               320 cows on 60ha effective
Leased runoff:              Leased the runoff 5 years ago
Maize prod. area:           4.8ha in maize, which is grown for maize silage
Background detail:          First ‘home-grown’ maize crop in 6 years. Initially moved away from maize
                            silage because of the pasture burn patches after feeding out, but
                            consecutive dry summers has necessitated buying-in maize. Had been using
                            chicory as the summer feed, but chicory has struggled on the runoff because
                            of the heavy clay soils

Why the transition?
Ongoing discussions with Elizabeth (Leonard) regarding the dairy farm system and opportunities to
improve profitability and meet evolving environmental standards. Elizabeth mentioned no-till maize
production, and David was keen as he likes trying ‘things’ and learning – having the no-till and strip
till trial on his farm provides a first-hand look at something new. And it’s an opportunity to
demonstrate to the community that through practices like no-till and strip till famers are committed
to doing their bit to look after the environment.

How is the transition being made?
An on-farm trial was established to compare no till and strip till establishment to full cultivation as
per the layout in Figures 9, 10 and 11. It is hoped that this study will run over two years, with the
aim of defining best practice on these heavy clay soils, and to monitor and measure soil changes and
other key criteria.

                                                                                                  We are here
Figure 9: No-till (E, G, J), no-till subsoiled (A, C, K), strip till (B, F, I), and cultivation (D, H, L) trial layout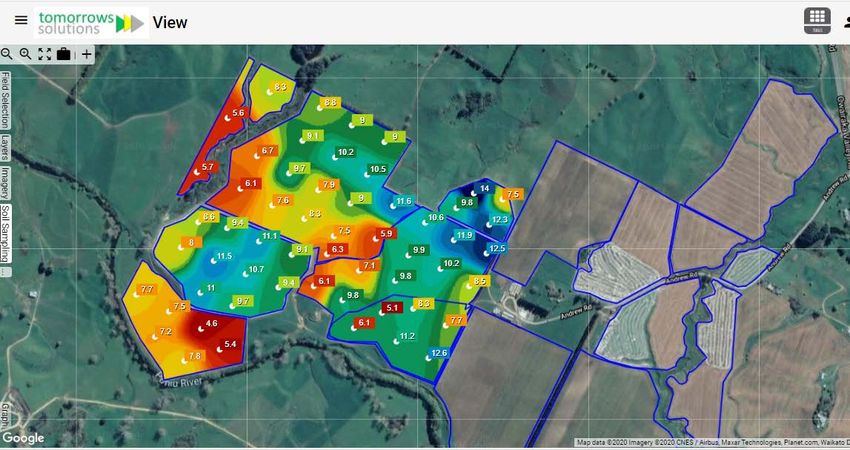
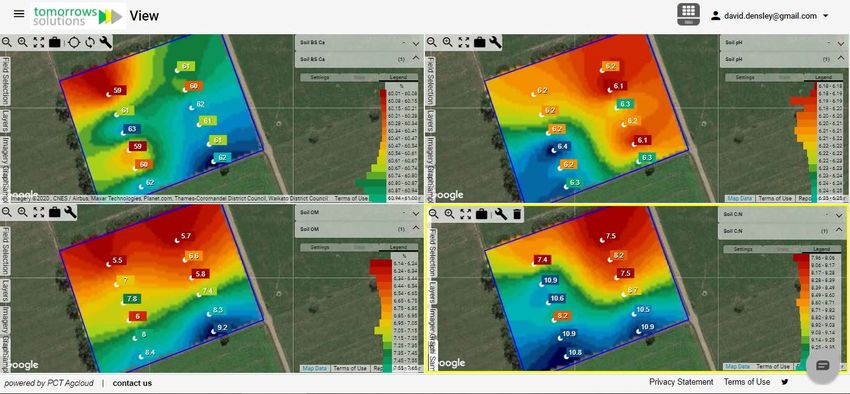
Figure 10: Geospatial maps of the trial paddock showing variability in Calcium Base Saturation percentage
(CaBS%) (top left), soil pH (top right), soil organic matter (bottom left), and soil C:N ratio (bottom right)

        Figure 11: Applied downforce map from Precision Planting equipment across the various treatments.
        Different soil density can be seen (L), and emerging maize rows on one of the no-till treatments(R).
        What can you expect?
        A global perspective - strip till and visual soil assessment, Turkey

        Figure 12: Strip-till following triticale silage on a 5,000-cow dairy operation in Western Turkey (L), and
        following no-till wheat on a 6,500ha cropping operation in eastern Turkey (R). Dry fertiliser applied
        through the fertiliser hoppers, and zinc and humic acid applied as a liquid injected into the strip.
Figure 13: Montage comparing cultivation with no cultivation (outside of the cultivated paddock) from various soils across Turkey and in the Waikato (bottom left and right) – spot the difference? Soil density and compaction assessment across treatments Soil density was measured across all treatments and replications to a depth of 45cm at 2.5cm increments using a FieldScout SC900 Soil Compaction Meter. According to international research, maize yield can be compromised when soil compaction is greater than 2,500kPa. Soil density levels were assessed on eight rows per treatment within the maize row and graphed as shown in Figure 14. While soil density was higher in the no-till only treatment in the top 27cm, soil density was still well below what is considered yield limiting soil compaction. All treatments had very similar soil density below 27.5cm.
SOIL PENETRATION RESISTANCE (KPA)
                      0   500          1000          1500           2000           2500
                0.0

                2.5
                                                               subsoil + no-till
                5.0                                            strip till
                7.5                                            cultivated
               10.0                                            no-till
               12.5

               15.0

               17.5
  DEPTH (CM)

               20.0

               22.5

               25.0

               27.5

               30.0

               32.5

               35.0

               37.5

               40.0

               42.5

               45.0

Figure 14: Average soil density to a depth of 45cm across all replications for the
four different establishment treatments. The maize was at the V2 growth stage
when this assessment was undertaken.

Thanks to sponsors Ballance Agri-Nutrients, Hill Laboratories and Avoca; and to Precision Planting,
Farm Source, Pioneer, BlueGrass Contracting and Troughton Contracting for their support.
Higham Farms
Farm Facts
Farming system: Beef, dairy farming, Christmas trees, and maize on 1,295ha
Soil type: Puhoi Clay Loam
Maize prod. area: 120ha for grain production
First maize crop: 2002
Cropping system: Started exploring no-till in 2016, with 100ha planted into no-till this season
Non no-till fields: Deep rip + rotary hoe
Why the transition? Soils and soil health is paramount, and without the soil farmers have no
income
Nurturing and looking after the soil has to be our top priority
Reducing soil erosion, especially on the farm’s hilly terrain
Increasing soil water holding capacity and retention, which improves yield
stability during seasons with below average rainfall
Lower fuel consumption
Wanting to improve the soil biology and structure
How is the transition being made?
Fertiliser programme: Base fertiliser applied according to soil tests, starter fertiliser, and nitrogen
sidedressing application via helicopter
Planting focus: Fit-for-purpose planter to ensure uniform seeding depth and
within row spacing in a no-till system. Active hydraulic downforce to ensure
uniform planting depth with row control
Pesticide plan: Pre-emergent and post emergent herbicides
Future focus: Upgrade fertiliser system on the planter to ensure better and more uniform
fertiliser placement
Exploring planting green - tried a small area this spring
Yield mapping, although this will depend on the contractor
Variable rate seedingFigure 15: Cover crop trial showing the trial layout (top left), planting into the trial (top right),
emergence (bottom left) and established no-till maize (bottom right)
What can you expect?
Key considerations when transitioning to no-till or strip till include:
i. Check for soil compaction before transitioning to no-till, and if compaction is present
remove this with a non-inversion subsoiler
ii. Ensure the maize planter is fit for purpose to achieve uniform planting depth across soil
density variability and within row seed spacing, and that the seed slot is closed (especially
important and somewhat challenging with high clay content soils)
iii. No-till soils in particular are slightly cooler and wetter than cultivated soils, therefore an
appropriate starter fertiliser is essential
iv. RTK is required with strip till
v. Be prepared to be diligent with managing slugs
vi. Stay the course; it can take two to three years or more to refine this new system. Seek help
if needed.Working towards a maize nitrogen best practice approach Compared to many countries around the world, many pastures and short to medium term cropping soils in New Zealand contain relatively high levels of soil organic matter (OM). This comparatively large OM pool provides the platform for a biologically rich soil with the ability to store reasonable quantities of soil water, especially for deep-rooted plants like maize. In addition, these high OM soils also contain a significant amount of organic nutrients, which, when mineralised by the soil biology, are available to the maize plant. In fact, when planting maize into a paddock out of permanent pasture the amount of nitrogen being mineralised often means no additional N fertiliser is required for two or more years. With regards to a fertiliser and nitrogen plan, consider and apply the 4R fertiliser principle: i. Right source (product) ii. Right rate iii. Right time iv. Right place So, what does nitrogen good practice look like for maize production? Preplant: Depending on the preceding crop (in this context permanent pasture is considered a crop), a small amount of nitrogen may be required in the base fertiliser to prevent nitrogen tie-up by soil microbes, which is influenced by the carbon to nitrogen ratio of the preceding crop. At planting: Typically, an N based starter fertiliser is applied with the maize planter. The type and rate of starter fertiliser used should be influenced by soil fertility as defined by the soil test. Side dressing: If you are using a side dresser or fertiliser spreader, and if additional nitrogen is required, make your final application as late in the maize growth stage as practically possible. DeepN testing prior to side dressing is highly recommended to identify available soil N before side dressing. As shown in Figure 16, only a small quantity of nitrogen is required in the early growth stages, and it is not until around the V9 growth stage that daily uptake increases significantly. By flowering, the maize plant has been taken up approximately 65% of its total N requirement. Figure 16: Nitrogen, phosphorus and potassium uptake in a maize plant by growth stage - adapted from Corn Growth & Development, Nielsen 2000.
When developing a maize nitrogen best practice approach, consideration should be given to the
amount of plant available nitrogen being mineralised from the soil organic matter pool. Measuring
the amount of plant available nitrogen is best done by taking a soil sample to a depth of 60cm prior
to any nitrogen being applied as a sidedressing. Once these soil samples are collected, those samples
can either be sent to a lab for analysis (Mineral N test) or used for a Nitrate Quick Test to determine
the amount of soil available nitrogen. Once this value is known, the AmaizeN or the Nitrate Quick N
modelling tool can be used to determine actual nitrogen application rates (Figure 17).

Figure 17: Once a deepN sample has been collected, AmaizeN (left) or the Nitrate Quick Test (right)
modelling tool can be used to determine nitrogen rates

Because soil organic matter varies throughout the field, the amount of plant available nitrogen
mineralised from organic matter also varies throughout the field. A very recent study conducted by
FAR involved collecting soils at Paul Hunter’s farm outside of Te Awamutu on a long-term maize
paddock using a 1ha grid sampling pattern to a depth of 60cm for the purpose of determining spatial
plant available nitrogen. These 17 samples were collected at the V3 maize growth stage between the
maize rows. No nitrogen fertiliser had been broadcast on the field prior to planting the maize.

The DeepN analysis showed a wide range of ammonium plus nitrate N, from 20mg/kg to 52mg/kg in
the 0 to 15cm soil sample, and 4mg/kg to 21mg/kg in the 15 to 60cm soil sample (Figure 18).
Figure 18: Mineral N (ammonium and nitrate) analysis values from grid sampling
across a 17ha field showing the range in Mineral N in 0-15cm and 15-60cm samples
at Paul Hunters long term maize paddock

From this analysis, a variable rate nitrogen prescription map as shown in Figure 19 was produced to
visualise the variation in nitrogen rates that would be applied across the 17ha field if variable rate
was applied. Recommended nitrogen application rates ranged from 50kg/ha nitrogen (as shown in
the red zones in Figure 19) to 220kg/ha (blue zones). For this scenario modelling, it was assumed
that no nitrogen had been applied prior to sidedressing.

Using this information, a cost comparison between a mass balance approach (that is, N requirement
= maize silage yield estimation x kgN/tDM) and a nitrogen variable rate application approach can be
made as shown in Table 1.

Table 1: Comparison between a mass balance approach to N application comparted to variable rate
N application

                                                                     Mass Balance           Variable rate N 1
    Estimated maize silage yield as determine by AmaizeN 2                          24.9tDM
    Maize silage N requirement                                                     12kg/tDM
    Total N requirement                                                300kgN/ha               152kgN/ha
    Cost of N/ha based on N requirement                                  $198.30                $101.00

1
    See Figure 19
2
    AmaizeN calculator, Te Awamutu region, full moisture profile, 101 to 110CRM hybrid, planted 5th October
Figure 19: Variable rate nitrogen application map based on deepN analysis undertaken in early November (left), and soil organic matter as measured in August. Red zone = 50kgN/ha, orange =75kgN/ha, lime green = 100kgNha, dark green = 175kg/ha, blue = 220kg/ha What does this research show, and where to from here? Understanding soil organic matter variability and the amount of plant available nitrogen spatially mineralised from that organic matter, and then utilising variable rate application, has the potential to reduce nitrogen inputs, lower production costs, decrease the amount of nitrogen entering into the waterways, and lessen nitrous oxide emissions. However, currently to determine the level of variability is relatively resource intensive, and the cost associated with analysing the samples an important consideration. Moving forward, it is clear that more research is required to understand plant available nitrogen variability across different soils types and maize production systems, and to explore the possibility to use technology to measure real time soil organic matter and then to reliably apply predictions on the amount of organic matter that is being mineralised. Given that mineralisation is a biological process driven by many factors, this may be challenging. However, as outlined in the section titled Zero Carbon Amendment Bill further in this handout, FAR is committed to assisting maize growers and other arable industries to maximise nitrogen use efficiency for the reasons mentioned above, so watch this space for further developments.
Soil quality – what you see is what you get
Dirk Wallace and Sam McDougall, FAR

Key points
   • Maintaining soil physical quality allows you to bank soil water
   • Establishment practices that maintain soil structure enhance the soils ability to transfer
       water to the rootzone and hold it there
   • Soil physical quality can be improved by minimising loss of structure through cultivation and
       maximising returns of organic matter.

Soil physical quality – What is it?
In the context of an arable farm, a soil with good physical quality will resist erosion (wind and water)
and will take full advantage of incoming water by quickly getting it from the surface to where the
roots can use it and providing spaces for excess water to be held for crop growth throughout the
season. A good quality soil will contain a range of aggregate sizes, have visible soil pores and appear
to have a nutty structure.

Assessing soil physical quality
Numerous visual soil assessments have been developed in order to monitor soil quality on farm.
Abie Horrocks from the Foundation for Arable Research has targeted the most relevant indicators
for cropping farm soils in the mini visual soil assessment (mini VSA). It involves carrying out three
quick tests to assess structure & porosity, turbidity and earthworms. Recording observations is also
encouraged – how does it feel when you dig? What does it look like? When it comes to soil quality,
often what you see is what you get.

Improving soil physical quality
To improve soil physical quality, you’ll need a consistent and targeted approach combined with a
monitoring plan to assess progress. Soil aggregates are slow to build but quick to destroy, so tillage
practices that are less intensive tend to maintain soil aggregates and pore spaces. Monitoring soil
water at FAR’s Northern Cropping Research Site (NCRS) has shown a trend towards differences in
soil water content between no till and inversion establishment (Figure 20).

Figure 20: Daily average soil moisture content measured at 20 cm depth in the direct drill (DD) and
full cultivation (FC) treatments. P values are calculated for the average soil moisture values during
each period (i.e. PC, 1, 2, 3 and 4 weeks after cultivation (WAC))
This trend has also been observed at FAR’s Chertsey Establishment trial in Canterbury. Recent sampling from 0-7.5 cm suggests a trend of greater soil water holding capacity (the soils full point) as tillage intensity reduces (Figure 21) in both irrigated and dryland systems, where water holding capacity was greatest in No till followed by Non-inversion and inversion. These differences are also evident at greater depths as soil water content monitoring using neutron probe to 50 cm through 2019/2020 (Figure 22) determined that no-till plots consistently had more water available in the root zone for plant growth than inversion plots. Figure 21: Water holding capacity (0-7.5 cm) between dryland and irrigated establishment practices measured July 2020. Error bars represent LSD 5% between establishment treatments.
Figure 22: Soil water content through 2019/2020 monitored using neutron probe to 50 cm depth.

Increasing the input of organic matter to the soil can also improve soil physical quality. Inputs can be
increased through the use of restorative sequences in your rotation or the inclusion of cover crops
between sequences. Initial research undertaken at NCRS has demonstrated that the inclusion of
cover crops in a maize system has increased soil aggregate stability, a measure of soil aggregate
strength during wetting events. This change is promising and requires further research in the future.

Table 2: Cover crop yields, aggregate stability, soil coverage, maize population and grain yields. Fal =
Fallow, Cult = Cultivated, ARG = annual ryegrass, NT = no till, CC Mix = cover crop mix, CC = cover
crop, Per Clv = Perennial clover (red & white), (IS) = inter-seeded.

 Treatment               Cover crop     Aggregate       Mulch soil       Grain
                           (t/ha)        stability      coverage*         yield
                                        (% >1 mm)          (%)           (t/ha)
 Fal + Cult                   -           43.5 a          10 a           5.0 a
 ARG + Cult                  1.6          44.3 a           15 a          4.1 ab

 ARG + NT                    1.4           47 ab          87.3 c         3.3 ab

 CC Mix + NT                 6.2          53.8 b          98.5 c         3.1 ab
 CC + NT (IS)                7.6          52.1 ab         92.8 c         2.1 b
Per Clv + NT (IS) 2.9 55.6 b 73.8 b 2.8 ab P value 0.044
Essential Freshwater Package
The aim of this policy is to maintain or improve freshwater quality in New Zealand.

What is it?
There are three major changes that are in the package:

    1) National Environmental Standard for Freshwater

A national rule for freshwater. The standard is a minimum rule, regional councils can apply
additional rules.

    2) A refreshed National Policy Statement – Freshwater Management

A national policy direction that councils must give effect to in their regional plans – aim is to
maintain or improve water quality

    3) Amendments to Resource Management Act

Environmental protection authority now has the statutory power to directly enforce requirements of
RMA.

What does this mean for maize production?

Fertiliser – The synthetic nitrogen fertiliser cap of 190 kg N/ha/yr does not apply to a crop or
paddock that is not used to graze livestock. However, a paddock used for forage cropping may
receive more than 190 kg/ha/year but this must be offset by lower applications to the grazed
pastoral area on the farm. This makes sense in a traditional cropping or winter forage production
system – but gets confusing in a maize silage system as according to the regulation the grass
between maize becomes a winter forage crop. We are working on understanding how these systems
will be impacted by the rules – but the key message is to keep N use records and start working on a
farm environment plan.

Intensive winter grazing – From 2021 onwards an annual forage crop grazed by livestock at any time
between 1 May and 30 September is classed as intensive winter grazing. Intensive winter grazing
must occur on no more than 50 ha or 10% of the property, whichever is greater. Winter grazing
needs to be avoided on slopes of more than 10 degrees, and in conditions that cause pugging – if
you think your system will encounter these challenges you may need to apply for a resource
consent.

Setbacks – Stock need to be kept a minimum of 3 metres back from wetlands, lakes and rivers with a
bed width of 1 metre or greater, except where permanent fencing is already in place.

Farm Environment Plans
The Essential Freshwater Package will make it mandatory to have an enforceable freshwater module
in a farm environment plan. Over the next 12+ months, the Government will work with primary
sector representatives, iwi/Māori, regional councils and other interested groups to set out the exact
requirements for these freshwater modules. It is intended that the new farm plan freshwater
module be added to existing FEP templates, meaning that if you already have a FEP, it may need
adjusting in future BUT you don’t need to panic as the existing FAR environmental plan template
already largely covers the new requirements.
Zero Carbon Amendment Bill
What is it?
The Zero Carbon Amendment Bill has been passed to provide a framework to implement clear and
stable climate change policies. A climate change commission has been established that is charged
with setting national emission budgets. These budgets are set every five years and aim to meet the
following goals:
- Reduce national GHG emissions to 30% below 2005 levels by 2030
- Net zero GHG emissions by 2050
What does it consider?
In setting it’s budgets the commission is considering the way land and energy are used, alongside
economic and social implications of emission reductions. The budgets will be production focussed,
so emissions produced on farm only rather than including those that are produced when produce is
consumed outside of the farm gate.
How will it work?
The primary industries and government are working together in a programme called He Waka Eke
Noa, which aims to build a framework to reduce bio-genic agricultural emissions. The time steps to
be aware of with this programme are:
- December 2022 – All farmers and growers in NZ will know their annual total on-farm
emissions
- December 2024 – Farmers and growers will have a written plan to measure and manage
emissions
- January 2025 – A system will be in place for farm level accounting and reporting of emissions
What can I do?
The primary emission source in a maize silage or grain system is nitrous oxide generated from
nitrogen fertiliser. FAR are committed to a research programme that aims to maximise nitrogen use
efficiency in maize systems over the next five years. The aim is to build confidence in any mitigation
strategies prior to reporting starting in 2025.Health & Safety
You are visiting working farms. Please take appropriate care and be aware of potential
hazards. For your safety, please:
• Follow instructions from FAR staff, or farmer hosts, at all times.
• Stay within the areas specified by FAR/farmer hosts.
• Report any hazards noted directly to a member of FAR/event staff.
Specific hazards to be aware of:
• COVID-19: Please scan the QR code at this event. Hand sanitiser and masks are
available.
• Vehicles: Please look out for moving vehicles.
• Trips and falls: Watch out for uneven ground.
• Weather: Sun block is available.
First aid and emergencies
FAR staff are qualified First Aiders and there are First Aid kits on site. Should you require any
assistance, please ask a FAR staff member.
In case of emergency notify a FAR staff member or call 111.
The addresses for the visits are:
• Paul Hunter - 42 Andrew Road, Parawera
• David Rawnsley – 137 Wharepoa Road West, Kerepehi
• Isaac Higham – 190 Higham Road, South HeadFoundation for Arable Research
PO Box 23133, Hornby
Christchurch 8441
Phone: 03 345 5783
Email: far@far.org.nz
Follow us
@FARarable
www.far.org.nzYou can also read