MOIRÉ PHONONS IN TWISTED MOSE 2-WSE2 HETEROBILAYERS AND THEIR CORRELATION WITH INTERLAYER EXCITONS
←
→
Page content transcription
If your browser does not render page correctly, please read the page content below
2D Materials

PAPER • OPEN ACCESS

Moiré phonons in twisted MoSe2–WSe2 heterobilayers and their
correlation with interlayer excitons
To cite this article: Philipp Parzefall et al 2021 2D Mater. 8 035030

View the article online for updates and enhancements.

                               This content was downloaded from IP address 132.199.243.26 on 16/08/2021 at 12:31
2D Mater. 8 (2021) 035030 https://doi.org/10.1088/2053-1583/abf98e
OPEN ACCESS
PAPER
RECEIVED
Moiré phonons in twisted MoSe2–WSe2 heterobilayers and their
24 February 2021
REVISED
correlation with interlayer excitons
1 April 2021
ACCEPTED FOR PUBLICATION
Philipp Parzefall1,5, Johannes Holler1,5, Marten Scheuck1, Andreas Beer1, Kai-Qiang Lin1, Bo Peng2,
19 April 2021 Bartomeu Monserrat2,3, Philipp Nagler1, Michael Kempf 4, Tobias Korn4 and Christian Schüller1,∗
1
PUBLISHED Institut für Experimentelle und Angewandte Physik, Universität Regensburg, 93053 Regensburg, Germany
5 May 2021 2
Theory of Condensed Matter Group, Cavendish Laboratory, University of Cambridge, Cambridge CB3 0HE, United Kingdom
3
Original content from this Department of Materials Science and Metallurgy, University of Cambridge, Cambridge CB3 0FS, United Kingdom
4
work may be used under Institut für Physik, Universität Rostock, 10059 Rostock, Germany
the terms of the Creative 5
These authors contributed equally.
Commons Attribution 4.0 ∗
licence.
Author to whom any correspondence should be addressed.
Any further distribution of E-mail: christian.schueller@ur.de
this work must maintain
attribution to the Keywords: moiré phonons, moiré superlattice, Raman scattering, transition-metal dichalcogenides, interlayer excitons
author(s) and the title of
the work, journal citation
and DOI.
Abstract
We report about the investigation of twisted MoSe2 homo- and MoSe2 –WSe2 heterobilayers by
means of low-frequency Raman spectroscopy (LFRS) and low-temperature micro
photoluminescence (µPL). In room-temperature LFRS experiments on both, twisted MoSe2
homobilayers and twisted MoSe2 –WSe2 heterobilayers, we observe moiré phonons, i.e. folded
acoustic phonon modes due to the moiré superlattice. In the heterobilayers, we can identify moiré
phonons of both materials, MoSe2 and WSe2 . While the twist angles for the homobilayers are
relatively precisely known from the applied tear-and-stack preparation method, the twist angles of
the heterobilayers have to be determined via second-harmonic-generation microscopy on
monolayer regions of the samples, which has significant uncertainties. We show that by the moiré
phonons of the heterobilayers, the relative twist angles can be determined on a local scale with
much higher precision. We apply our technique for the investigation of a large area H-type (twist
angle θ = 60◦ + δ ) MoSe2 –WSe2 heterobilayer. These investigations show that spatial regions,
which can be identified to be atomically reconstructed (i.e. δ = 0◦ ) by the observation of an
interlayer shear mode in LFRS experiments, exhibit a strong, momentum-allowed
interlayer-exciton signal in low-temperature µPL. On the contrary, regions, where moiré phonons
are observed, i.e. which can be identified to be rigidly twisted by a misalignment angle in the range
of 5◦ ≲ |δ| ≲ 6◦ , exhibit no significant interlayer-exciton signals.
1. Introduction [5]. Superior properties of these materials are
huge exciton binding energies [6], accompanied by
One of the most fascinating properties of van der large oscillator strengths [7], and, as a combina-
Waals materials is the possibility to stack different tion of noninversion symmetry and a strong spin-
materials on top of each other with arbitrary, but orbit interaction, the so called spin-valley locking
well-controlled relative crystal orientations [1]. For [8, 9]. In the past few years heterobilayer structures,
bilayer graphene this has, e.g. lead to the intriguing like MoSe2 –WSe2 heterobilayers, which exhibit a
discovery of a superconducting state [2]. Within staggered type-II band-edge alignment [10–12] have
the tremendous number of van der Waals materials been in the focus within this research avenue. In
which nature offers, the semiconducting transition- these structures, an ultrafast charge separation of
metal dichalcogenides (TMDCs) have attracted a lot photoexcited charge carriers into the two constitu-
of attention during the past decade [3, 4]. A fore- ent layers takes place, and interlayer excitons (ILEs)
most reason for this is that they represent in the form [13–16]. For the MoSe2 –WSe2 system, the ILE
monolayer form direct-bandgap semiconductors are momentum-allowed—i.e. optically bright—only,
© 2021 The Author(s). Published by IOP Publishing Ltd.2D Mater. 8 (2021) 035030 P Parzefall et al
if the two constituent layers are crystallographic- detected and systematically studied in WSe2 twis-
ally aligned [17]. This means, rotated by θ = 60◦ (H- ted homobilayers [44]. So far, LFRS on interlayer
type stacked) or by θ = 0◦ (R-type stacked) relative to shear- (ISM) and breathing modes (BMs) has been
each other. The research on TMDC bilayers has been an important tool for the investigation of interlayer
recently strongly driven by the fact that in twisted coupling in bilayer- and multilayer structures. In [45]
bilayers moiré superlattices can form. The effects of a bond polarizability model is introduced to describe
moiré superlattices on ILE in heterobilayer structures how the LFRS intensities depend on the stacking
has fueled this research strongly [18–25]. Moreover, sequence of different 2D materials. The first obser-
the long-range periodicity, arising from the moiré vation of ISM, where adjacent layers oscillate rigidly
potential landscape, can enable fundamental changes against each other, in MoS2 multilayers was reported
of the electronic and phononic properties of van der by Plechinger et al [46]. Crucially, for the existence
Waals homo- and heterostructures [2, 26–31]. For of ISM, a restoring force for the rigid layer displace-
rigid lattices, moiré structures are expected to form ment is required, which is always present in naturally
in heterobilayers even for perfectly aligned struc- stacked (3R or 2H) multilayers of the same mater-
tures, because of the different lattice constants of ial, due to the atomic registry between the layers.
the constituent materials [32]. However, this would Subsequently, ISM have also been observed for other
only be true, if it would also be the energetically TMDC multilayers and homobilayers with R-type or
most favorable state. Indeed, very recently it has been H-type stackings [43, 47, 48]. For twist angles θ other
shown experimentally via conductive atomic force than 0◦ or 60◦ [43, 48], or, for heterobilayers [47]
microscopy [33] and transmission electron micro- and hetero-multilayers [49], where there is no restor-
scopy [34] that in TMDC heterobilayers [33, 34] and ing force for an ISM expected under the assumption
homobilayers [34] for small twist angle deviations δ of rigid lattices, only BM were reported [43, 47–49].
from θ = 0◦ + δ or θ = 60◦ + δ, atomic reconstruction For the BM, the van der Waals force between the lay-
takes place, where the atoms in the two constituent ers plays the role of the restoring force. In [48] it is
layers arrange like in R- or H-type homobilayers. shown how the BM can be used to identify regions
Similar reconstructions have also been reported for of different high-symmetry stackings in slightly twis-
bilayer graphene [35]. In [33, 34] it is shown that in ted homobilayers. The first observation of an ISM
the bilayers domains with H-type or R-type stacking in MoSe2 –WSe2 heterobilayers has been reported in
configurations form, where the size of the domains [17], and for MoS2 –WS2 heterobilayers in [50]. In a
depends on the twist-angle deviation δ. The range recent work on MoSe2 –WSe2 heterobilayers [51] it
here is from several tens to one hundred nanometers was shown that via observation of an ISM, regions
[33]. The domain formation was first predicted in of atomic reconstruction can be detected for twist-
[36], and confirmed by density functional theory cal- angle deviations of |δ| < 4◦ , i.e. in this twist-angle
culations [33, 34, 37, 38], and by a classical modelling range there are domains with perfect R-type or H-
[31]. Interestingly, in atomically-reconstructed struc- type stackings of the heterobilayers. This is due to the
tures the domain periodicity depends in the same way fact that a finite restoring force for the shear motion
on the twist-angle deviation, as the moiré periodicity is only present, if there is an atomic registry between
in structures, where the twist angle is larger than the the two layers, i.e. if they are stacked with exact R-type
critical value for atomic reconstruction [37]. Hence, or H-type alignment. Atomic reconstruction for |δ| ≲
a noninvasive and simple method, by which samples 4◦ was confirmed recently also for WSe2 homobilay-
can be characterized on a local scale with regard to ers [44]. There, it was found that for |δ| > 4◦ , where
atomic reconstruction and/or a precise determina- moiré superlattices form, the moiré phonons and in
tion of the local twist angle, i.e. the moiré periodicity, particular the BM can be used as sensitive probes of
is highly desireable. the local twist angle in large-scale Raman hyperspec-
From the beginning, Raman spectroscopy has tral imaging experiments. An important result of this
been a powerful tool for the investigation of two- study was that the twist angle varies locally by about
dimensional crystals. It has been very successfully one degree on the scale of a few micrometers. This
applied to graphene [39] and to TMDCs, see, e.g. happens most likely due to imperfections, occurring
the review articles [40–42], and references therein. in the stamping process of the bilayers.
Raman spectroscopy can also play a pivotal role for In the present work we have prepared large
the characterization and investigation of moiré super- series of MoSe2 homobilayer and MoSe2 –WSe2 het-
lattices. This has been impressively demonstrated by erobilayer samples via mechanical exfoliation and
the work of Lin et al [43], where the first observa- deterministic dry transfer. For the MoSe2 homobilay-
tion of folded acoustic and optical phonons due to the ers we report the observation of moiré phonons
moiré super-Brillouin zone, is reported for twisted for twist-angle deviations |δ| > 4◦ . Via samples with
MoS2 homobilayers. There, the name moiré phon- different twist angles, which are prepared by the
ons was coined for the backfolded modes, which we tear-and-stack technique (see section 2) and, there-
also use here. Recently, moiré phonons were also fore, the twist angles are very accurately known, we
22D Mater. 8 (2021) 035030 P Parzefall et al
Figure 1. (a) Schematic picture of a twisted MoSe2 homobilayer. The moiré superlattice vectors and primitive unit cell are shown
by green arrows and a green-shaded region, respectively. The red arrows indicate the lattice vectors of the crystallographic
superlattice. (b) First Brillouin zone and a neighboring Brillouin zone of one of the layers. b1 and b2 are reciprocal lattice vectors
of the two twisted lattices. g is a reciprocal lattice vector of the moiré superlattice. (c) Microscope image of a twisted MoSe2
homobilayer sample, which is prepared by the tear-and-stack technique. The yellow dotted line indicates the position of the top
layer before it was torn off. (d) Stokes LFRS spectra of a series of twisted MoSe2 homobilayers. The twist angles, as intended in the
preparation process, are indicated. The arrows mark peaks, which are identified as moiré phonons. (e) Comparison of
experimentally determined mode positions and calculated LA and TA phonon dispersions of a MoSe2 monolayer.
demonstrate good agreement of the energies of fol- 2. Materials and methods
ded acoustic phonons with the monolayer phonon
dispersion. The latter are calculated via the supercell 2.1. Sample preparation
approach, with the real-space force-constants calcu- All homo- and heterobilayer samples are prepared
lated in the density-functional perturbation theory on silicon wafers with a SiO2 layer via mechanical
[52]. The main focus of the present work, however, is exfoliation, using Nitto tape, and a deterministic
the observation of moiré phonons in twisted MoSe2 – all-dry transfer technique [53], employing polydi-
WSe2 heterobilayers. In some of these samples, folded methylsiloxane (PDMS) stamps. After preparation,
acoustic modes of both constituents can be observed. all samples are annealed in vacuum at a temperature
We show that the moiré phonons allow for a much of ∼ 400 K for at least one hour to reach tight contact
better local twist-angle determination, as compared between the constituent layers. For the preparation of
to angle-resolved second-harmonic (SHG) micro- twisted MoSe2 bilayers, a special procedure is used,
scopy, on which one otherwise has to rely for het- which we will call in the following tear-and-stack,
erobilayer samples. We then apply our technique to and which is motivated by a previously developed
the investigation of a large-area H-type heterobilayer method [54]. First, a large-area MoSe2 monolayer is
sample, for which—from SHG—a twist-angle devi- partially stamped by the PDMS film onto the SiO2
ation of |δ| = (5 ± 3)◦ is determined. We show that wafer. The PDMS stamp is then abruptely lifted again
by LFRS experiments we can identify sample regions, so that the MoSe2 monolayer is torn in half and one
which show a strong ISM and no moiré phonons, part sticks on the SiO2 wafer, while a second part
i.e. which are obviously atomically reconstructed. still sticks on the PDMS film. The SiO2 wafer is then
In these regions, a strong interlayer exciton peak is rotated by a defined angle and subsequently the layer
observed in low-temperature µPL. In the major part on the PDMS film is stamped onto the first layer.
of the sample, however, no ISM but moiré phonons Via this procedure, the twist angle is relatively accur-
can be found, from which a finite, local twist-angle ately known. Figure 1(c) shows a microscope image
variation between about 5◦ and 6◦ can be concluded. of one of the bare homobilayer samples, prepared
In these regions, no, or only weak signals from inter- by the described tear-and-stack technique. MoSe2 –
layer excitons are detected. WSe2 heterobilayers are fabricated by two sequential
32D Mater. 8 (2021) 035030 P Parzefall et al
stamping processes of the two constituent layers. where ki (ks ) is the wave vector of the incident
Here, straight edges of the individual flakes are used (scattered) light and q that of the created/annihilated
as an orientation for estimates of the twist angle. (plus/minus sign) phonon in the crystal. Since ki ∼
ks ∼ 0 in the visible spectral range, when compared to
2.2. Optical experiments the extension of the Brillouin zone, we have q ∼ ±G
The twist angles of all heterobilayer samples are for the wave vector of the phonon. G is a reciprocal
determined via angle-resolved SHG microscopy [55]. lattice vector, which does not play a significant role
The uncertainties associated to this method are elab- in a usual crystal without superlattice, since all higher
orated in more detail in the main body of the paper. Brillouin zones can be projected to the first Brillouin
For the SHG experiments, a mode-locked Ti:Sapphire zone, and therefore q ≃ 0 holds for the momentum
laser is used at ∼ 800 nm wavelength and with ∼ 100 of the phonons, observable in a Raman experiment.
fs pulses. The co-polarized SHG signal is analyzed Now the moiré superlattice comes into play. If we
with a rotatable half-wave plate and a linear polar- use the reciprocal lattice vector g of the moiré super-
izer, and detected in a grating spectrometer with lattice in equation (1) for G, it follows that, e.g.
Peltier-cooled CCD camera. The Raman and µPL acoustic phonons, which are usually inaccessible in
experiments are performed in an optical scanning- Raman experiments due to the small momentum of
microscope setup. LFRS spectra are taken at room visible light, can be expected in LFRS experiments
temperature under ambient conditions, while the on twisted bilayer samples. They can be mapped
µPL spectra are conducted in a cold-finger cryostat out by the reciprocal superlattice vector g. This phe-
at nominally T = 4 K. As excitation source for both nomenon is well known from one-dimensional short-
types of experiments, a 532 nm laser line is used. The period semiconductor superlattices (e.g. GaAs–AlAs),
laser is focused to a spot of ∼ 1 µm diameter by a and the mapped phonons are then also called folded
100 × microscope objective. For stray-light reduction acoustic phonons. In [43] and [44] it was found that it
in the LFRS experiments, we use a Bragg-filter set. The is the moiré reciprocal lattice vector g rather than the
spectra are analyzed with a grating spectrometer and reciprocal lattice vector of the crystallographic super-
a Peltier-cooled CCD camera. lattice, which contributes to the Raman scattering in
the accessible frequency range. Moreover, a crystal-
3. Results and discussion lographic superlattice occurs for distinct commen-
surate lattice arrangements, i.e. distinct twist angles,
We start our report by the investigation of MoSe2 only [43, 56]. Therefore, we will use the moiré recip-
homobilayer samples. The moiré-lattice formation rocal lattice vector in the following. It is important
in homobilayers and its characteristics are nicely to note here that the assumption of zone folding is
described in the excellent work on MoS2 homobilay- only approximately correct. Very recently, it has been
ers by Lin et al [43] (cf also [56] on twisted bilayer shown for twisted bilayer graphene [57] and MoS2
graphene). We start here with a very brief descrip- [58] that interlayer coupling and lattice reconstruc-
tion of the most important features. Figure 1(a) tion can lead to frequency renormalizations and even
shows a schematic picture of a twisted R-type (θ = 0◦ ) sidebands [57] of phonons.
homobilayer in real space with a twist-angle deviation Figure 1(c) shows a microscope image of one of
of δ = 11◦ . The moiré-pattern formation can be seen, the MoSe2 homobilayers, which is prepared by the
and the corresponding moiré lattice vectors and the tear-and-stack technique. The bottom layer is out-
resulting supercell are indicated by green arrows and a lined by a red line, while the top layer is marked by a
green-shaded region, respectively. The lattice vectors yellow line. The position, where the top layer was torn
of the crystallographic superlattice, which for δ = 11◦ off before, is outlined by a yellow dotted line. From
is a (7,5) superlattice [43, 56], are also indicated by red this preparation procedure, the twist angle is relatively
arrows. They are for this case just twice as long as the accurately known. By hyperspectral imaging of this
moiré lattice vectors. Figure 1(b) shows the first Bril- sample (not shown), we determine, similar to the res-
louin zone of one of the layers and a corresponding ults of [44] on WSe2 homobilayers, a local variation
reciprocal lattice vector b1 . The reciprocal lattice vec- of the twist angle across the bilayer region of about
tor b2 of the twisted lattice is also shown. The recip- 1◦ . We have prepared in total about 15 homobilayer
rocal lattice vector of the moiré superlattice is then samples by this technique. For samples with twist-
given by g = b2 − b1 . The dotted line from the Γ point angle deviations |δ| ⩽ 5◦ (not shown), we find a pro-
of the first Brillouin zone to the middle between the M nounced ISM mode, which is an indication for atomic
and the K point indicates schematically the curvature, reconstruction (R-type) [51]. In eight samples with
which is followed by g for larger twist angles δ ⩽ 30◦ . twist-angle deviations |δ| ⩾ 5◦ , clear indications for
For Raman scattering, energy and momentum con- moiré phonons can be found. In figure 1(d), Stokes
servation holds. In a translationally-invariant crystal, Raman spectra for these eight samples with twist
the momentum conservation reads angles between 5◦ and 29◦ are shown in the frequency
region, where the folded acoustic phonon modes
ks = ki ± q + G, (1) appear, which is above the low-frequency region of
42D Mater. 8 (2021) 035030 P Parzefall et al
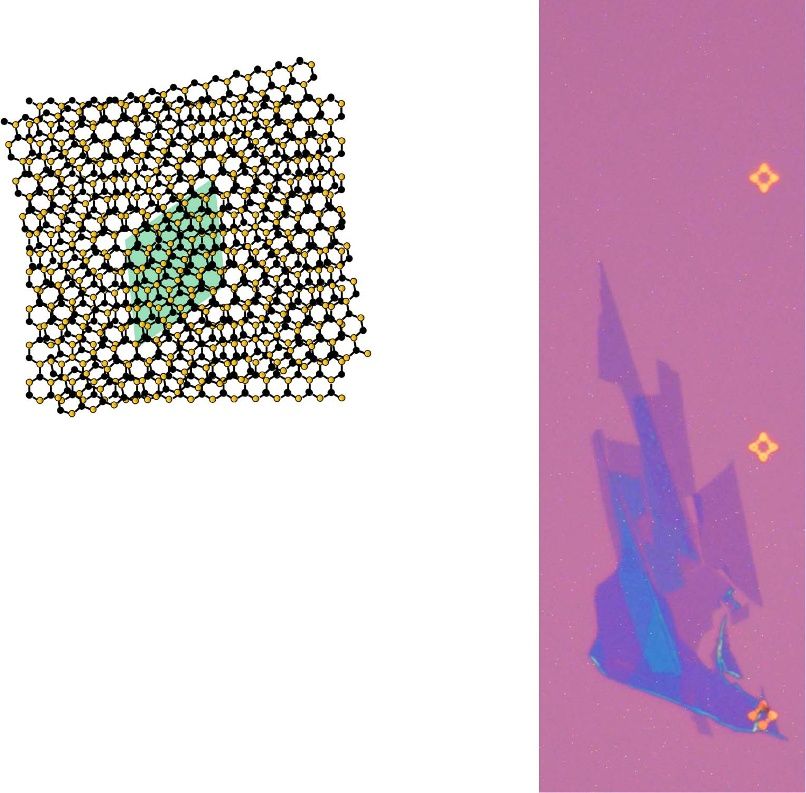
Figure 2. (a) Microscope image of a MoSe2 –WSe2 heterobilayer. The heterostructure region is marked by a white solid line. At the
three positions, marked by colored stars, SHG measurements on the monolayers are taken. (b) Polar plot of the angle-resolved,
normalized SHG intensities, measured on spots 1, 2, and 3, as indicated in (a). (c) Stokes LFRS spectra of a series of twisted
MoSe2 –WSe2 heterobilayers. The twist angles, as determined from the moiré-phonon mode positions (see text), are indicated.
(d) Comparison of the moiré-phonon mode positions to the calculated LA and TA phonon dispersion curves of monolayer
MoSe2 and WSe2 . The experimental data from the spectra in (c) is marked by diamonds of the same color. The average
uncertainty of the twist angle across the heterostructure region, resulting from SHG determination, is indicated by a black double
arrow (see text for explanation).
the ISM and BM [41]. The mode positions, which of heterobilayers the tear-and-stack technique can not
are unique for a given twist angle, are marked by be applied, the twist angle is not known from the
small red and blue arrows. Red arrows mark the fol- preparation process as accurately as for homobilay-
ded longitudinal acoustic modes, while folded trans- ers. Here, typically one has to rely on SHG meas-
verse acoustic modes are marked by blue arrows. urements. An intrinsic drawback of this method for
Figure 1(e) shows a comparison of the mode positions heterostructures is, however, that the SHG measure-
to calculations of the dispersions of longitudinal (LA) ments have to be done on the monolayer parts of the
and transverse (TA) acoustic phonon branches for a individual layers, i.e. outside the bilayer region. In the
MoSe2 monolayer. The calculations are performed, following we will show that this comes with some
following [52]. For the solid lines in figure 1(e), the uncertainties, in particular for large-area samples.
calculated phonon dispersions for the Γ−K and the We note that via phase-sensitive SHG measurements
Γ−M directions have been averaged along the dotted on the bilayer region, one can only discriminate
line in figure 1(b), as described in detail in the sup- between R-type and H-type stackings [23] but not
plemental material of [43]. The experimental error accurately determine other twist angles. In the SHG
is smaller than the symbol size in figure 1(e). One experiments, the crystallographic orientation of the
can recognize good agreement of the experimental individual monolayers is determined by measuring
data with the calculated dispersion curves. Similar the angle-resolved intensity of the polarized SHG
agreement has been observed for MoS2 and WSe2 signal. Figure 2(a) shows a microscope image of a
homobilayers in [43] and [44], respectively. We com- large-area heterobilayer, investigated in this work. For
plete this here for MoSe2 homobilayers and take this this sample, a twist angle of θ = 60◦ (H-type) was
as an overall good indication that the twist angles can intended. Three exemplary spots, where SHG meas-
be accurately determined via comparison of locally- urements of the monolayers are taken, are labeled
observed moiré phonon energies to calculated mono- by stars, which are numbered by 1, 2, and 3 in
layer phonon dispersion curves. figure 2(a) (in total, eight spots are measured on this
Next, we will discuss the LFRS results on the sample). Figure 2(b) shows polar plots of the nor-
MoSe2 –WSe2 heterobilayers. Since for the preparation malized SHG intensities, measured on these spots.
52D Mater. 8 (2021) 035030 P Parzefall et al
While the accuracy of the crystal orientation determ- determination of the local twist angle because of four
ination from a SHG measurement itself is about 1◦ , an modes, which have to fit to the calculated disper-
uncertainty for the twist angle across the heterobilayer sion curves. We emphasize here that there may still
region is obvious from the results in figure 2(b): when be an uncertainty in the absolute value of the twist
comparing the measured orientations at spots 1 and angles because of the limited accuracy of DFT cal-
3, a twist angle |δ1 | ∼ 5◦ can be deduced, while spots 2 culations. However, the relative twist angle between
and 3 deliver a value of |δ2 | ∼ 3◦ for the relative twist two samples, or, between different spots of the
angle of the two layers. We have measured the twist same sample, can be determined with high precision
angles of in total 33 heterobilayers, where multiple (see below).
spots could be measured, by this method and carefully We start by comparing LFRS spectra and low-
analyzed the uncertainties for all individual samples. temperature µPL on selected spots on this large-
As a result of these investigations, taking into account area heterobilayer. This H-type heterobilayer has a
all possible error sources, we receive an average uncer- twist-angle deviation of |δ| = (5 ± 3)◦ as determ-
tainty of about 4◦ for the twist angle of a hetero- ined via angle-resolved SHG from the monolayer
structure, as determined via SHG measurements on regions (see above). Therefore, refering to the res-
monolayer regions. This average uncertainty, which ults of [51], we can expect some spatial regions with
is corroborated by our local LFRS measurements fur- |δ| < 4◦ , i.e. with atomic reconstruction of H-type
ther below, is indicated in figure 2(d). in this sample. Figures 3(a) and (b) show room-
Figure 2(c) shows Stokes LFRS spectra of four het- temperature Stokes/antistokes LFRS spectra with
erobilayers with different twist angles, as indicated in unpolarized detection, taken in the regions, marked
the figure. The black arrows mark peaks, which we by a green circle and a yellow hexagon in figure 3(c),
assign to moiré phonons of the heterobilayers. On respectively. The two spectra are apparently markedly
12 samples out of a total of 33 prepared heterobilay- different. While the spectra in figure 3(a) show peaks,
ers we could unambiguously identify two to four which can be assigned to moiré modes of the two lay-
moiré modes from folded acoustic phonons, which ers (red and blue arrows corresponding to MoSe2 and
could be reproducibly observed on different spots WSe2 modes, respectively), the spectra in figure 3(b)
on the sample. The experimental mode positions are exhibit only one sharp mode, which can be attributed
plotted in figure 2(d), where different colors corres- to the ISM of the heterobilayer [51]. The observa-
pond to different samples to emphasize the num- tion of an ISM is a clear indication for atomic recon-
ber of observed modes per sample. The data points, struction [51], i.e. a relative twist angle of δ = 0, while
which are extracted from the spectra in figure 2(c), the observation of moiré phonons indicates a finite
are indicated with diamonds in figure 2(d). As elab- twist angle. In [51] it was shown that for MoSe2 –
orated above, the twist angles as determined by SHG WSe2 heterobilayers atomic reconstruction should be
have a significant uncertainty. Therefore, we apply present for |δ| < 4◦ . Therefore, we conclude that in
the following procedure to get a more precise twist- the area, marked by the yellow hexagon in figure 3(c),
angle determination: The experimental data points in the nominal twist angle must be in this range,
figure 2(d) are horizontally shifted within the twist- and atomic reconstruction has taken place. This is
angle error margins of the individual SHG meas- strongly corroborated by low-temperature µPL meas-
urements for a best fit to the calculated MoSe2 and urements of the same sample region. Figure 3(e)
WSe2 monolayer phonon dispersions, plotted as solid exhibits a strong interlayer-exciton signal in the
lines in figure 2(d). Since the relative lattice mis- yellow-shaded region. Obviously, due to the atomic
match between MoSe2 and WSe2 is only 0.004, we reconstruction, the lattices are perfectly matched on
use here for the calculated curves the twist angles of the atomic scale, and the interlayer-exciton trans-
the respective twisted homobilayers. Remarkably, for ition is momentum-allowed and therefore bright. In
all samples a very good fit of the experimental mode figure 3(d), the PL from the region, marked with a
positions to the calculated curves can be obtained, green circle in figure 3(c), is plotted. There, no sig-
as mentioned, within the error bars of the SHG nificant interlayer-exciton signal can be detected in
angle determinations. The average uncertainty of the the yellow-shaded region, while the intralayer PL sig-
SHG determination is exemplarily shown by the black nals of the constituent layers, around 1600 meV, are
double arrow in figure 2(d). For most of the samples still present. With the finite twist-angle deviation of
we observe two moiré phonons of the MoSe2 layer, |δ| ∼ 5◦ , as deduced from the moiré-phonon ener-
only, which is the bottom layer of the heterostruc- gies, the interlayer-exciton is momentum forbidden,
ture. For three samples, three moiré phonons are and therefore dark. This impressively demonstrates
observed: two from MoSe2 and one from WSe2 , and the strength of our method: Via LFRS experiments,
for one sample, we find all four moiré modes of the relative twist angle can be very accurately determ-
the two materials (four red dots in figure 2(d) at ined on a local scale. This allows one to distinguish
5.3◦ ). Therefore, in the remainder we will concen- between regions of atomic reconstruction and regions
trate on this sample (shown in the micrograph in with a moiré lattice, i.e. a finite twist-angle deviation
figure 2(a)), which allows for a very accurate relative δ. To emphasize the accuracy, figure 3(f) shows a
62D Mater. 8 (2021) 035030 P Parzefall et al
Figure 3. (a) Stokes/antistokes LFRS spectra from the region, indicated by a green circle in (c). The arrows mark positions of
moiré phonons, BM labels the breathing mode of the bilayer. (b) Stokes/antistokes LFRS spectra from the region inside the yellow
hexagon in (c). An interlayer shear mode ISM can be observed in this region. (c) Color map of low-temperature µPL intensities in
the spectral region of the interlayer exciton, around 1390 meV. (d) PL spectrum from the region, marked with a green circle in (c).
(e) PL spectrum from the region, marked with a yellow hexagon in (c). The yellow-shaded region highlights the interlayer exciton.
(f) Enlargement of the Stokes spectrum in (a). (g) Comparison of the mode positions of the moiré phonons to the calculated LA
and TA phonon dispersions of the monolayers. The vertical dotted line indicates the best fit, which yields a twist angle of 5.3◦ .
spectrum, and more pronounced in spectra on dif-
ferent sample spots, where the lower-energy peaks are
then less pronounced. The experimental mode posi-
tions, as marked by arrows, are plotted in figure 3(g)
together with the calculated acoustic phonon dis-
persions in this range. A best fit of the mode pos-
itions to the calculated curves delivers a twist angle
of |δ| = 5.3◦ , indicated by the vertical dashed line in
figure 3(g). From this we estimate that a relative dif-
ference of twist angles of ∼ 0.1◦ can be detected by
this method.
Finally, we show in figure 4 again a microscope
image of the investigated heterobilayer. In this figure,
regions which could be identified to be atomically
reconstructed by the detection of a strong ISM signal,
are marked by yellow hexagons, while regions, where
moiré phonons could be detected, are marked with
green circles. In these regions, the corresponding twist
angles, as determined from the moiré-mode posi-
tions, are given. A twist-angle variation of about 1◦
Figure 4. Microscope image of the heterobilayer sample, can be noticed for the twisted regions. This is in over-
displayed in figure 2(a). The yellow hexagons mark all good agreement with results on WSe2 homobilay-
regions, where a strong ISM is detected, i.e. which are
atomically reconstructed. Regions where moiré
ers [44] and our experiments on MoSe2 homobilayers
phonons are measured, are indicated by green circles. (not shown).
The numbers give the local twist angles, as determined
from the moiré phonon mode positions. A local
variation of about 1◦ can be deduced for the twisted 4. Conclusion
regions. For each region, the given twist angles are
confirmed by measuring two to five different spots
within the region. We have observed folded acoustic phonons of
the moiré superlattice in twisted MoSe2 homo-
and MoSe2 –WSe2 heterobilayers via low-frequency
Raman spectroscopy. Comparison of the observed
blowup of the Stokes LFRS spectrum in figure 3(a). moiré phonon modes to calculations of the acoustic
We note that the mode at ∼ 49 cm−1 is only barely phonon dispersions of the constituent monolayers
visible. It is, however, also present in the antistokes allows for a precise local twist-angle determination
72D Mater. 8 (2021) 035030 P Parzefall et al
of the heterobilayers. For a large-area heterobilayer, [6] Chernikov A, Berkelbach T C, Hill H M, Rigosi A F, Li Y,
we have demonstrated the correlation between the Aslan O B, Reichman D R, Hybertsen M S and Heinz T F
2014 Phys. Rev. Lett. 133 076802
intensity of an interlayer exciton at low temper-
[7] Poellmann C et al 2015 Nat. Mater. 14 889
atures with the corresponding room-temperature [8] Xiao D, Liu G B, Feng W, Xu X and Yao W 2012 Phys. Rev.
LFRS spectra: Spatial regions, which can be identi- Lett. 108 196802
fied to have atomic reconstruction by the observa- [9] Mak K F, He K, Shan J and Heinz T F 2012 Nat. Nanotechnol.
7 494
tion of a strong interlayer shear mode in the LFRS
[10] özçelik V O, Azadani J G, Yang C, Koester S J and Low T
experiments, show a strong and sharp momentum- 2016 Phys. Rev. B 94 035125
allowed interlayer exciton signal, while regions, where [11] Kośmider K and Fernández-Rossier J 2013 Phys. Rev. B
moiré phonons can be detected, exhibit no signific- 87 075451
[12] Kang J, Tongay S, Zhou J, Li J and Wu J 2013 Appl. Phys. Lett.
ant interlayer-exciton signal. This demonstrates that
102 012111
room-temperature LFRS of interlayer shear modes [13] Fang H et al 2014 Proc. Natl Acad. Sci. 111 6198
and moiré phonons is a highly valuable tool for the [14] Rivera P et al 2015 Nat. Commun. 6 6242
identification of spatial regions in transition-metal [15] Rivera P, Seyler K L, Yu H, Schaibley J R, Yan J,
Mandrus D G, Yao W and Xu X 2016 Science 351 688
dichalcogenide heterostructures where, e.g. interest-
[16] Kunstmann J et al 2018 Nat. Phys. 14 801
ing moiré physics, like correlated interlayer-exciton [17] Nayak P K et al 2017 ACS Nano 11 4041
phases, can be expected in high-quality samples. [18] Zhang C, Chuu C P, Ren X, Li M Y, Li L, Jin C, Chou M Y
and Shih C K 2017 Sci. Adv. 3 e1601459
[19] van der Zande A M et al 2014 Nano Lett. 14 3869
Data availability statement [20] Alexeev E M et al 2019 Nature 567 81
[21] Jin C et al 2019 Nature 567 76
[22] Seyler K L, Rivera P, Yu H, Wilson N P, Ray E L,
The data that support the findings of this study are Mandrus D G, Yan J, Yao W and Xu X 2019 Nature
available upon reasonable request from the authors. 567 19
[23] Tran K et al 2019 Nature 567 71
[24] Brotons-Gisbert M et al 2020 Nat. Mater. 19 630
Acknowledgments [25] Brotons-Gisbert M, Baek H, Campbell A, Watanabe K,
Taniguchi T and Gerardot B D 2021 (arXiv:2101.07747v1)
[26] Bistritzer R and MacDonald A H 2011 Proc. Natl Acad. Sci.
We greatfully acknowledge funding by the Deutsche 108 12233
Forschungsgemeinschaft (DFG, German Research [27] Cao Y et al 2018 Nature 556 80
Foundation) - Project-ID 314695032-SFB 1277 (sub- [28] Wang L et al 2020 Nat. Mater. 19 861
[29] Cao Y, Rodan-Legrain D, Rubies-Bigorda O, Park J M,
project B05), SPP2244, and projects KO3612/3-1, Watanabe K, Taniguchi T and Jarillo-Herrero P 2020 Nature
KO3612/4-1, and SCHU1171/10-1. 583 215
[30] Liu X et al 2020 Nature 583 221
ORCID iDs [31] Mait I, Naik M H, Maiti P K, Krishnamurthy H R and Jain M
2020 Phys. Rev. Res. 2 013335
[32] Kumar H, Er D, Dong L, Li J and Shenoy V B 2015 Sci. Rep.
Philipp Parzefall https://orcid.org/0000-0001- 5 10872
5015-329X [33] Rosenberger M R, Chuang H J, Phillips M, Oleshko V P,
Johannes Holler https://orcid.org/0000-0002- McCreary K M, Sivaram S V, Hellberg C S and Jonker B T
5271-5265 2020 ACS Nano 14 4550
[34] Weston A et al 2020 Nat. Nanotechnol. 15 592
Kai-Qiang Lin https://orcid.org/0000-0001-9609- [35] Sushko A, De Greve K, Andersen T I, Scuri G, Zhou Y,
749X Sung J, Watanabe K, Taniguchi T, Kim P, Park H and
Bo Peng https://orcid.org/0000-0001-6406-663X Lukin M D (arXiv:1912.07446)
Bartomeu Monserrat https://orcid.org/0000- [36] Carr S, Massatt D, Torrisi S B, Cazeaux P, Luskin M and
Kaxiras E 2018 Phys. Rev. B 98 224102
0002-4233-4071 [37] Wozniak T, Faria Junior P E, Seifert G, Chaves A and
Tobias Korn https://orcid.org/0000-0003-4808- Kunstmann J 2020 Phys. Rev. B 101 235408
391X [38] Enaldiev V V, Zolyomi V, Yelgel C, Magorrian S J and
Christian Schüller https://orcid.org/0000-0002- Fal’ko V I 2020 Phys. Rev. Lett. 124 206101
[39] Ferrari A and Basko D 2013 Nat. Nanotechnol. 8 235
6043-5263 [40] Zhang X, Qiao X F, Shi W, Wu J B, Jiang D S and Tan P H
2015 Chem. Soc. Rev. 44 2757
[41] Liang L, Zhang J, Sumpter B G, Tan Q H, Tan P H and
References Meunier V 2017 ACS Nano 11 11777
[42] Tan P H (ed) 2019 Raman Spectroscopy of Two-Dimensional
[1] Geim A K and Grigorieva I V 2013 Nature 499 419 Materials (Springer Series in Materials Science) (Singapore:
[2] Cao Y, Fatemi Y V, Fang S, Watanabe K, Taniguchi T, Springer Nature)
Kaxiras E and Jarillo-Herrero P 2018 Nature 556 43 [43] Lin M L et al 2018 ACS Nano 12 8770
[3] Koperski M, Molas M R, Arora A, Nogajewski K, [44] Lin K Q, Holler J, Bauer J M, Scheuck M, Peng B, Korn T,
Slobodeniuk A O, Faugeras C and Potemski M 2017 Bange S, Lupton J M and Schüller C 2020 (arXiv:2012.13820)
Nanophotonics 6 1289 [45] Liang L, Puretzky A A, Sumpter B G and Meunier V 2017
[4] Wang G, Chernikov A, Glazov M M, Heinz T F, Marie X, Nanoscale 40 15340
Amand T and Urbaszek B 2018 Rev. Mod. Phys. 90 21001 [46] Plechinger G, Heydrich S, Eroms J, Weiss D, Schüller C and
[5] Mak K F, Lee C, Hone J, Shan J and Heinz T F 2010 Phys. Korn T 2012 Appl. Phys. Lett. 101 101906
Rev. Lett. 105 136805 [47] Lui C H et al 2015 Phys. Rev. B 91 165403
82D Mater. 8 (2021) 035030 P Parzefall et al
[48] Puretzky A A, Liang L, Li X, Xiao K, Sumpter B G, [53] Castellanos-Gomez A, Buscema M, Molenaar R, Singh V,
Meunier V and Geohegan D B 2016 ACS Nano Janssen L, van der Zant H S J and Steele G A 2014 2D
10 2736 Materials 1 011002
[49] Lin M L, Zhou Y, Wu J B, Cong X, Liu X L, Zhang J, Li H, [54] Kim K et al 2016 Nano Lett. 16 1989
Yao W and Tan P H 2019 Nat. Commun. 10 2419 [55] Li Y, Rao Y, Mak K F, You Y, Wang S, Dean C R and
[50] Okada M et al 2018 ACS Nano 12 2498 Heinz T F 2013 Nano Lett. 13 3329
[51] Holler J, Meier S, Kempf M, Nagler P, Watanabe K, [56] Moon P and Koshino M 2013 Phys. Rev. B 87 205404
Taniguchi T, Korn T and Schüller C 2020 Appl. Phys. Lett. [57] Lamparski M, Van Troeye B and Meunier V 2020 2D
117 013104 Materials 7 025050
[52] Peng B, Zhang H, Shaob H, Xua Y, Zhanga X and Zhu H [58] Quan J et al 2021 Nat. Mater. (https://doi.org/
2016 RSC Adv. 6 5767 10.1038/s41563-021-00960-1)
9You can also read


