Adding to Fire Fighter Safety by Including Real-Time Radar Data in Short-Range Forecasts of Thunderstorm-Induced Wind Shifts
←
→
Page content transcription
If your browser does not render page correctly, please read the page content below
fire

Article
Adding to Fire Fighter Safety by Including Real-Time
Radar Data in Short-Range Forecasts of Thunderstorm-Induced
Wind Shifts
Gary L. Achtemeier † and Scott L. Goodrick *

                                          Center for Forest Disturbance Science, USDA Forest Service, Athens, GA 30602, USA; garyacht@gmail.com
                                          * Correspondence: scott.l.goodrick@usda.gov
                                          † Retired.

                                          Abstract: Abrupt changes in wind direction and speed caused by thunderstorm-generated gust fronts
                                          can, within a few seconds, transform slow-spreading low-intensity flanking fires into high-intensity
                                          head fires. Flame heights and spread rates can more than double. Fire mitigation strategies are
                                          challenged and the safety of fire crews is put at risk. We propose a class of numerical weather
                                          prediction models that incorporate real-time radar data and which can provide fire response units
                                          with images of accurate very short-range forecasts of gust front locations and intensities. Real-time
                                          weather radar data are coupled with a wind model that simulates density currents over complex
                                          terrain. Then two convective systems from formation and merger to gust front arrival at the location of
                                          a wildfire at Yarnell, Arizona, in 2013 are simulated. We present images of maps showing the progress
                                          of the gust fronts toward the fire. Such images can be transmitted to fire crews to assist decision-
                                          making. We conclude, therefore, that very short-range gust front prediction models that incorporate

                                   real-time radar data show promise as a means of predicting the critical weather information on gust
                                          front propagation for fire operations, and that such tools warrant further study.
Citation: Achtemeier, G.L.; Goodrick,
S.L. Adding to Fire Fighter Safety by
Including Real-Time Radar Data in
                                          Keywords: firefighter safety; fire weather; thunderstorms
Short-Range Forecasts of
Thunderstorm-Induced Wind Shifts.
Fire 2021, 4, 55. https://doi.org/
10.3390/fire4030055                       1. Introduction
                                                Thunderstorm-generated gust fronts can pose a threat to the safety of fire crews [1].
Academic Editor: Maryam Ghodrat           Sudden wind shifts have been implicated in a number of fire investigations over the years
                                          such as the Ransom Road Fire Report [2], the Dude Fire [3] and the Waldo Canyon Fire [4].
Received: 27 July 2021
                                          One particularly tragic event occurred in 2013 at Yarnell Hill, Arizona, when a wind shift
Accepted: 30 August 2021
                                          associated with thunderstorm outflows overran a wildfire changing its direction and rate
Published: 1 September 2021
                                          of spread. Nineteen firefighters were killed [5].
                                                Unless thunderstorm outflows are deep enough and/or close enough to be detected
Publisher’s Note: MDPI stays neutral
                                          by weather radars, they can travel for great distances unobserved. Some gust fronts can
with regard to jurisdictional claims in
                                          travel 50–100 km from source regions to arrive at burn sites without any visible signs of
published maps and institutional affil-
                                          impending changes in the weather. Thus, predicting the approach of thunderstorm-related
iations.
                                          gust fronts, the timing of arrival, and the magnitude of outflow winds at a particular fire
                                          site, which may be located over a limited area within complex terrain, poses a challenging
                                          problem for fire weather forecasters. This situation often leaves response units and public
                                          safety officials unaware of the evolution of the fire environment.
Copyright: © 2021 by the authors.
                                                Detailed morphologies of gust fronts in Colorado [6] and Arizona/New Mexico [7]
Licensee MDPI, Basel, Switzerland.
                                          revealed temperature breaks, wind shifts, and cold pool depths typical of thunderstorm
This article is an open access article
                                          climatology for the area. Although these studies added to our knowledge of the structure
distributed under the terms and
                                          and movement of gust fronts that occurred over complex terrain, the critical issue of
conditions of the Creative Commons
                                          accurate prediction of these events was not addressed.
Attribution (CC BY) license (https://
creativecommons.org/licenses/by/
                                                By using ensembles of high-resolution numerical weather prediction models, Powers
4.0/).
                                          et al. [8] reported significant progress on identifying and predicting locations of gust fronts.

Fire 2021, 4, 55. https://doi.org/10.3390/fire4030055                                                          https://www.mdpi.com/journal/fire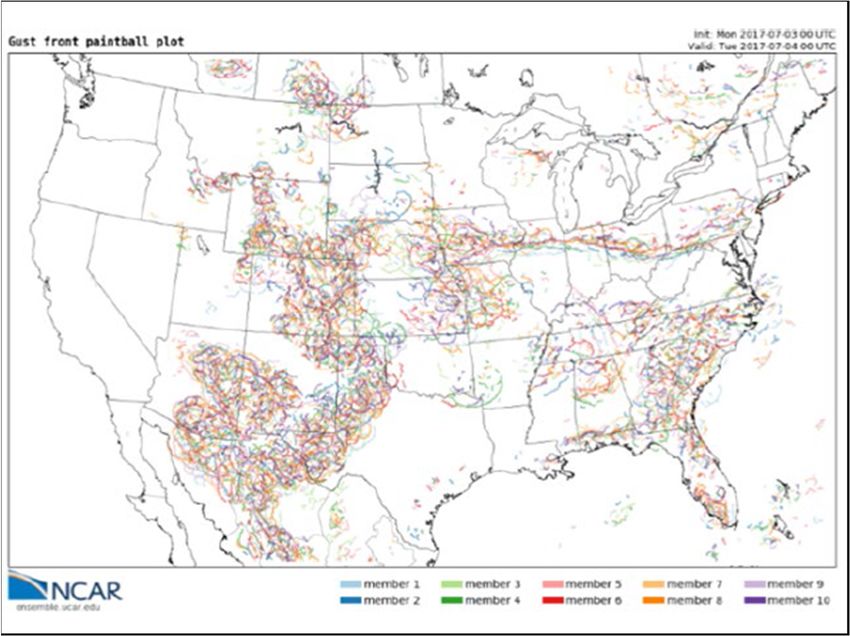
Fire 2021, 4, x FOR PEER REVIEW 2 of 13
Fire 2021, 4, 55 2 of 13
By using ensembles of high-resolution numerical weather prediction models, Powers
et al. [8] reported significant progress on identifying and predicting locations of gust
High-resolution refers to
fronts. High-resolution model
refers configurations
to model in which
configurations the model
in which horizontal
the model grid grid
horizontal spacing
isspacing
typically 4 km or less.
is typically 4 kmThese
or less.‘convection-permitting’
These ‘convection-permitting’ modelsmodels
can simulate thunderstorms,
can simulate thun-
or more likely,
derstorms, clusters
or more of thunderstorms,
likely, and their rainfall.
clusters of thunderstorms, and their Thunderstorm outflows and
rainfall. Thunderstorm
gust frontsand
outflows aregust
partfronts
of thearesolutions.
part of theAs solutions.
the authors Aspoint out, the
the authors difficulty
point out, theis difficulty
not so much
in
is the
not simulation
so much in of thethunderstorm
simulation of gust fronts butgust
thunderstorm in finding an objective
fronts but in findingmethodology
an objective to
methodology
identify them to identify
apart fromthemotherapart from other
disturbances indisturbances in the wind fields.
the wind fields.
Model variables
Model variables fromfrom which
which to toconstruct
constructan anobjective
objectivegust
gustfront
fronttool
toolwere
wereinvestigated.
investi-
gated.included
These These included model-simulated
model-simulated surface surface winds, temperature,
winds, temperature, relativerelative
humidity, humidity,
and poten-
and potential temperature. Model-derived or calculated fields such
tial temperature. Model-derived or calculated fields such as simulated radar reflectivity,as simulated radar
reflectivity, frontogenesis, planetary boundary layer height, temperature
frontogenesis, planetary boundary layer height, temperature advection, and moisture advection, and
moisture convergence were also considered. From these quantities,
convergence were also considered. From these quantities, the authors [8] determined thatthe authors [8] deter-
mined that frontogenesis,
frontogenesis, hourly vector hourly
wind vector wind difference,
difference, and horizontal
and horizontal potentialpotential
temperaturetemper-gradi-
ature gradient were most strongly related to gust fronts. An objective
ent were most strongly related to gust fronts. An objective gust front tool was developed gust front tool was
developed
with the aidwith
of thetheMultiple
aid of the Multiple Non-Maximum
Directional Directional Non-Maximum
SuppressionSuppression
method (MDNMS) method [9].
(MDNMS) [9].
Figure 1 shows gust front boundaries identified by the MDNMS algorithm with each
Figuremember
ensemble 1 shows agust front boundaries
different color. Theidentified by the
results are validMDNMS
for a 24 algorithm
h ensemble with each
forecast
ensemble member a different color. The results are valid for a 24 h ensemble
valid at 0000 UTC 4 July 2017. The ensemble gust front forecasts identified large areas forecast valid
at 0000 UTC 4 July 2017. The ensemble gust front forecasts identified large areas over the
over the contiguous United States where atmospheric conditions were favorable for deep
contiguous United States where atmospheric conditions were favorable for deep convec-
convection. However, not all models simulated gust fronts in the same place at the same
tion. However, not all models simulated gust fronts in the same place at the same time.
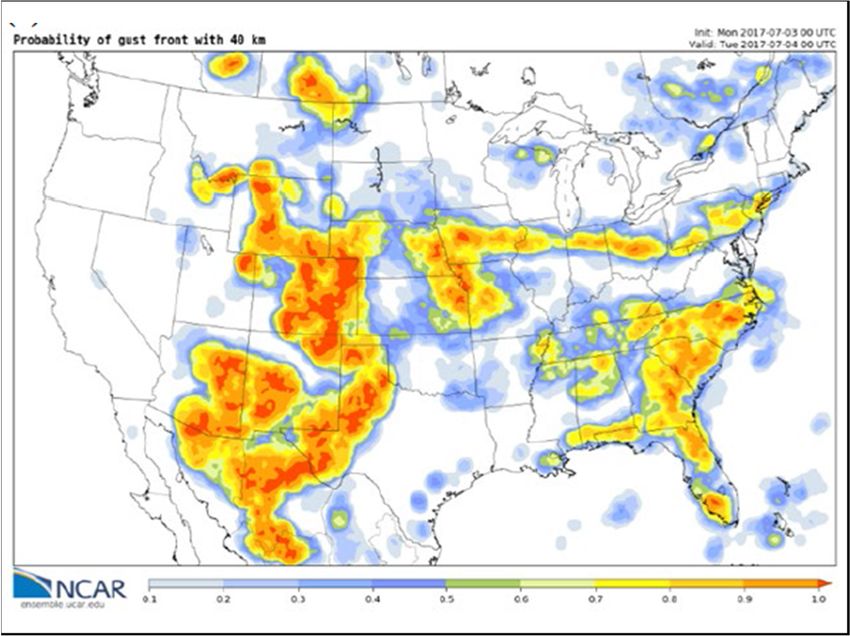
time. Thus, the results were converted into gust front probability forecasts as shown in
Thus, the results were converted into gust front probability forecasts as shown in Figure
Figure 2. These probabilities can assist fire weather forecasters in identifying which fire
2. These probabilities can assist fire weather forecasters in identifying which fire sites may
sites may be subject to the threat of gust fronts during the next 24 h. This information can
be subject to the threat of gust fronts during the next 24 h. This information can alert re-
alert response units and public safety officials to the potential danger from gust fronts.
sponse units and public safety officials to the potential danger from gust fronts.
Figure 1. Gust front boundaries identified by the MDNMS algorithm with each ensemble member
Figure 1. Gust front boundaries identified by the MDNMS algorithm with each ensemble member
a different color. The results are valid for a 24 h ensemble forecast valid at 0000 UTC 4 July 2017.
aFigure
different
fromcolor. TheFigure
[8] (their results6).are valid for a 24 h ensemble forecast valid at 0000 UTC 4 July 2017.
Figure from [8] (their Figure 6).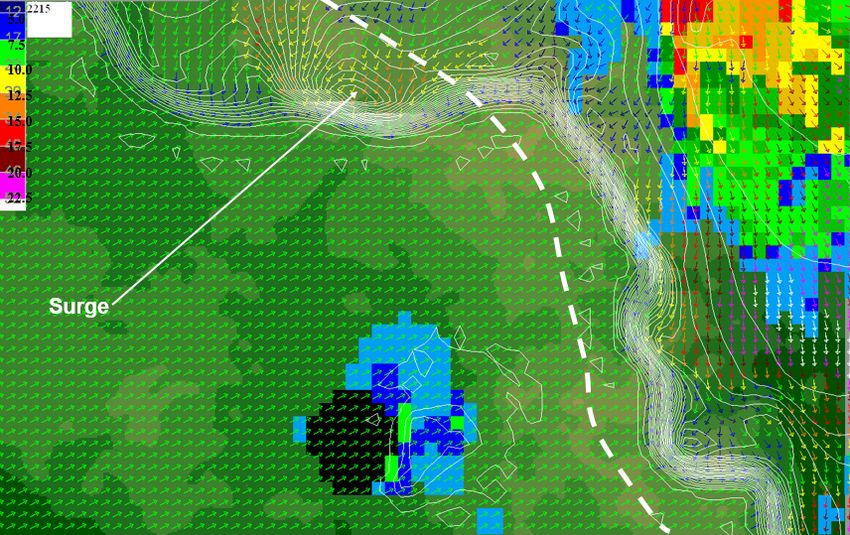
Fire 2021, 4, 55 3 of 13
Fire 2021, 4, x FOR PEER REVIEW 3 of 13
Figure2.
Figure 2. Probability
Probability of
of aa gust
gust front
frontwithin
within40
40km
kmofofa agiven
givenpoint.
point.Probabilities runrun
Probabilities from 0%0% (white)
from
(white) to 100% (red), color probability scale (0–1) at bottom. The results are valid for a 24 h en-
to 100% (red), color probability scale (0–1) at bottom. The results are valid for a 24 h ensemble forecast
semble forecast valid at 0000 UTC 4 July 2017. Figure from [8] (their Figure 6).
valid at 0000 UTC 4 July 2017. Figure from [8] (their Figure 6).
Although the
Although the results
results byby [8]
[8] represent
represent a a significant
significant advance
advance inin short-range
short-rangeforecasts
forecasts of
of the threat of gust fronts to fire response units, they also identify
the threat of gust fronts to fire response units, they also identify challenges and challenges andlimitations
limita-
tions inherent in high-resolution numerical weather models in predicting these events.
inherent in high-resolution numerical weather models in predicting these events. Not all
Not all models of the ensemble produced gust fronts. Furthermore, when ensemble mem-
models of the ensemble produced gust fronts. Furthermore, when ensemble members did
bers did simulate gust fronts, the placements could be a few tens of kilometers or more
simulate gust fronts, the placements could be a few tens of kilometers or more distant
distant relative to the simulation’s other ensemble members.
relative to the simulation’s other ensemble members.
In addition, though high-resolution numerical weather prediction models can accu-
In addition, though high-resolution numerical weather prediction models can accu-
rately locate regions with convective instability, these models will seldom place thunder-
rately locate regions with convective instability, these models will seldom place thunder-
storm cells at locations where they are observed because of the stochasticity of the for-
storm cells at locations where they are observed because of the stochasticity of the formation
mation process. Thus, though the probabilistic forecast can alert the fire weather forecaster
process. Thus, though
to the potential hazards theofprobabilistic
gust fronts over forecast can alert
fire sites, the fire weather
a deterministic forecaster
forecast needed by to the
potential hazards of gust fronts over fire sites, a deterministic forecast
response units of if, when, from what direction, and how strong a gust front will be, re- needed by response
units
mainsofelusive.
if, when, from what direction, and how strong a gust front will be, remains elusive.
We
Wepropose
propose that there exists
that there existsaaclass
classofofnumerical
numerical weather
weather prediction
prediction models
models thatthat
cancan
provide
provide fire response units with the gust front information they need. It is recognized thatthat
fire response units with the gust front information they need. It is recognized
the
theonly
only tool
tool that can provide
that can providethe thefire
fireweather
weatherforecaster
forecaster with
with thethe locations
locations andand intensities
intensities
of
of thunderstorm cells is the weather radar. We demonstrate this concept by couplingcoupling
thunderstorm cells is the weather radar. We demonstrate this concept by real-
real-time
time weather weather
radar radar
datadata
withwith a wind
a wind modelmodel to build
to build a numerical
a numerical weather
weather prediction
prediction
model
modelcapable
capable ofof very
very short-range
short-range forecasts (on (on the
the order
order of
ofan
anhour)
hour)ofofgust
gustfronts
frontsarriv-
arriving
at a fire site. In the sections to follow, a prototype model is described
ing at a fire site. In the sections to follow, a prototype model is described and demon- and demonstrated
with thewith
strated Yarnell Hill disaster
the Yarnell as a case
Hill disaster as study.
a case study.
2.2.Materials
Materials and Methods
and Methods
Materials
Materials and methods
methodsfor
forthe
thegust
gustfront
frontmodeling
modeling problem
problem areare partitioned
partitioned intointo
fourfour
parts—model
parts—model philosophy, the wind model, modeling real-time radar data, and case
the wind model, modeling real-time radar data, and case study.study.
2.1. Model Philosophy
All of the modeling issues involving the onset of convective instability in the atmo-
sphere and the release of the instability via thermodynamic and kinematic processes of
thunderstorm development are solved by the appearance of a thunderstorm cell on radar.
Regarding precipitation production, all physical processes that go on above cloud base are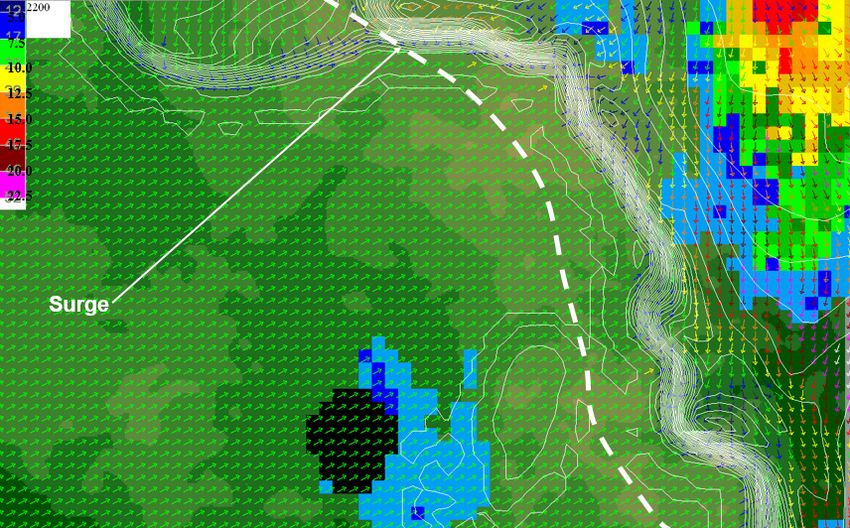
2.1. Model Philosophy
All of the modeling issues involving the onset of convective instability in the atmos-
Fire 2021, 4, 55 4 of 13
phere and the release of the instability via thermodynamic and kinematic processes of
thunderstorm development are solved by the appearance of a thunderstorm cell on radar.
Regarding precipitation production, all physical processes that go on above cloud base
are solved
solved by precipitation
by precipitation intensity
intensity as measured
as measured by radarby reflectivity.
radar reflectivity. Therefore,
Therefore, our ap-
our approach
proach does not involve numerical modeling of the growth
does not involve numerical modeling of the growth of thunderstorms. Thus, the modeling of thunderstorms. Thus, the
modeling
effort effort is to
is simplified simplified
modelingtojust modeling just the thunderstorm
the thunderstorm outflow and outflow and the subse-
the subsequent gust
quentThe
front. gust front. The thunderstorm
thunderstorm becomes a ‘black becomesbox’ athrough
‘black box’ through
the bottom ofthe
whichbottom
flowsofdown-
which
flowsairdowndraft
draft at a speedair andattemperature
a speed and specified
temperature specified
by the intensity byofthe intensity of precipitation.
precipitation. On reaching
On reaching the ground, this air piles up, creating a mound of cooled
the ground, this air piles up, creating a mound of cooled air below the cloud base. Pressure air below the cloud
base. Pressure gradients within the mound of cooled air, and
gradients within the mound of cooled air, and between the mound and the surrounding between the mound and the
surrounding
ambient ambient
air, drive air,
the air drive the
outward awayair from
outward away from
the source in thetheform source
of anin the form
outflow of an
or gust
outflow
front. Onlyor bulk
gust properties
front. Onlyofbulk the properties
outflow need of the outflow need be modeled.
be modeled.
Assummarized
As summarizedininFigure Figure3,3,thethethunderstorm
thunderstormisisenvisioned
envisionedasasaablack blackboxbox(irregular
(irregular
greyarea)
grey area)that
thatcommunicates
communicateswith withthe the ground
ground viavia a rain-cooled
a rain-cooled downdraft
downdraft that
that produces
produces a
cool outflow
a cool outflow (blue
(bluearea).
area).TheTheblack
black elliptical
elliptical lines
linesrepresent
representcontours
contoursofofthe theheight
heightofofthe
the
cool
cooldome
domeofofair airwhich
whichattains
attainstotomaximum
maximumdepth depthbeneath
beneaththe thestorm.
storm.TheThecontours
contourscancan
also
alsorepresent
representlineslinesofofconstant
constantpressure
pressureanomaly
anomalywhich whichalso alsoattain
attaintotoaamaximum
maximumbeneathbeneath
the
thestorm.
storm.As Asshown
shownby bythethearrows
arrowsrepresenting
representingwind winddirection
directionand andspeed,
speed,the theoutflow
outflow
expands
expandsoutward
outwardatatspeeds
speedsproportional
proportional to to
thethe
magnitude
magnitude of the pressure
of the pressuregradient driving
gradient driv-
the
ingwinds.
the winds. TheThestrongest
strongest pressure
pressuregradient
gradient usually
usually is at thethe
is at leading
leading edge
edgeofofthe
thestorm
storm
which
whichmoves
movesfrom fromleftlefttotoright
rightininthe
thediagram.
diagram.The Theboundary
boundarybetween betweenthe thecool
cooloutflow
outflow
and displaced warm air (red area) is a line of discontinuity (the gust
and displaced warm air (red area) is a line of discontinuity (the gust front) characterized front) characterized
by
byaatemperature
temperaturebreak, break,wind
windshift,
shift,andandchange
changeininwind windspeed.
speed.
Figure3.3.Schematic
Figure Schematicofofthe
thegust
gustfront
frontmodeling
modelingapproach.
approach.
2.2.
2.2.The
TheWind
WindModel
Model
WeWeextracted
extractedthe
thewind
windmodel
modelused usedininthisthisstudy
studyfrom
fromthe thesmoke
smoketransport
transportmodel
model
Planned Burn-Piedmont
Planned Burn-Piedmont (PB-P) (PB-P) [10], a local numerical meteorological model
local numerical meteorological model for trackingfor track-
ing smoke
smoke along
along thethe ground
ground at at night.
night. PB-P PB-P is an
is an operational
operational very-high-resolution
very-high-resolution semi-
semi-La-
Lagrangian numericalmodel
grangian numerical modeldesigned
designedfor for simulating
simulating bulk properties
properties of ofshallow
shallowdensity
density
currents
currentsasasthey
theymove
movethrough
through interlocking
interlocking ridge-valley terrain
ridge-valley typical
terrain of the
typical Piedmont
of the of
Piedmont
the
of Southern
the SouthernUnited States.
United The model
States. has been
The model has applied to other
been applied toareas
otherofareas
the United
of the States,
United
including ArizonaArizona
States, including [11] (p. 580).
[11] (p. 580).
For
For the lower boundarycondition,
the lower boundary condition,the themodel
modelisislinked
linkedtotothe
theU.S.
U.S.Geological
GeologicalSurvey’s
Survey’s
digital
digital elevation model (DEM) data set. The horizontal grid spacing isisset
elevation model (DEM) data set. The horizontal grid spacing setby
bythe
theuser
user
within the range 30 m (the minimum spacing of the DEM elevation data) to any choice that
is an integer multiple of 30 m. A detailed mathematical description of the wind model is
found in [10].
The wind model was modified to receive at any specified grid point a boundary layer
growth proportional to the flux of downdraft air from a thunderstorm. On finding a radar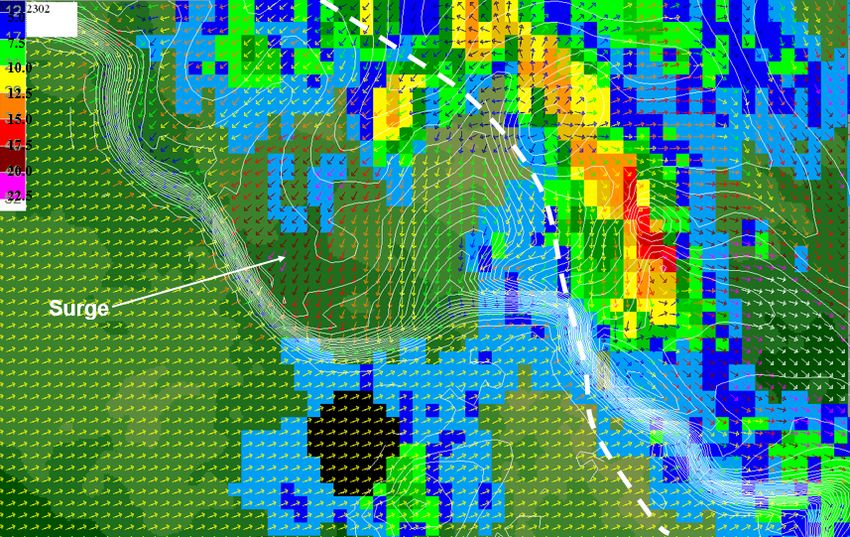
Fire 2021, 4, 55                                                                                                                         5 of 13

                                     echo value at a model grid point, the boundary layer growth per time step was calculated
                                     via an empirical equation,
                                                                         h1 = h0 + c1 wei ∆t                               (1)
                                     where the downdraft velocity at the base of the cloud, wei , is a function of the radar-detected
                                     precipitation echo intensity as shown in Table 1 and ∆t is the model time step (20 s). The
                                     coefficient, c1 , is a downdraft ‘efficiency weight’ intended to weight the downdraft velocity
                                     according to the potential for the ambient atmosphere to produce strong downdrafts.
                                     Estimates for the efficiency weight were not available to us in reference to case studies of
                                     past wildfire events. Therefore, we used c1 = 0.75 which was found to generate ‘reasonable’
                                     cold pool growth rates and gust front spread rates as modeled for thunderstorms at various
                                     locations east of the Rocky Mountains, especially for the southeastern United States.

                                              Table 1. Radar/Wind Model Conversion Factors.

  Intensity (dBZ)      10      15       20       25        30        35         40        45        50        55         60       65         70
    Echo Color         LB     DB       LG       MG        DG          Y        YO         O         R        MR         DR        M        P
    Wei (ms−1 )        0.0    0.0      0.2      0.4        1.0       1.4       2.0        2.5      3.5        5.0        6.0      7.0     8.0
   Cool Factor (C)    0.00    0.00     0.10     0.10      0.15      0.25       0.65      0.85      1.00      1.00       1.00     1.00    1.00
      Echo color: LB (light blue), DB (dark blue), LG (light green), MG (medium green), DG (dark green), Y (yellow), YO (yellow-orange), O
      (orange), R (red), MR (medium red), DR (dark red), M (magenta), P (purple).

                                         As thunderstorm outflows consist of rain-cooled air, the temperature of the air at the
                                     ground beneath the storm is represented by,

                                                                            T = Ta − C (Ta − Tad )                                            (2)

                                     where Ta is the ambient ground-level temperature at a location undisturbed by thunder-
                                     storm outflows and usually found several tens of kilometers to the south of precipitation.
                                     Tad is the ambient dew point temperature for the same location. The cooling coefficient, C,
                                     is related empirically to the radar echo intensity (dBZ) in Table 1. For very light precipita-
                                     tion, which may produce nothing to weak downdrafts, C = 0, meaning no cooling at the
                                     ground takes place. For intense storms with heavy precipitation, the cooling coefficient
                                     is C = 1.0, meaning ground-level temperatures are cooled to the dew point temperature.
                                     Both the depths of the outflow layer and its temperatures are factors in the amplitude of
                                     the pressure anomaly that drives the gust front (Figure 3).
                                           Once having formed, the outflow layer is subjected to slow warming as a function of
                                     the depth of the layer. The empirical equation for rate of temperature increase is,

                                                                  T = T0 + (Ta − T0 ) (hm /25h) (∆t/3600)                                     (3)

                                     where hm is the maximum depth (2000 m) permitted for the outflow layer and h > 0.
                                     Equation (3) permits the rate of temperature growth to increase as the depth of the outflow
                                     layer decreases. The function has little impact on gust front spread during the early stages
                                     of the outflow. However, over several hours as the outflow layer subsides, heating can
                                     slow gust fronts by decreasing the internal pressure gradients that drive them.
                                          PB-P was designed to simulate wind direction and speed under near calm conditions
                                     at night over complex terrain. Measurements of wind variables under these conditions
                                     are often unreliable. Therefore, the wind field is driven by the pressure field. In our
                                     prototype gust front model, wind direction and speed are supplied by a single weather
                                     station deemed ‘representative’ of the ambient conditions near local convective systems.
                                     The wind data are converted to a pressure gradient field that drives the observed wind.

                                     2.3. Real-Time Radar Data
                                          The U.S. Weather Service routinely supplies national radar data in graphical map form
                                     to the public at intervals of from 5 to 10 min. These maps show locations and intensities of
                                     precipitation systems. Each pixel in the radar image represents an area of approximately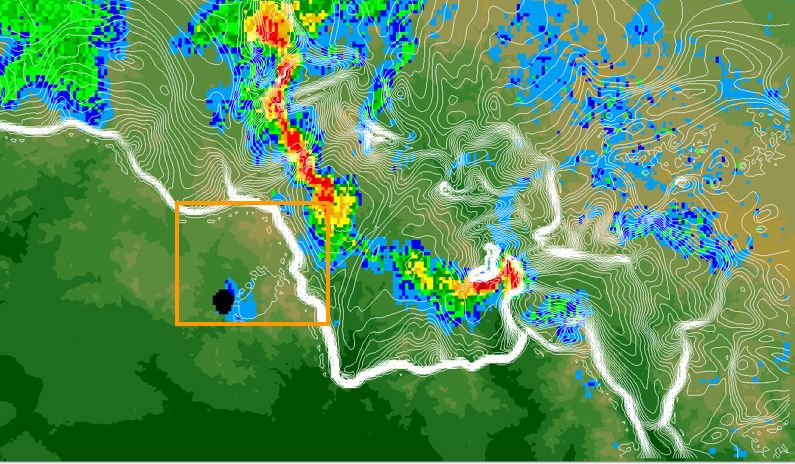
Fire 2021, 4, 55                                                                                             6 of 13

                    one square kilometer. We set the grid space for the prototype gust front model to 900 m
                    and interpolated the radar data into the model grid. The model then moves the radar data
                    through the grid at the reported speed and direction of the storm.
                          Precipitation intensities are depicted through a color-coded reference to the energies
                    returned to the radar relative to a reference energy (Z). The non-dimensional ratio is
                    expressed in decibels relative to Z (dBZ). The ratio for most weather precipitation systems
                    ranges from 10–70 dBZ.
                          This relationship between color and energy returned to the radar is shown in the first
                    two lines of Table 1. Regarding the color codes, the ‘blues’ represent very light precipitation
                   which most likely does not reach the ground; the ‘greens’ represent light rainfall; yellow
                    represents light to moderate rainfall; yellow-orange represents moderate rainfall; red and
                    moderate red represent heavy rainfall; and dark red represents very heavy (torrential)
                    rainfall. Magenta and purple represent hail.
                          The model decodes the colors and converts them into cloud base downdraft velocities
                    as is shown on the third line of Table 1. These downdrafts are transported over the grid
                    according to the reported speed and direction of the radar-observed precipitation systems.
                          Regarding validation, the prototype gust front model has been run on numerous
                    occasions for precipitation systems ranging from single thunderstorm cells to clusters of
                    storms to squall lines to mesoscale convective systems. Coefficients in the above equations
                    have been ‘tuned’ in accordance with how well the model predicted the timing and wind
                    speed of gust front passages as observed at weather stations in the path of storms and as
                   ‘clear-air echoes’ when gust fronts passed near weather radars.

                   2.4. Case Study
                        On 30 June 2013, a gust front generated by two clusters of thunderstorms over complex
                   terrain of central Arizona produced a sudden 90 degree wind shift over a wildfire near
                   Yarnell Hill [5]. The changes in fire intensity and spread rate caused the fire to explode,
                   overtake, and trap a fire crew. Nineteen firefighters were killed. Interactions between
                   complex terrain, thunderstorm development and propagation, and channeled outflows
                   caused the gust front to approach the fire site from the north, a direction from which the
                   weather did not appear to be threatening.
                        The prototype gust front model was set up with terrain data from the USGS DEM
                   elevation data set at the 900 m grid spacing. Digital radar data from the Flagstaff, AZ,
                   weather radar were converted to the standard color-coded form and input to the model. The
                   model was initialized with temperature, relative humidity, and wind speed and direction
                   data from Peeples Valley (1209–1509 local standard time (LST)) about 6 km north of Yarnell
                   and then from Phoenix (1509–1709 LST) about 115 km to the southeast.
                        Additional information pertinent to this study from [5] made note of a weather update
                   at 1526 LST warning of the approach of a gust front that could turn the winds to blow
                   from the north or northeast with a velocity range around 20 ms−1 . Shortly thereafter, at
                   approximately 1530 LST, the wind shifted from blowing from the southwest to blowing
                   from the northwest. The wildfire turned toward the town of Yarnell. Our weather data
                   from Peeples Valley ended at 1509 LST and the wind shift did not appear in the weather
                   data from Phoenix. The event was not considered as the passage of a gust front and it
                   is possible that the wind shift occurred in response to a pressure-induced indraft into
                   developing strong storms over the valley east of Yarnell.
                        The gust front reached the north perimeter of the fire at 1618 LST 30 June and the
                   south perimeter at 1630 LST. We infer from this observation that the gust front was moving
                   south and driven by winds blowing from the north or north-northeast. It is noteworthy
                   that observers at the south perimeter of the fire reported winds blowing from the east and
                   northeast at speeds estimated at 50 mph (22.4 ms−1 ).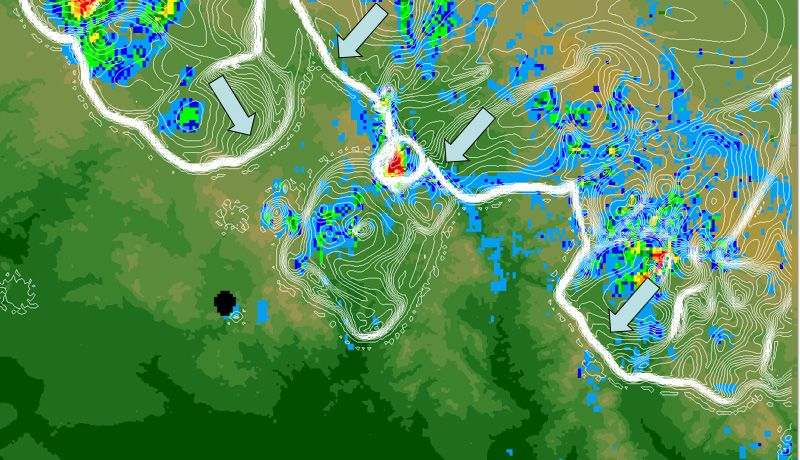
possible that the wind shift occurred in response to a pressure-induced indraft into devel-
oping strong storms over the valley east of Yarnell.
The gust front reached the north perimeter of the fire at 1618 LST 30 June and the
Fire 2021, 4, 55 south perimeter at 1630 LST. We infer from this observation that the gust front was mov- 7 of 13
ing south and driven by winds blowing from the north or north-northeast. It is notewor-
thy that observers at the south perimeter of the fire reported winds blowing from the east
and northeast at speeds estimated at 50 mph (22.4 ms−1).
3. Results
3. Results
Figure 4 shows the approximately 290 × 160 km area surrounding the events of
Figure
30 June 2013.4 The
shows the approximately
Flagstaff 290 ×150
radar is located 160km
kmtoarea
the surrounding
east-northeasttheofevents of 30
Yarnell.
June 2013. The Flagstaff radar is located 150 km to the east-northeast of Yarnell.
Figure 4. Highlighted features of the gust front model-generated elevation map.
Figure 4. Highlighted features of the gust front model-generated elevation map.
Elevations rise from 550 m (dark green) at the desert floor south of Yarnell to 2300 m
Elevations rise from 550 m (dark green) at the desert floor south of Yarnell to 2300 m
(tan) at the Mogollon Rim escarpment (dashed line) which runs diagonally along the up-
(tan) at the Mogollon Rim escarpment (dashed line) which runs diagonally along the upper
per right of the figure. Initial thunderstorm development occurred along the Mogollon
right
Rim andof the figure.
over highInitial
groundthunderstorm development
(circle) located approximately occurred90 km along the Mogollon from
north-northwest Rim and
over
Yarnell. Also factors in the results are two lesser mountain ranges (dashed lines) locatedAlso
high ground (circle) located approximately 90 km north-northwest from Yarnell.
factors
between in Yarnell
the resultsandarethetwo lesser mountain
Mogollon ranges (dashed
Rim at distances of 30 km lines)
and located between Yarnell
80 km respectively.
and the Mogollon Rim at distances of 30 km and 80 km
These mountain ranges rise approximately 500–1000 m above the adjacent valley floors. respectively. These mountain
ranges rise approximately 500–1000 m above the adjacent valley
Winds at Yarnell blew from the southwest for much of the day. Aloft, winds blew floors.
fromWinds at Yarnell(060
the northeast blewdegrees
from the at southwest
6.7 ms−1) whichfor much of thestorms
steered day. Aloft, winds
forming blew
over thefrom
the northeast (060 degrees at 6.7 ms −1 ) which steered storms forming over the Mogollon
Mogollon Rim southwestward (arrow). Thus, the bulk of outflows generated by these
Rim
stormssouthwestward
initially fell on(arrow). Thus, the bulk
southwest-facing slopesofwhich
outflows generated
accelerated gustbyfronts
thesetoward
storms Yar-initially
fell
nell.on southwest-facing slopes which accelerated gust fronts toward Yarnell.
The gust front model
gust front modelplots
plotsthetheradar
radardatadata over
over thethe elevation
elevation map map of Figure
of Figure 4. Of4. the
Of the
model-generated parameters,the
model-generated parameters, thetemperature
temperature field
field best
best identifies
identifies gustgust front
front boundaries
boundaries
over
over this large area. On
large area. Onviewing
viewingmaps mapssuch such asas shown
shown forfor
12311231LSTLST in Figure
in Figure 5, the
5, the fire fire
weather
weather forecaster mightsee
forecaster might seethe
theevolution
evolutionofof temperature
temperature breaks
breaks identifying
identifying the the location
location
of gust
of gust fronts. Over Over the
theMogollon
MogollonRim, Rim,multiple
multiple thunderstorms
thunderstorms werewereorganizing
organizing intointo
a a
mesoscale convective
mesoscale convectivesystem.system. Elsewhere,
Elsewhere, a smaller cluster
a smaller of storms
cluster had produced
of storms an out- an
had produced
flow overover
outflow the high ground
the high northnorth
ground of Yarnell. SeveralSeveral
of Yarnell. isolatedisolated
showers,showers,
destined to be short-
destined to be
lived, formed over the mountain ranges northeast of Yarnell.
short-lived, formed over the mountain ranges northeast of Yarnell. The darkened The darkened black circle
black
identifies
circle the wildfire
identifies smokesmoke
the wildfire plume plume
as observed at 2400 m
as observed at by
2400themFlagstaff radar. radar.
by the Flagstaff
By 1335 LST (Figure 6), outflows from the mesoscale
By 1335 LST (Figure 6), outflows from the mesoscale convective system convective system pushing
pushing off off
the Mogollon
the Mogollon Rim Rim had
hadmerged
mergedinto intoa asingle
singleboundary
boundary advancing
advancing toward
towardthethesouthwest
southwest
(arrows). The
(arrows). Thegustgustfront
fronthadhadadvanced
advancedapproximately
approximately 50 50kmkm to the ridge
to the ridgeof the firstfirst
of the
mountain range southwest of the Mogollon Rim. A new strong storm had formed at the
ridge. Meanwhile, temperature breaks identifying gust fronts from outflows from the
storms that organized over high ground northwest of Yarnell were pushing southeastward
toward lower elevations in the valley running from the north to the east beyond the
mountain range east of Yarnell.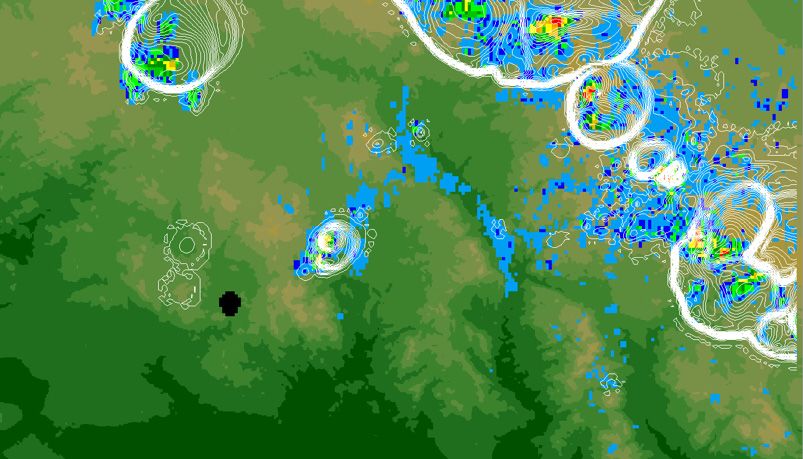
Fire 2021, 4, x FOR PEER REVIEW 8 of 13
mountain range southwest of the Mogollon Rim. A new strong storm had formed at the
mountain range southwest of the Mogollon Rim. A new strong storm had formed at the
ridge. Meanwhile,
ridge. Meanwhile, temperature
temperaturebreaks
breaksidentifying
identifyinggust
gustfronts
frontsfrom
from outflows
outflows from
from thethe
Fire 2021, 4, 55 8 of 13
storms that organized over high ground northwest of Yarnell were pushing
storms that organized over high ground northwest of Yarnell were pushing southeast- southeast-
ward toward
ward toward lower
lowerelevations
elevationsininthe
thevalley
valleyrunning
runningfrom
from the
the north
north to to
thethe east
east beyond
beyond thethe
mountain range east of Yarnell.
mountain range east of Yarnell.
Figure
Figure5.5.
Figure Valid
5.Valid
Validatat 1231
at1231 LST.
1231LST. Gust
Gustfront
LST.Gust frontmodel
front modelelevation
model elevation
elevation map
map
map overlain
overlainby
overlainby
byradar
radar echoes
radar (multi-col-
echoes
echoes (multi-colored
(multi-col-
ored
pixels)pixels) and temperature
and temperature contours
contours (white
(white(white lines) identifying
lines) identifying locations
locations of
of gustof gust fronts.
fronts. The The loca- of the
location
ored pixels) and temperature contours lines) identifying locations gust fronts. The loca-
tion of the smoke plume from the Yarnell Hill fire as observed by radar is given by the blackened
tion ofplume
smoke the smoke
fromplume from Hill
the Yarnell the Yarnell Hill fire asbyobserved
fire as observed radar is by radar
given by isthe
given by the blackened
blackened circle.
circle.
circle.
Figure6.6. Same
Figure Same as for Figure
as for Figure 55but
butvalid
validfor
for1335
1335LST.
LST.
Figure 6. Same as for Figure 5 but valid for 1335 LST.
Figure
Figure77showsshowsthe thesituation
situationatat1500
1500LST. The
LST. temperature
The temperature breaks
breaksalong thethe
along gust fronts
gust
from the
fronts two
from theconvective
two systems
convective had
systems merged
had into
merged a single
into a line.
single The
line.
Figure 7 shows the situation at 1500 LST. The temperature breaks along the gust cluster
The of
cluster storms
of storms over
high
over ground
frontshigh
from north
ground
the two of Yarnell
north were
of Yarnell
convective dissipating,
were had
systems the outflow
dissipating,
mergedthe dome
intooutflow had
a singledome subsided
hadcluster
line. The and
subsided warmed
and
of storms
slightly,
warmed
over highand the gust
slightly,
ground and
northfront
the of
gusthad slowed
front
Yarnell had down.
wereslowed The Mogollon
down.
dissipating, Theoutflow
the Rimdome
Mogollon convective
Rimhad
convectivesystem
subsided had
sys-and
evolved
tem into
had evolved
warmed a solid
slightly,into line
andathe of
solid strong
linefront
gust storms
of strong (colored red)
storms (colored
had slowed down. The located
red) over the
located over
Mogollon full
Rimthe length of
full length
convective the
sys-
valley beyond the mountain range east of Yarnell. The gust front had progressed
tem had evolved into a solid line of strong storms (colored red) located over the full length well up
the eastern slopes of these mountains.
By 1500 LST, it was clear that the Yarnell area was threatened by strong wind shifts
should the outflow top the mountains just to the east. To get a clearer perspective of the
events that occurred at Yarnell during the following 90 min, the remainder of the simulation
will focus on the 40 × 60 km area within the orange box in Figure 7.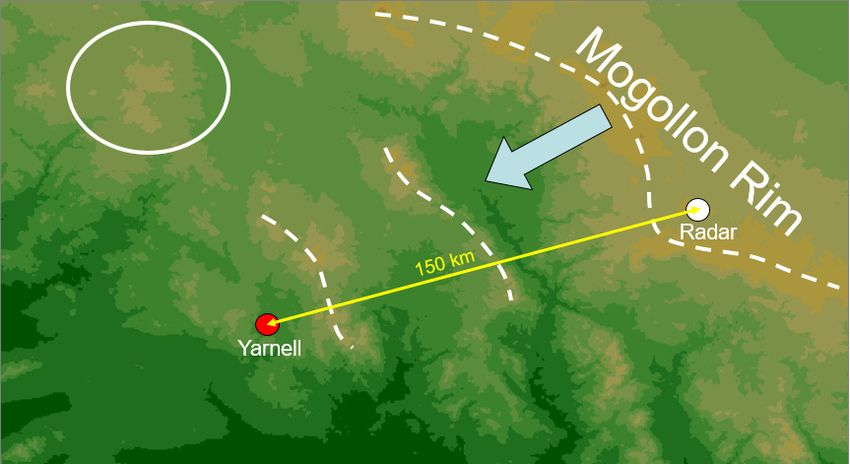
well up the eastern slopes of these mountains.
By 1500 LST, it was clear that the Yarnell area was threatened by strong wind shif
of the valley beyond the mountain range east of Yarnell. The gust front had progressed
should the outflow top the mountains just to the east. To get a clearer perspective of th
well up the eastern slopes of these mountains.
events that occurred at Yarnell during the following 90 min, the remainder of the simul
By 1500 LST, it was clear that the Yarnell area was threatened by strong wind shifts
Fire 2021, 4, 55 tion will
should thefocus on the
outflow top 40
the×mountains
60 km area within
just to the the
east.orange
To get box in Figure
a clearer 7. 9of
perspective
of 13
the
events that occurred at Yarnell during the following 90 min, the remainder of the simula-
tion will focus on the 40 × 60 km area within the orange box in Figure 7.
Figure 7. Same as for Figure 5 but valid for 1500 LST.
Figure7.7.Same
Figure Sameasasfor
forFigure
Figure5 5but
butvalid
validfor
for1500
1500LST.
LST.
Figure 8shows
Figure shows
Figure8 8shows
a close-up the
a aclose-up
close-upofofthe
ofmountain
the mountain
mountainrange
range
rangenortheast
northeast of Yarnell.
northeastofofYarnell.
Yarnell.The
The mountai
Themountain
mountain
range
range consists
rangeconsists ofofof
consists three
three
three areasareas
areas of high
ofofhigh
high ground
ground
ground connected
connected
connected by byelevation
bylower
lowerlower elevation
elevation gaps gaps (arrows
gaps(arrows),
(arrows),
one
one 30 km
30 kmnorth
northand the
and other
the 17
other km17east
km of Yarnell.
east of The
Yarnell.black
The circle
black is the smoke
circle
one 30 km north and the other 17 km east of Yarnell. The black circle is the smoke plume is plume
the smoke plum
from
from the Yarnell
theYarnell Hill
YarnellHill fire
Hill as observed
fire by the Flagstaff radar.
from the fire as as observed
observed by Flagstaff
by the the Flagstaff
radar.radar.
Figure 8. The 40 × 60 km area enclosed by the orange box in Figure 7. Shaded elevation data pro-
duced by the gust front model. The mountain range is identified by a dashed line with lower ele-
Figure 8.The
vation8.gaps
Figure The 4040××60
60by
identified kmarrows.
km areaenclosed
area enclosedbybythe
theorange
Radar-observed orange
smoke boxin in
plume
box ofFigure
7. 7. Shaded
the Yarnell
Figure fireelevation
Hill elevation
Shaded bydata pro-
showndata
duced
the by
black the gust
circle. front model. The mountain range is identified by a dashed line
produced by the gust front model. The mountain range is identified by a dashed line with lower with lower ele-
vation gaps
elevation gaps identified byarrows.
identified by arrows. Radar-observed
Radar-observed smoke
smoke plume
plume of theof the Yarnell
Yarnell Hill fireHill fireby
shown shown by
the Weather
black conditions for the local area surrounding Yarnell at 1500 LST are shown in
circle.
the black circle.
Figure 9. Winds at the fire site were blowing from the southwest at approximately 8 ms−1
(Green arrows).
Weather
Weather The weakening
conditions
conditions for the and
for local
the slowing
local
area area gust front
surrounding
surrounding fromYarnell
Yarnell the1500
at dissipating
at 1500
LST convective
LST are
are shown inshown i
Figure 9. Winds at the fire site were blowing from the southwest at approximately 8 ms −1
Figure 9. Winds at the fire site were blowing from the southwest at approximately 8 ms
(Green
(Greenarrows). TheThe
arrows). weakening
weakening and and
slowing gust front
slowing gustfrom
frontthe dissipating
from convective
the dissipating convectiv
system over high ground north of Yarnell was pushing south at approximately 8 ms−1 .
However, the temperature breaks reveal that the intense thunderstorms northeast of Yarnell
had produced an outflow ‘surge’ toward the gap in the mountain range there. By 1515 LST
(Figure 10), the surge had crossed the gap and, being partially blocked by the gust frontFire 2021, 4, x FOR PEER REVIEW 10 of 13
Fire 2021, 4, x FOR PEER REVIEW 10 of 13
Fire 2021, 4, 55 10 of 13
system over high ground north of Yarnell was pushing south at approximately 8 ms−1−1.
system over high ground north of Yarnell was pushing south at approximately 8 ms .
However, the temperature breaks reveal that the intense thunderstorms northeast of Yar-
However, the temperature breaks reveal that the intense thunderstorms northeast of Yar-
nell had produced an outflow ‘surge’ toward the gap in the mountain range there. By 1515
nell had produced an outflow ‘surge’ toward the gap in the mountain range there. By 1515
LST (Figure
from the storm10),cluster
the surge
northhad crossed had
of Yarnell, the gap and,southward
turned being partially blocked
toward by By
Yarnell. the1600
gustLST
LST (Figure 10), the surge had crossed the gap and, being partially blocked by the gust
front from
(Figure 11), the
the storm
surge cluster north ofand
had expanded Yarnell, hadfront
its gust turnedwassouthward toward
being driven Yarnell.
toward By
the Yarnell
front from the storm cluster north−of Yarnell, had turned southward toward Yarnell. By
1 (dark
1600fire
Hill LSTby(Figure
winds11), the surge
of almost 20 had
ms expanded redand its gust
wind front was being driven toward
vectors).
1600 LST (Figure 11), the surge had expanded and its gust front was being driven toward
the Yarnell Hill fire by winds of almost 20 ms−1−1(dark red wind vectors).
the Yarnell Hill fire by winds of almost 20 ms (dark red wind vectors).
Figure Gustfront
Figure 9. Gust front model
model derived
derived windwind
fieldfield and temperature
and temperature breaks breaks
showing showing
locationslocations
and di- and
Figure 9.
rections ofGust front model
movement of gustderived
fronts windYarnell,
near field and
AZtemperature
at 1500 LST.breaks showing
WindWind
directionslocations
are shownandby
di-
directions of movement of gust fronts near Yarnell, AZ at 1500 LST. directions are shown by
rections
thearrows of movement
arrows and
and relativeof gust
relative speeds fronts near Yarnell, AZ at 1500 LST. Wind directions are shown by
the speedsindicated
indicatedbybyarrow
arrowcolors.
colors.
the arrows and relative speeds indicated by arrow colors.
Figure 10. Same as for Figure 9 but valid for 1515 LST.
Figure 10.Same
Figure10. Sameas
as for
for Figure
Figure 9 but valid
valid for
for1515
1515LST.
LST.Fire 2021, 4, 55 11 of 13
Fire 2021, 4, x FOR PEER REVIEW 11 of 13
Figure 11. Same
Figure11. Same as for Figure
Figure 99 but
butvalid
validfor
for1600
1600LST.
LST.
4.4.Discussion
Discussion
Through
Through aa prototype
prototypegust gust front
front model,
model, we have
we have demonstrated
demonstrated thatexists
that there therea class
exists a
class of numerical weather prediction models that, by incorporating
of numerical weather prediction models that, by incorporating real-time radar data, can real-time radar data,
can
produce accurate deterministic very short-range gust front forecasts in the range of 30–60 of
produce accurate deterministic very short-range gust front forecasts in the range
30–60
min. Themin.fated
Thefirefated
crewfire crew received
received a weatheraupdate
weather update
at 1526 LSTatwarning
1526 LST warning
of the approach of the
approach of a gust
of a gust front that front
couldthat turncould turn the
the winds winds
to blow to blow
from fromorthe
the north north orwith
northeast northeast
a veloc- with
aity
velocity range around −1 [5] (p. 34). The period of time from when the modeled
range around 20 ms−1 20 [5]ms(p. 34). The period of time from when the modeled outflow
outflow surge crossed
surge crossed the gap in thethe gap in the mountain
mountain range northeast
range northeast of Yarnell ofandYarnell
turnedand southturned
toward south
toward
the fire the
andfire and itsatarrival
its arrival the fire atsite
thewasfire 60
sitemin.
wasThe60 min. The simulation
simulation showed theshowed gust front theasgust
front
having as having
arrived arrived at theside
at the north north sideradar-observed
of the of the radar-observed
smoke plumesmokeatplume1615 LST. at 1615
ThisLST.
This compares
compares withwith the observed
the observed time of timegustoffront
gust arrival
front arrival at the northern
at the northern perimeter perimeter
of the fireof the
being
fire being1618 LST,LST,
1618 a difference
a difference of 3 ofmin.3 min.
Themodeled
The modeledgust gustfront
frontarrived
arrivedatatthe thesouthern
southernperimeter
perimeterof ofthe
thefire
fireatatabout
about1635 1635LST
LST (observed arrival at 1630 LST) following a series of events that
(observed arrival at 1630 LST) following a series of events that complicated the wind field. complicated the wind
field.
The The outflow
outflow from the from the strong
strong stormsstormslocatedlocated
east ofeast of Yarnell
Yarnell had surged
had surged throughthrough the
the second
second gap in the mountain range shown in Figure 8 by 1616
gap in the mountain range shown in Figure 8 by 1616 LST and by 1630 LST, had topped the LST and by 1630 LST, had
topped
entire the entirerange
mountain mountain
setting range
up asetting
powerful up agust
powerful gustdrove
front that front that drove southwest-
southwestward through
ward
the firethrough
site with the fire site
winds from with the winds from the east-northeast
east-northeast of approximately 20 ms−1 . 20 ms−1.
of approximately
Theofficial
The official report
report [5][5] (p.
(p. 43)
43)of ofthe
theYarnell
YarnellHillHillaccident
accident report
reportmade
made note
noteof the fated
of the fated
firecrew
fire crewpossibly
possibly having
having been been confused
confusedwhen whenthe theambient
ambient winds
winds at at
thethefirefire
sitesite
shifted
shifted
fromblowing
from blowing fromfrom the
the southwest
southwesttotoblowing blowingfrom fromthe thenorthwest
northwest at at
around
around 15301530LST. If If
LST.
the fire crew would have had visual access to weather
the fire crew would have had visual access to weather maps such as produced in thismaps such as produced in this
study,would
study, woulditit have
have been
been likely
likely that
thatthe thereal
realhazard
hazardapproaching
approaching thethe
burnburnsitesite
wouldwould be be
noted and appropriate action taken to move the fire crew to a safer location? We pose this
noted and appropriate action taken to move the fire crew to a safer location? We pose this
sentence as a question because we know that the technology to visually access the weather
sentence as a question because we know that the technology to visually access the weather
maps was not available to field personnel in 2013, but today it likely is. Thus, we view our
maps was not available to field personnel in 2013, but today it likely is. Thus, we view our
question not as a criticism of decisions made in the past, but as adding to fire fighter safety
question not as a criticism of decisions made in the past, but as adding to fire fighter safety
in the future.
in the future.
This successful modeling effort has raised additional questions regarding modeling
This successful modeling effort has raised additional questions regarding modeling
gust fronts in complex terrain. Can the grid resolution be reduced to the scale of the local
gust fronts in complex terrain. Can the grid resolution be reduced to the scale of the local
terrain of the burn site and can the model incorporate wildland fire dynamics into the gust
terrain of thefield?
front wind burn In siteSection
and can 2.2,thewemodel
notedincorporate wildland
that the smallest gridfire dynamics
resolution of into the gust
the wind
front wind field? In Section 2.2, we noted that the smallest grid resolution of the wind
model was 30 m, the minimum range of the U.S. Geological Survey DEM elevation data.Fire 2021, 4, 55 12 of 13
Thus, the grid resolution can be reduced but at computational cost. Each halving of the
grid spacing involves an increase of the computational load by a factor of eight.
The problem of computational load raises the additional issue of processing time.
Convection-permitting numerical weather models require great computer power and some
simulations do not run in real time. For the simulations done in this study, we chose the
grid resolution of 900 m to closely match with the 1 km resolution of the radar data. The
processing time was five to one, meaning that a 15 min simulation could be completed
within 3 min of real time on a standard desktop PC.
We have presented a prototype gust front prediction model. Other agencies are not
required to use the models we used nor are they as limited in access to computer resources
and personnel. The success of any models depends on the availability of the required
input datasets. The contiguous United States is covered by a network of weather radars.
Few gaps in radar data exist. However, adequate radar data may not be available to fire
response units elsewhere. In those instances, the modeling concept we have described
cannot be used.
5. Conclusions
We conclude, therefore, that very short-range gust front prediction models that in-
corporate real-time radar data show promise as a means of predicting the critical weather
information on gust front propagation for fire operations, and that such tools warrant
further study. The radar data represent ground-truth measurements of locations and in-
tensities of convective storms; and it should therefore be expected that predictions of the
locations and severities of gust fronts produced by these storms should be improved over
the results of numerical weather prediction models that develop and locate thunderstorms
through internal model dynamics.
One reviewer requested to know why the prototype gust front model we have pre-
sented in this article has not been developed into an operational model. Some of the
weaknesses of the prototype model, such as the lack of an objectively-derived downdraft
efficiency weight as defined in Section 2.2 can be addressed with better meteorological data.
The major problem we face is in acquiring and georeferencing radar data with elevation
data. For our case study of the Yarnell disaster, we had access to digitized historical radar
data. For the operational present, the National Weather Service has changed the format
for presenting graphical radar data to the public. The gain is that the radar data can be
displayed on a local, regional, or national scale. The loss is we have not yet developed
a means to georeference the graphical radar data with elevation data. Furthermore, we
must screensave the radar image and manually transfer it to the model. Thus, under these
constraints, the gust front model is run in real time on occasion but only for areas of the
country where complex terrain is not a factor in gust front evolution.
We presume that some agencies such as universities and government have access
to real-time radar data in formats no longer available to us and that these agencies have
computational facilities and model development manpower needed to incorporate real-
time radar data into gust front models.
Author Contributions: Conceptualization, G.L.A. and S.L.G.; methodology, G.L.A.; software, G.L.A.;
investigation, G.L.A.; writing—original draft preparation, G.L.A.; writing—review and editing,
G.L.A. and S.L.G.; visualization, G.L.A.; supervision, S.L.G. All authors have read and agreed to the
published version of the manuscript.
Funding: This research received no external funding.
Data Availability Statement: Publicly available datasets were analyzed in this study. This data can
be found here, https://gis.ncdc.noaa.gov/maps/ncei/radar (accessed on 31 August 2021).
Conflicts of Interest: The authors declare no conflict of interest.Fire 2021, 4, 55 13 of 13
References
1. Potter, B.E.; Hernandez, J.R. Downdraft outflows: Climatological potential to influence fire behavior. Int. J. Wildland Fire 2017, 26,
685–692. [CrossRef]
2. Goens, D.W.; Andrews, P.L. Weather and fire behavior factors related to the 1990 Dude Fire near Payson, Arizona. In Proceedings
of the 2nd Conference on Fire and Forest Meteorology, Phoenix, AZ, USA, 11–16 January 1998; American Meteorological Society:
Boston, MA, USA, 1998; pp. 153–158.
3. Surveys and Investigation Staff. A Report to the Committee on Appropriations US House of Representatives on Wildfire on
Merritt Island. 1981. Available online: https://www.wildfirelessons.net/HigherLogic/System/DownloadDocumentFile.ashx?
DocumentFileKey=de70dc82-1760-487f-b1d4-05a8d11293cc&forceDialog=0 (accessed on 31 August 2021).
4. Johnson, R.H.; Schumacher, R.S.; Ruppert, J.H., Jr.; Lindsey, D.T.; Ruthford, J.E.; Kriederman, L. The role of convective outflow in
the Waldo Canyon Fire. Mon. Weather Rev. 2017, 142, 3061–3080. [CrossRef]
5. Karels, J.; Dudley, M. Yarnell Hill Serious Accident Investigation Report; Arizona State Forestry Division: Phoenix, AZ, USA, 2013;
116p. Available online: https://www.frames.gov/catalog/15735 (accessed on 31 August 2021).
6. Luchetti, N.T.; Friedrich, K.; Rodell, C.E.; Lundquist, J.K. Characterizing Thunderstorm Gust Fronts near Complex Terrain. Mon.
Weather Rev. 2020, 148, 3267–3286. [CrossRef]
7. Luchetti, N.T.; Friedrich, K.; Rodell, C.E. Evaluating Thunderstorm Gust Fronts in New Mexico and Arizona. Mon. Weather Rev.
2020, 148, 4943–4956. [CrossRef]
8. Powers, J.G.; Bresch, J.F.; Schwartz, C.S.; Coen, J.L.; Sobash, R.A. The Use of NWP Models to Identify Convective Outflows for
Fire Weather Forecasting—Final Report to the Joint Fire Science Program; JFSP Project No. 17-1-05-5; University Corporation for
Atmospheric Research: Boulder, CO, USA, 2019; 45p. Available online: https://www.frames.gov/catalog/60838 (accessed on 31
August 2021).
9. Sun, C.; Vallotton, P. Fast linear feature detection using multiple directional non-maximum suppression. J. Microsc. 2009, 234,
147–157. [CrossRef] [PubMed]
10. Achtemeier, G.L. Planned Burn-Piedmont. A local operational numerical meteorological model for tracking smoke on the ground
at night: Model development and sensitivity tests. Int. J. Wildland Fire 2005, 14, 85–98. [CrossRef]
11. Liu, Y.; Kochanski, A.; Baker, K.R.; Mell, W.; Linn, R.; Paugam, R.; Mandel, J.; Fournier, A.; Jenkins, M.A.; Goodrick, S.; et al.
Fire behaviour and smoke modelling: Model improvement and measurement needs for next-generation smoke research and
forecasting systems. Int. J. Wildland Fire 2019, 28, 570–588. [CrossRef] [PubMed]You can also read