A hyperthermal O-atom exchange reaction, O2 + CO2
←
→
Page content transcription
If your browser does not render page correctly, please read the page content below
L. Y. Yeung             Oxygen isotope exchange reactions of CO2           Chapter 3

Chapter 3

A hyperthermal O-atom exchange
reaction, O2 + CO2

   Adapted from Yeung, L. Y., M. Okumura, J. T. Paci, G. C. Schatz, J. Zhang, and T.

K. Minton (2009), Hyperthermal O-Atom Exchange Reaction O2 + CO2 through a CO4

Intermediate, J. Am. Chem. Soc., 131(39): 13,940–13,942. ©2009 American Chemical

Society Publications.

                                          69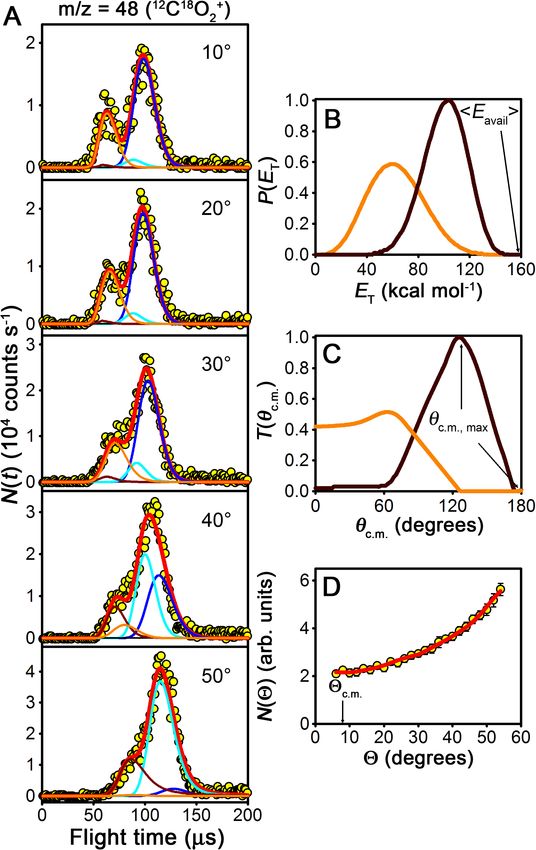
L. Y. Yeung              Oxygen isotope exchange reactions of CO2                 Chapter 3

   3.1    Abstract

      O2 and CO2 do not react under ordinary conditions, owing to the thermodynamic

   stability of CO2 and the large activation energy required for multiple double-bond

   cleavage. We present evidence for a gas-phase O-atom exchange reaction between

   neutral O2 and CO2 at elevated collision energies (≈ 160 kcal mol−1 ) from crossed-

   molecular-beams experiments.       Products were scattered mainly in the forward

   direction, i.e., in the initial direction of the hyperthermal oxygen beam in the center-

   of-mass (c.m.) frame, with 16% of the available energy in translation, on average.

   CCSD(T)/aug-cc-pVTZ calculations demonstrate that isotope exchange can occur on

   the ground triplet potential energy surface through a short-lived CO4 intermediate that

   isomerizes via a symmetric CO4 transition state containing a bridging oxygen atom.

   We propose a plausible adiabatic mechanism for this reaction supported by additional

   spin-density calculations.

                                            70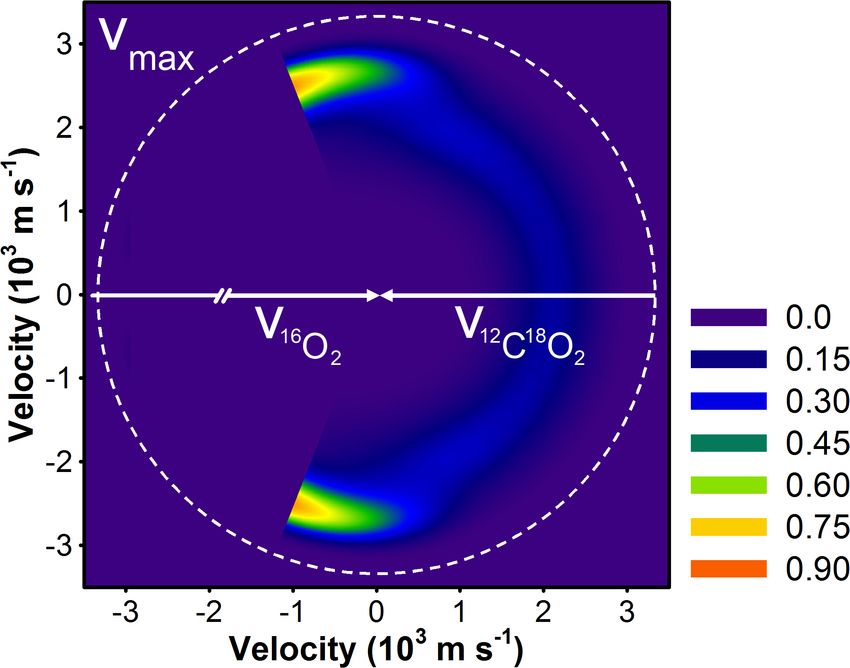
L. Y. Yeung                   Oxygen isotope exchange reactions of CO2                            Chapter 3

3.2        Introduction

    O2 and CO2 do not react under ordinary conditions. This can be attributed to the

large activation energy for multiple double-bond cleavage, as Dixon illustrated in his early

experiments in which dry CO–O2 –CO2 mixtures “did not explode” when subjected to a

spark discharge [Dixon, 1886]. Otomo et al. [2000] later reported a reaction of CO2 and

electronically excited O2 ∗ when they observed O3 products after irradiating super- and sub-

critical O2 /CO2 mixtures with UV light. While investigating the isotope exchange reaction

                                16
                                     O(3 P) +12 C18 O2 →18 O +16 O12 C18 O                               (3.1)

at hyperthermal collision energies in a crossed-molecular-beams experiment, we found evi-

dence for the gas-phase oxygen isotope exchange reaction

                                16
                                     O2 +12 C18 O2 →18 O16 O +16 O12 C18 O                               (3.2)

of ground-state reactants at high collision energies (∼160 kcal mol−1 ). Our observations

on the dynamics of this reaction, taken together with ab initio calculations of stationary

points on the lowest triplet potential energy surface (PES), suggest a plausible adiabatic

mechanism for the reaction of O2 with CO2 through a CO4 transition complex.

3.3        Experimental studies

3.3.1          Methods

      Crossed-molecular-beam experiments were performed with a hyperthermal oxygen

source containing ∼87% O(3 P) and ∼13% O2 (3 Σ−
                                              g ) [Brunsvold et al., 2007, 2008; Gar-

ton et al., 2006, 2009]. A diagram of the experimental setup, configured for                  16 O(3 P)      +
12 C18 O
           2   collisions, is shown in Figure 3.1. A pulsed beam of      16 O(3 P)   and   16 O
                                                                                                  2   (3 Σ+
                                                                                                          g ; at

an unknown vibrational temperature) was generated by laser-induced detonation of                          16 O
                                                                                                                 2

using a high-energy CO2 TEA laser (6 – 7 J pulse−1 ) operating at a pulse repetition rate of

2 Hz. Though initially broad in velocity distribution (6 – 9 km s−1 ), a portion of the overall

                                                     71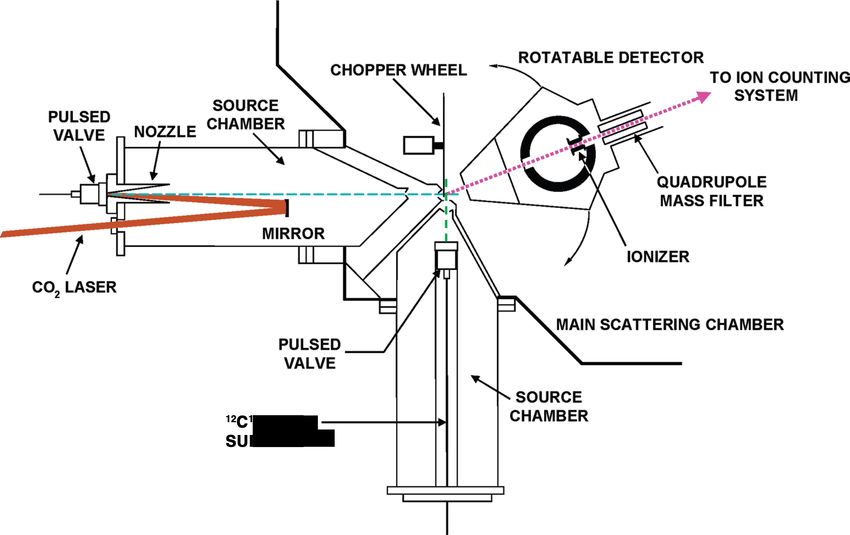
L. Y. Yeung                   Oxygen isotope exchange reactions of CO2                                     Chapter 3

beam was velocity-selected for the scattering experiments using a synchronized chopper

wheel operating at 300 Hz. This velocity-selected beam was crossed, at a nominal angle of

90◦ , with a pulsed supersonic expansion of 98% 12 C18 O2 gas (2% 16 O12 C18 O; Spectra Gas).

The molecular beams and scattered products were detected with a rotatable quadrupole

mass spectrometer with electron-bombardment ionization [Brink, 1966] at 160 eV and a

Daly-type ion counter [Daly, 1960].       12 C18 O    and 16 O12 C18 O products were detected at m/z
                                                  2

= 48 (12 C18 O+           16 12 18 +
              2 ) and 46 ( O C O ), respectively, with a rotatable mass spectrometer that

collected number density distributions as a function of arrival time, N(t), at a given labora-

tory angle, Θ, using a multi-channel plate (MCP). Here, Θ is defined as the angle at which

the   16 O12 C18 O   scatters with respect to the direction of the reagent oxygen beam (i.e., Θ

= 0◦ ). Time-of-flight (TOF) distributions for         16 O(3 P), 16 O
                                                                         2,
                                                                              12 C18 O
                                                                                         2,   and   16 O12 C18 O   were

collected over a range of laboratory angles (6◦ – 54◦ ); at each angle, the TOF distribution

for the 33.7-cm distance between the beam interaction region to the ionizer was integrated

to give a laboratory angular distribution, N(Θ). A forward-convolution method was used to

derive the center-of-mass (c.m.) translational energy P(ET ) and angular T(θ c.m. ) distribu-

tions from the laboratory N(t) and N(Θ) distributions [Lee, 1988], where θ c.m. is the angle

at which 16 O12 C18 O scatters with respect to the reagent oxygen direction in the c.m. frame.

The canonical Newton diagrams used in this analysis are shown in Figure 3.2.

  Figure 3.1: Crossed-molecular-beam apparatus with hyperthermal oxygen source.

                                                  72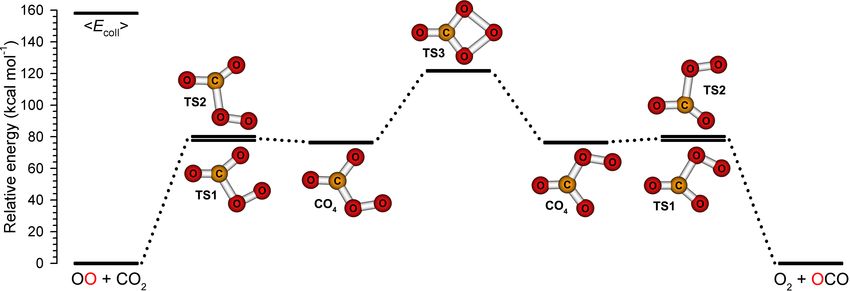
L. Y. Yeung               Oxygen isotope exchange reactions of CO2                   Chapter 3

Figure 3.2: Canonical Newton diagram for hyperthermal 16 O2 + 12 C18 O2 collisions. The
Newton circles represent the maximum recoil velocities of the products.

   The hyperthermal oxygen beam was generated by laser detonation of a pulsed expan-

sion of O2 gas with 500 psig stagnation pressure using a source based on the design of

Caledonia et al. [1987]. 174 µs after the pulsed valve is triggered, the CO2 laser is fired; the

laser pulse passed through an antireflection-coated ZnSe window in to the source cham-

ber, whereupon it was reflected back towards the gold-plated, water-cooled copper nozzle

with a 1 m radius concave gold mirror. The focused laser pulse initiates a breakdown

of the O2 gas and heats the resulting plasma to > 20,000 K, which accelerates both the

atomic and molecular oxygen fractions of the pulsed beam to 6 – 9 km s−1 . Use of a con-

ical nozzle allowed for efficient ion-electron recombination and inefficient atom-atom and

atom-molecule recombination as the plasma expanded and cooled. The resulting gas pulse

was collimated by a 1 cm diameter aperture located 80 cm downstream of the inlet nozzle

into a differentially pumped region (10−5 – 10−6 Torr), after which it passed through a

1.2-mm-diameter skimmer 16 cm further downstream. The beam interaction region was an

additional 3 cm downstream in the main chamber (2 × 10⁻⁷ Torr), a total distance of 99

cm from the inlet nozzle.

   For velocity selection within the hyperthermal oxygen beam, a chopper wheel running

at 300 Hz (synchronized with the 2-Hz laser pulses) was placed inside the main scattering

                                              73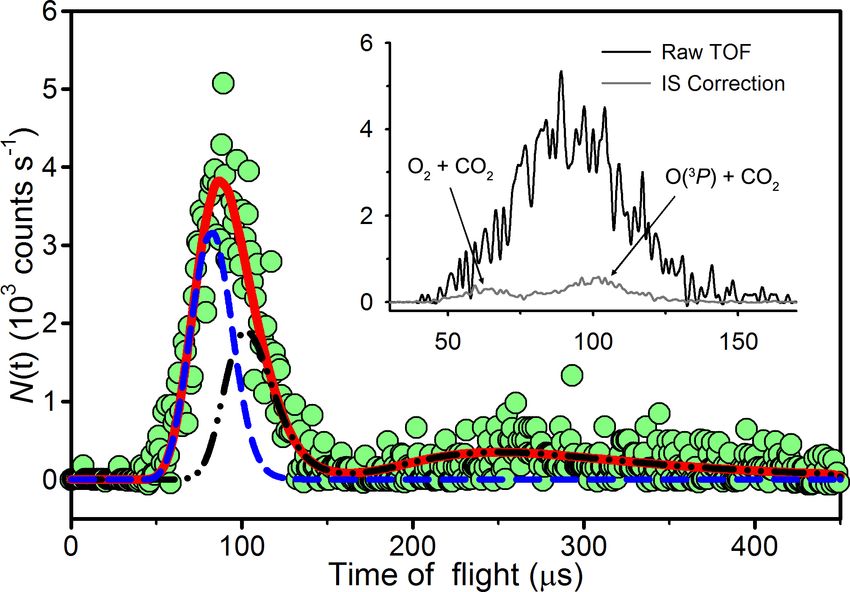
L. Y. Yeung              Oxygen isotope exchange reactions of CO2                                     Chapter 3

chamber, just downstream of the skimmer. Three equally-spaced slots (1.5 mm wide) of

the chopper wheel pass over an LED/photodiode assembly a quarter-turn before each slot

enters the beam axis, generating a 900 Hz (3 × 300 Hz) train of pulses. These chopper

wheel pulses are sent to a digital delay generator and used as references for triggering

the O2 gas pulses. The time delay between the chopper wheel pulse and the O2 pulse

determined the portion of the overall hyperthermal oxygen beam allowed to pass through

into the interaction region.

   We characterized the velocity distribution of the hyperthermal oxygen beam under two

conditions: on axis (Θ = 0◦ ) with a small aperture (∼125 µm diameter) to obtain the

peak of the distribution, and off axis (Θ = 3◦ ) with a large aperture (4 mm × 4 mm) to

obtain the width of the distribution. For the on-axis configuration, a 2 mA emission current

at the ionizer and a –18 kV potential at the secondary emitting electrode of the Daly ion

counter was used. For the off-axis configuration, a 10 mA emission current at the ionizer

and a –30 kV potential at the secondary emitting electrode was used. Laboratory TOF

distributions under both conditions were measured, for both               16 O   and   16 O
                                                                                              2,   to determine

the laboratory-frame velocities and translational energy distributions for the hyperthermal

oxygen beam. In these experiments, the average velocity of the hyperthermal oxygen beam

was thus determined to be 8262 ± 450 m s−1 (i.e., 900 m s−1 full width at half maximum;

FWHM), which corresponds to average translational energies hET i = 130.5 ± 14 kcal mol−1

and 261.0 ± 28 kcal mol−1 FWHM for        16 O(3 P)   and   16 O
                                                                   2,   respectively (see Figure 3.3).

The relative amounts of atomic (∼87%) and molecular (∼13%) oxygen were determined

by integrating the TOF distributions at m/z = 16 (16 O+ ) and 32 (16 O2 + ) at Θ = 0◦ and

correcting for O2 fragmentation (11% of the m/z = 32 signal) in the electron-bombardment

ionization region.

   A pulsed supersonic expansion of    12 C18 O    was generated using a piezoelectric pulsed
                                               2

general valve with a 1300-Torr stagnation pressure. The expansion passed through a 2 mm

diameter skimmer (9.2 cm from the nozzle) into a differential pumping region, and then

through a 2.5 mm diameter (2.8 cm downstream of the skimmer) aperture into the main

scattering chamber. The distance from this aperture to the interaction region was 1.5 cm.

                                             74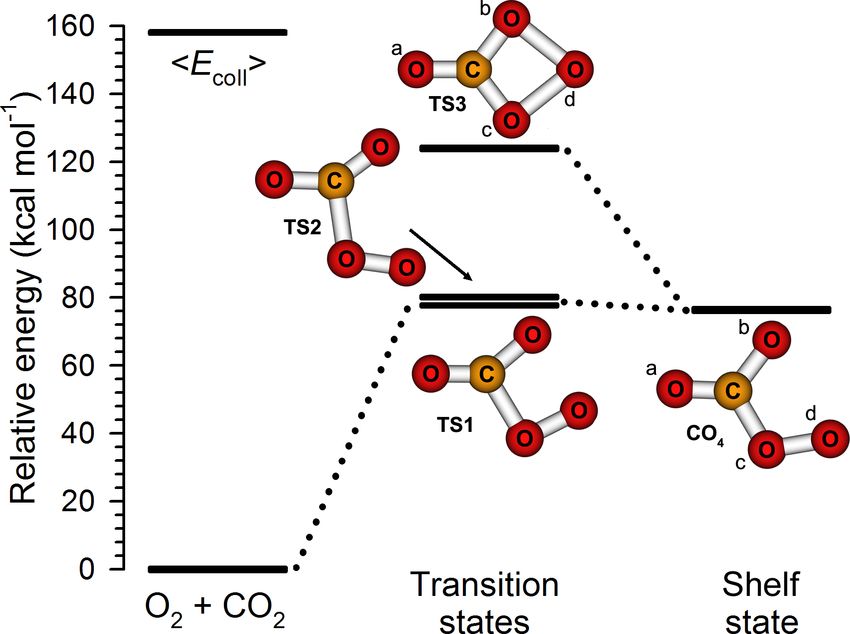
L. Y. Yeung                      Oxygen isotope exchange reactions of CO2                      Chapter 3

               Figure 3.3: Velocity distribution of hyperthermal oxygen beam.

The velocity distribution of the        12 C18 O       beam was not measured directly, and instead was
                                                   2

determined iteratively by first estimating the terminal velocity of the supersonic expansion

[Lee, 1988] and then fitting the        12 C18 O       velocity to the value that yielded the best Newton
                                                   2

circle for non-reactively scattered O-atoms while keeping the measured O-atom velocity dis-

tribution fixed at its measured values. This contributes some uncertainty to the measured

TOF distributions because the 12 C18 O2 beam velocity is likely only accurate to ±10%. How-

ever, because the magnitude of the hyperthermal oxygen beam velocity at the interaction

region was ten times that of the          12 C18 O         beam, and its FWHM was also 4 – 5 times that
                                                       2

of the   12 C18 O       beam, uncertainties in the “time-zero” of the hyperthermal oxygen source
                    2

dominated the overall uncertainty in the measured translational energy distributions.

   Laboratory TOF product distributions were measured every 2◦ between Θ = 6◦ – 54◦ .

Scattered product TOF distributions were collected for 200 beam pulses for for m/z = 16

(16 O+ ) and 32 (16 O2 + ), for 1000 beam pulses for m/z = 46 (16 O12 C18 O+ ), and for 500 beam

pulses for m/z = 48 (12 C18 O2 + ). Dwell time for each channel at the MCP was 1 µs. At a

representative laboratory angle of 10◦ , integrated count rates were 1.1 × 10⁷ s−1 for m/z

= 16, 1.3 × 10⁷ s−1 for m/z = 32, 1.8 × 10⁵ s−1 for m/z = 46 , and 4.2 × 10⁶ s−1 for m/z

                                                            75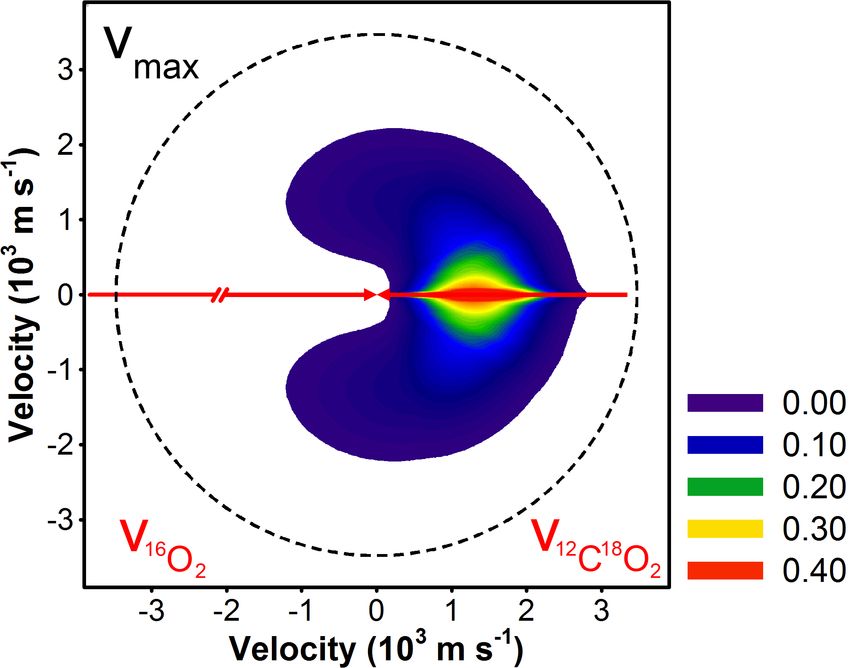
L. Y. Yeung                     Oxygen isotope exchange reactions of CO2                      Chapter 3

= 48. Raw flight times were converted to flight times over the 33.7 cm distance between

the interaction region and the electron-bombardment ionizer by subtracting the O2 trigger-

pulse-to-laser-fire delay time (174 µs), an electronic-latency delay time (3 µs), the oxygen

flight time from the nozzle to the interaction region (120 µs, corresponding to the average

velocity of the hyperthermal oxygen beam), and finally the ion flight time between the
                                                                                     1
ionizer and the Daly ion counter. The ion flight time is given by α(m/z) 2 , where α = 2.44

in these experiments, determined by comparing the relative arrival times of hyperthermal
16 O   and   16 O    at the detector [Garton et al., 2006]. Some uncertainty arises in the product
                 2

times-of-flight because the exact time- and point-of-origin of the hyperthermal oxygen beam

are not well determined; we estimate this uncertainty to be ∼2 µs because the laser pulse

width in the hyperthermal oxygen source could be as long as 1 µs (a 100 ns-wide peak with

a slow tail).

       Two signal corrections were made before data analysis. First, we corrected for beam

divergence at Θ = 6◦ – 16◦ . The divergent intensity with the 12 C18 O2 beam turned off was

measured by obtaining TOF distributions at m/z = 16 and 32 from Θ = 6◦ – 16◦ . These TOF

distributions were then scaled and subtracted from the corresponding experimental TOF

distributions at m/z = 16 and 32 that had the           12 C18 O       beam turned on. Uncertainties in
                                                                   2

the inelastic and reactive scattering signals due to collisions of the divergent hyperthermal

oxygen could not quantified, however; they were instead considered in the analysis of

the laboratory data, where collisions at crossing angles of 88◦ , 89◦ , 90◦ , 91◦ , and 92◦ were

included during forward-convolution fitting. Adding more crossing angles did not affect the

forward-convolution fits significantly. Second, we verified that the 12 C18 O2 beam contained

2% 16 O12 C18 O using the instrument’s mass spectrometer. Thus, 2% of the inelastic scattering

signal (m/z = 48) at each laboratory angle (Θ = 6◦ – 54◦ ) was subtracted from raw m/z =

46 (16 O12 C18 O+ ) TOF distributions to obtain reactive-scattering-only distributions.

       A forward-convolution method was employed to perform the laboratory-to-c.m. frame

coordinate transformation [Lee, 1988] of the data using the MSU XBEAM program (Version

6). Trial P(ET ) and T(θ c.m. ) distributions were used to simulate the laboratory-frame TOF

distributions using the following relationship derived from the Jacobian transformation:

                                                   76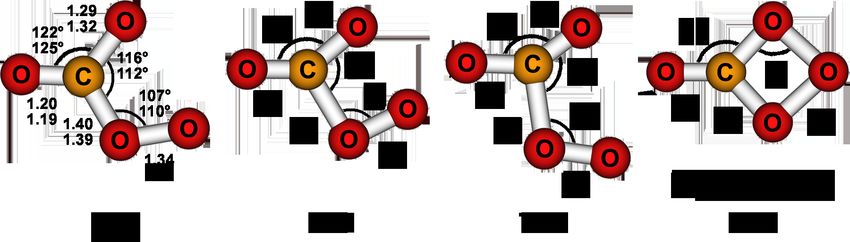
L. Y. Yeung               Oxygen isotope exchange reactions of CO2                    Chapter 3

                                               l3
                                  N(t, Θ) α        P(ET )T (θc.m. )                        (3.3)
                                              ut 3

where l and t are the distance and flight time, respectively, from the interaction region to the

ionizer, and u is the product velocity in the c.m. frame. During the fitting process,   12 C18 O
                                                                                                   2

was assumed to have a single-valued velocity, 800 m s−1 , because the large magnitude

and width of the hyperthermal oxygen beam velocity distribution is principally responsible

(i.e., it contributed ≥ 98% of the uncertainty in the c.m. collision energy; see above) for

the observed width of the laboratory TOF distributions and the c.m. translational energy

distributions. The width of the hyperthermal beam velocity distribution was fit by a Gaus-

sian function centered at 8262 m s−1 and a FWHM of 900 m s−1 , which was used during

data analysis. Note that the data we report for flight times over a 33.7 cm distance were

calculated by subtracting the average oxygen flight time from the nozzle to the interaction

region; the reported product arrival times, then, reflect a convolution of the oxygen beam’s

wide velocity distribution and the ‘true’ product translational energy distribution, so the

best-fit P(ET ) distributions may not be unique. As such, we estimate the uncertainties in the

reported P(ET ) distribution to be 10 – 20%.

   To allow for easy manipulation of the P(ET ) and T(θ c.m. ) distributions, parameterized

functions were often used. The fitting process often relied on the RRK form of the P(ET )

distribution:

                              P(ET ) = (ET − B) p (Eavail − ET )q                          (3.4)

where Eavail is the available translational energy in the c.m. frame (i.e., the collision energy,

Ecoll , minus the endothermicity, ∆E). The parameters B, p, and q were adjusted to vary the

peak and width of the c.m. translational energy distribution when obtaining a best fit to the

laboratory data. The T(θ c.m. ) distribution was described by a Legendre polynomial form:

                                              ak ck (cos2 θc.m. − 1)k
                             Tk (θc.m. ) =                                                 (3.5)
                                             2k k!    c(cos θc.m. )

where ak is an adjustable parameter for each of the eleven polynomial terms used, which

                                                 77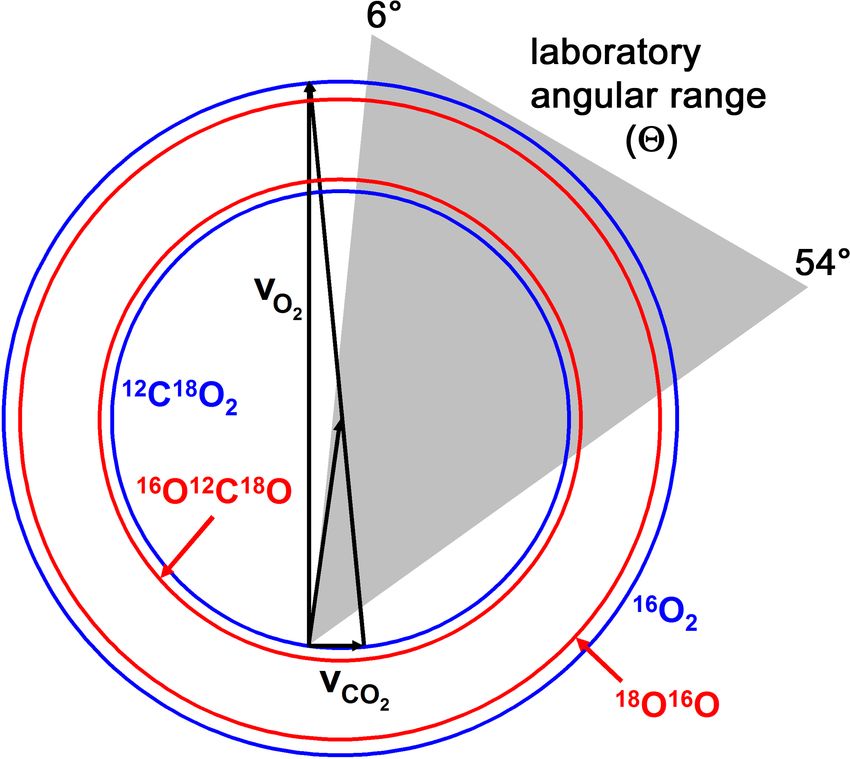
L. Y. Yeung                   Oxygen isotope exchange reactions of CO2                            Chapter 3

Figure 3.4: Laboratory TOF distribution of m/z = 46 (16 O12 C18 O+ ; green circles) at
Θ = 6◦ , with the inelastic scattering signal removed. The data are shown with the
O(3 P) + CO2 (dot-dashed black line), O2 + CO2 (dashed blue line), and summed (solid
red line) forward-convolution fits. Flight times less than 72 µs violate energy conservation
for 16 O(3 P) + 12 C18 O2 . The inset compares the raw TOF distribution with the IS TOF
distribution, which is subtracted.

were denoted by the subscripted k = 0, 1, 2,...10. The functional forms for the P(ET )

and T(θ c.m. ) distributions (3.4 and 3.5, respectively), were iterated in XBEAM until they

provided satisfactory fits to the laboratory data, though, in some cases, point forms of

the P(ET ) and T(θ c.m. ) distributions were used. Finally, the “best-fit” P(ET ) and T(θ c.m. )

distributions were used to create a c.m. velocity-flux contour map or a differential scattering

cross-section plot for the products.

3.3.2     Results

   The inset in Figure 3.4 shows a raw m/z = 46 TOF distribution of                    16 O12 C18 O   products

recorded at Θ = 6◦ . A small fraction of the signal can be attributed to inelastic scattering

(IS) of   16 O12 C18 O   impurities in the CO2 beam by   16 O   and   16 O
                                                                             2,   and it can be subtracted.

The remaining signal, shown in Figure 3.4, represents            16 O12 C18 O       products from O-atom

exchange reactions of 12 C18 O2 (see Chapter 4).

   We initially expected the reactive m/z = 46 signal to arise from reactions of                      12 C18 O
                                                                                                                 2

with the 16 O atoms (reaction 3.1) with a broad distribution of c.m. collision energies (Ecoll )

                                                78
L. Y. Yeung Oxygen isotope exchange reactions of CO2 Chapter 3
peaked at 98.8 kcal mol−1 and a full width at half maximum (FWHM) of 18 kcal mol−1 .
However, at small laboratory angles, we observed products with velocities that would vi-
olate energy conservation for this O(3 P) + CO2 reaction (e.g., t < 72 µs in Figure 3.4).
12 C18 O
2 was estimated to have a laboratory velocity of 800 ± 80 m s−1 (see Lee [1988]).
Given the broad velocity distribution in the O(3 P)/O2 beam (8262 m s−1 with 900 m s−1
FWHM), the velocity spread in the 12 C18 O beam was insignificant by comparison, so the
2
hyperthermal oxygen beam largely determined the broad distribution of collision energies
sampled in these experiments. To calculate the maximum available translational energy
in the laboratory frame for 16 O(3 P) + 12 C18 O and 16 O + 12 C18 O isotope exchange re-
2 2 2
actions, an initial 16 O(3 P)/16 O
2 beam velocity of 8862 m s−1 was used because < 5% of
the O(3 P)/O2 beam had a greater velocity. A non-negligible population of 16 O12 C18 O was
observed at translational energies above the maximum allowed for 16 O(3 P) + 12 C18 O col-
2
lisions at small laboratory angles.
Despite the uncertainties in the Ecoll distribution and product flight times (see Section
3.3.1), we observed 16 O12 C18 O products arrive 10 – 20 µs faster than the minimum times
allowed by the distribution of available energies, Eavail (≈Ecoll ; the zero-point energy change
is +0.1 kcal mol−1 ), for reaction 3.1. Forward-convolution best-fits to the TOF distributions
that only treat the 16 O(3 P) + 12 C18 O isotope exchange reaction cannot explain the fastest
2
laboratory data at small laboratory angles (e.g., Θ = 6◦ and 8◦ ; see Figure 3.5). Increasing
hET i in the product P(ET ) shifts the fastest part of the fit towards shorter flight times at all
laboratory angles. While this improves the TOF fits at small laboratory angles, it decreases
the quality of the TOF fits at larger laboratory angles (see Θ = 36◦ in Figure 3.6). Introduc-
ing the 16 O + 12 C18 O isotope exchange reaction yields good fits at all laboratory angles.
2 2
A sizeable fraction of the products assigned to the 16 O2 + 12 C18 O2 reaction are slow enough
that they do not violate conservation of energy; however, assigning them to the 16 O(3 P) +
12 C18 O reaction leads to poor fits. Collisions between CO2 and ions or electronically excited
2
O atoms could also yield 16 O12 C18 O products with elevated velocities, previous experience
with this hyperthermal source indicates that they are not present in the beam [Troya et al.,
2004].
79L. Y. Yeung Oxygen isotope exchange reactions of CO2 Chapter 3
Figure 3.5: TOF distributions (green dots) for 16 O12 C18 O products at laboratory angles
Θ = 6◦ and 8◦ with the inelastic scattering signal removed. Also shown are forward-
convolution best fits (solid red line) that treat only one isotope exchange reaction, 16 O(3 P)
+ 12 C18 O2 → O + 12 C18 O2 . The forward-convolution fits cannot account for the fastest
16 O12 C18 O product signals at small laboratory angles.
We therefore hypothesize that the fast 16 O12 C18 O products come from reaction of 12 C18 O2
with 16 O2 in the hyperthermal beam. Because the velocity-selected 16 O2 molecules have the
same laboratory-frame velocity distribution as the 16 O atoms, the 16 O molecules collide
2
with the 12 C18 O molecules at substantially higher c.m. energies (see Newton diagram in
2
Figure 3.2). The resulting collision energy distribution peaked at Ecoll = 158 kcal mol−1
with FWHM = 28 kcal mol−1 . Thus, 16 O12 C18 O products from reaction 3.2 have sufficient
Eavail to account for the fastest products detected. The m/z = 46 signal would then contain
products of both reactions 3.1 and 3.2, the fastest products arising exclusively from reaction
3.2.
P(ET ) and T(θ c.m. ) distributions for reactions 3.1 and 3.2 were simultaneously obtained
from forward-convolution fits of the m/z = 46 TOF distributions. The results for the 16 O
2
+ 12 C18 O reaction are presented in Figure 3.7; a c.m. velocity-flux contour diagram of
2
16 O12 C18 O products is shown in Figure 3.8, in which the observed product flux is peaked
in the forward direction. The presence of signal at flight times violating energy conserva-
tion for 16 O(3 P)–12 C18 O collisions was used to guide the fitting process because the TOF
2
distributions do not resolve the products unambiguously. As such, we cannot rule out an ad-
ditional dynamical channel in reaction 3.1 contributing to some of the signal we attribute to
reaction 3.2 because energy conservation in reaction 3.1 is only violated at small lab angles.
80L. Y. Yeung Oxygen isotope exchange reactions of CO2 Chapter 3
Figure 3.6: TOF distributions for 16 O12 C18 O (m/z = 46) at various laboratory angles Θ
with the inelastic scattering signal removed. The raw data are shown as circles. Forward-
convolution fits of the 16 O2 + 12 C18 O2 (blue dashed curve) and 16 O(3 P) + 12 C18 O2 (black
dot-dashed dashed curve) channels, along with their sum (red solid curve), are also shown.
81L. Y. Yeung Oxygen isotope exchange reactions of CO2 Chapter 3
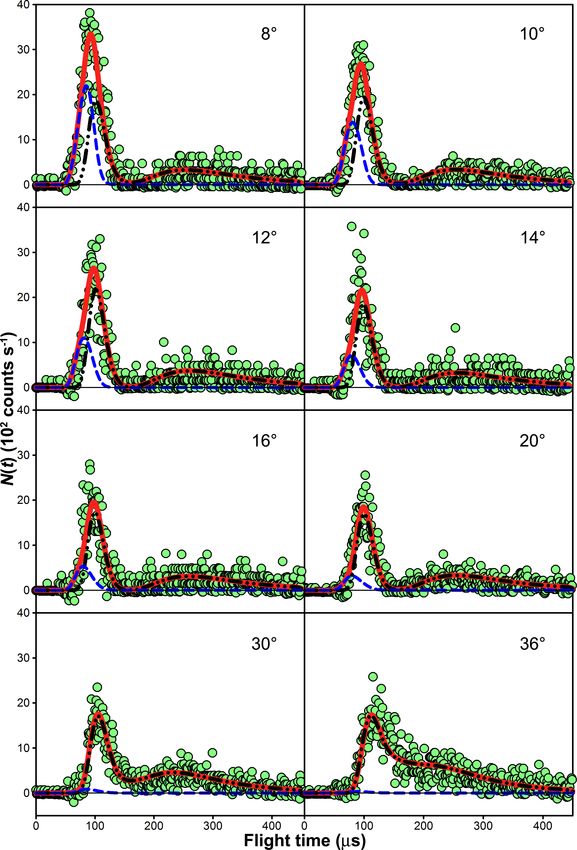
Figure 3.7: Center-of-mass-frame (A) angular and (B) translational energy distribu-
tions from the 16 O2 + 12 C18 O2 oxygen isotope exchange reaction obtained from TOF
fits of m/z = 46. The peak of the distribution of available energies is Eavail = 158 kcal
mol−1 . Only the experimentally accessible range of c.m. angles (θ c.m. < 100◦ ) is shown.
Figure 3.8: Velocity-flux contour diagram for 16 O12 C18 O products of 16 O2 + 12 C18 O2
collisions in the center-of-mass frame. The white arrows are the initial 16 O2 and 12 C18 O2
velocity vectors, and dashed white line is the maximum recoil velocity for 16 O12 C18 O (vmax ).
16 O12 C18 O products are scattered opposite the initial direction of the 12 C18 O velocity vector.
2
82L. Y. Yeung Oxygen isotope exchange reactions of CO2 Chapter 3
The 16 O12 C18 O products scattered mainly in the forward direction (θ c.m. = 0◦ ), though
there was significant sideways scattering. Experimental sensitivity in the backward direc-
tion was insufficient to detect backward-scattered 16 O12 C18 O products, so forward-backward
symmetric scattering (i.e., evidence for a long-lived intermediate complex) could not be
ruled out. At these collision energies, however, an intermediate is unlikely to survive for a
rotational period. The average total translational energy distribution for the two products
was 25 kcal mol−1 , or 16% of the available energy; the P(ET ) distribution was peaked at ET
= 10 kcal mol−1 . We estimate the yield for reaction 3.2 to be ≤ 2% of all O2 –CO2 collisions.
This estimate is an upper limit because the complete Newton circle for inelastically scattered
16 O + 12 C18 O products was not observed in these experiments. Vibrational excitation of
2 2
the O2 may also be important in promoting reaction, but the vibrational temperature of O2
present in the expanded plasma is unknown.
Our experimental results are consistent with a 16 O12 C18 O product that rebounds from
the 12 C18 O reactant’s initial direction after it collides with O2 ; this mechanism is charac-
2
teristic of reactions with substantial activation energies that require high collision energies.
The highly peaked angular distribution is consistent with a direct mechanism or a very
short-lived intermediate, but more surprising is the substantial internal energy of the prod-
ucts, which is much greater than that found for similar oxygen isotope exchange reactions
between O(3 P) + CO, O(1 D) + CO2 , and O + O2 [Brunsvold et al., 2008; Perri et al., 2004;
Van Wyngarden et al., 2007]. This large translational-to-internal energy conversion sug-
gests that the reaction proceeds through an intermediate species that facilitates efficient
translational-to-internal energy transfer or through a non-adiabatic transition to another
electronic surface.
On average, 134 kcal mol−1 of internal energy is available to both products. This ex-
cess energy could be distributed among the five vibrational and four rotational degrees of
freedom in O2 and CO2 . Alternatively, this energy could be in the form of electronically
excited products, including the a1 ∆g , b1 Σ+ 3 + 3 00
g , and A Σu states of O2 , and the a A state of
CO2 , which lies 119 kcal mol−1 above that for CO2 (1 Σ+
g ) [Braunstein and Duff , 2000]. The
mass-spectrometric detection, however, did not allow us to determine the electronic states
83L. Y. Yeung Oxygen isotope exchange reactions of CO2 Chapter 3
Figure 3.9: Energetically allowed neutral product channels from O2 + CO2 collisions.
Energies are taken from the NIST Webbook [http://webbook.nist.gov], [Mebel et al., 2004],
and [Braunstein and Duff , 2000].
of the products.
Other reaction channels are possible (see Figure 3.9). We cannot rule out a CO2 + O
+ O product channel because we did not collect sufficient data on the counter-fragment
18 O16 O. However, the energetically allowed CO2 + O(3 P) + O(3 P) channel (∆H = 118
kcal mol−1 ) is spin-forbidden, and spin conservation would instead favor O(1 D) + O(3 P)
products, whose energetic threshold is 163 kcal mol−1 and above the average Eavail in the
experiment. There is also sufficient energy to form O3 + CO or O + CO3 [Mebel et al.,
2004], and to dissociate CO2 to form O2 + O + CO, but because we were not anticipating
these reactions, we did not search for the relevant detectable products.
84L. Y. Yeung Oxygen isotope exchange reactions of CO2 Chapter 3
Figure 3.10: Calculated energies and structures on the lowest triplet PES of O2 + CO2 .
TS3 connects isoenergetic isomers of the CO4 shelf.
3.4 Theoretical studies
To investigate whether an adiabatic mechanism exists for the O2 –CO2 isotope exchange
reaction, we performed ab initio calculations to find stationary points on the lowest triplet
PES for O2 + CO2 reaction at the CCSD(T)/aug-cc-pVTZ level of theory using the MOLPRO
electronic structure code [Werner et al., 2006]. We identified two transition states (TS1
and TS2) connecting O2 + CO2 reactants with a triplet shelf state [CO4 (3 A00 ); see Figure
3.10 and Table 3.1]. All three structures are planar. One atom of the oxygen molecule
approaches the carbon atom of CO2 and surmounts an activation barrier of 77.9 kcal mol−1
over TS1 to form a weak C–O bond and a CO4 (3 A00 ) shelf (76.4 kcal mol−1 , just 1.5 kcal
mol−1 below TS1) similar to a weakly bound CO4 complex found at the B3LYP level of
theory [Cacace et al., 2003; Elliott and Boldyrev, 2005]. At 121.8 kcal mol−1 , we identified
an effective transition state for CO4 (3 A00 ) isomerization, TS3, containing a four-membered
ring between the carbon atom and three oxygen atoms. A grid-based search revealed that
TS3 is bound by 0.02 kcal mol−1 when zero-point energy is not considered, and that TS3
85L. Y. Yeung Oxygen isotope exchange reactions of CO2 Chapter 3
Table 3.1: Energies of stationary points associated with the exchange reaction O2 + CO2 →
O2 + CO2 on the lowest triplet potential energy surface∗
CO4 TS1 TS2 TS3
†
CHF 0.973 0.977 0.969 0.945
∆E [CCSD(T)/aug-cc-pVTZ] 76.0 77.9 80.0 120.9
‡
∆EZPE [CCSD(T)/aug-cc-pVTZ] 76.4 77.9 78.3 121.8
∆E (CASPT2/cc-pVTZ) 91.2 95.6 97.1 137.4
∗ ∆E in kcal mol−1 .
† Coefficient of the Hartree-Fock configuration in the (8,10)-CASSCF expansion of the wave-
functions.
‡ ZPE-corrected. This calculation was not performed at the CASPT2 level of theory.
is connected to CO4 ; a displacement in Od < 0.01 Å towards CO4 produced CO4 upon
geometry optimization. Thus, it acts as an ‘effective’ transition state for CO4 isomerization;
it resembles the bound CO4 (1 A1 ) structure lying 52.5 kcal mol−1 below it, although with a
longer Oc –Od bond length; both structures have C2v symmetry [Cacace et al., 2003; Elliott
and Boldyrev, 2005; Jamieson et al., 2007].
We observed some evidence for multi-reference character in CO4 . An additional bound
state was found 0.8 kcal mol−1 above the energy of CO4 at the MP2/cc-pVTZ level of theo-
ry, although it does not exist at the CCSD(T)/aug-cc-pVTZ level; the species is believed
to be a resonance structure of CO4 (3 A00 ). A spin contamination of hS2 − Sz2 − Sz i = 0.011
in the region of the PES near TS3 also suggests some multi-reference character. Thus,
CASPT2/cc-pVTZ calculations, which represent resonance qualitatively correctly and do
not suffer from spin contamination, were performed to validate the CCSD(T) structures
and energies. CO4 (3 A00 ) was confirmed as a resonance hybrid of two bound-state struc-
tures, although the contribution from the single-reference structure to the resonance hybrid
dominates the final geometry. The results of those calculations are summarized in Table 3.1
and Figure 3.11.
The uncertainty in the CCSD(T)/aug-cc-pVTZ energies is unknown, although a similar
study in which the stationary points of the closely related O(3 P) + CO2 system were charac-
terized was recently completed (see Chapter 4). In addition to CCSD(T)/aug-cc-pVTZ sim-
ulations, W4 calculations (close to the full configuration-interaction and infinite-basis-set
86L. Y. Yeung Oxygen isotope exchange reactions of CO2 Chapter 3
Figure 3.11: Calculated stationary point geometries on the lowest triplet PES of CO4 .
CCSD(T)/aug-cc-pVTZ values (upper) and CASPT2/cc-pVTZ (lower) values are shown.
limits; see [Karton et al., 2006]) were also performed, as they were found to be affordable,
albeit marginally. The differences between the CCSD(T) and W4 results for the transition
and bound states indicated a mean-unsigned error of 2.2 kcal mol−1 . We expect the errors
in the analogous O2 + CO2 energies to be approximately the same.
3.5 Proposed mechanism
A possible pathway for oxygen isotope exchange occurs through the forward and re-
verse directions of the following three steps: O2 + CO2 → [CO4 ]‡ (TS1/TS2) → CO4 (3 A00 )
→ [CO4 ]‡ (TS3); see Figure 3.12. Spin-density maps (Figure 3.13) depicting the singly-
occupied molecular orbitals (SOMOs) for CO4 and TS3 are consistent with this mechanism.
CO4 (3 A00 ) is a diradical with unpaired electron density concentrated in p-type orbitals of the
Figure 3.12: Calculated energies and structures on the lowest triplet PES of O2 + CO2 .
TS3 connects isoenergetic isomers of the CO4 shelf.
87L. Y. Yeung Oxygen isotope exchange reactions of CO2 Chapter 3
Figure 3.13: Singly-occupied molecular orbitals (SOMOs) in the CO4 (3 A00 ) and TS3
structures. Surfaces containing 70% of the electron density are shown. Note that the
highest SOMO of CO4 (3 A00 ) and the lowest SOMO of TS3 have electron density primarily
on Od , suggesting the SOMO is a spectator during isomerization.
single-bonded oxygens, Ob and Od . This spin density is consistent with the radical charac-
ter expected for an association of the O2 diradical with the carbon atom of CO2 , because
the unpaired electrons in O2 are in orthogonal π ∗g orbitals: As one C–O bond is formed
between the in-plane π ∗g orbital of O2 and the in-plane π bu orbital of CO2 (the higher-energy
π nb ∗
g orbital does not interact due to symmetry; see Figure 3.14), the out-of-plane π g orbital
on O2 is a relative spectator to the O2 radical addition. This interaction, along with the
bending of the CO2 , produces the SOMOs for CO4 (3 A00 ) shown in Figure 3.13. In TS3, the
lowest SOMO contains localized electron density on Od in an out-of-plane p-type orbital,
suggesting that the unpaired electron on Od continues to be a spectator during CO4 (3 A00 )
isomerization. The highest SOMO, however, contains delocalized electron density, of anti-
bonding (σ ∗ ) character, in the plane of the molecule. This σ ∗ character may be interpreted
as electron density taken from the lowest SOMO in CO4 (3 A00 ) while being localized onto Oc
during isomerization.
These theoretical results imply that an adiabatic mechanism exists for the oxygen isotope
exchange reaction between O2 and CO2 . During the isomerization of CO4 (3 A00 ), the Oc –Od
σ -bond is cleaved homolytically (Figure 3.15): One electron moves to a p-type orbital on
88L. Y. Yeung Oxygen isotope exchange reactions of CO2 Chapter 3
Figure 3.14: Molecular orbital diagrams for O2 and CO2 , adapted from DeKock and
Gray [1980]. Sketches of the highlighted orbitals are shown. As O2 collides with CO2 , it
becomes stretched. In addition, CO2 bends, increasing the energy of its doubly occupied,
in-plane π-orbitals, π bu and π nb ∗
g . A weak interaction between the π g orbital on O2 and the
π bu orbital on CO2 is likely responsible for the small (1.5 kcal mol−1 ) binding energy of CO4 .
The π nbg orbital does not interact, to first approximation, due to symmetry.
Oc , while the other electron forms a bond with the unpaired electron on Ob . This pathway
can account for the σ ∗ character of the highest-energy SOMO in TS3 (the Ob –Od bond takes
an electron from the Oc –Od bond), and it preserves radical character on Od . Thus, the 3 A00
symmetry is preserved throughout the association, isomerization, and dissociation steps.
This mechanism is qualitatively consistent with the small reaction cross-section and a
preference for rebounding reactive collisions inferred from the dynamics observed in the
experiment. The O2 must approach the CO2 at very low impact parameters with high ener-
gies to overcome the initial barrier (TS1/TS2) and reach the ‘shelf’ of the bound CO4 (3 A00 ).
Momentum along the reaction coordinate beyond CO4 (3 A00 ) with ∼80 kcal mol−1 excess
energy should further compress the C–Oc bond with synchronous bending of the C–Oc –Od
89L. Y. Yeung Oxygen isotope exchange reactions of CO2 Chapter 3
Figure 3.15: Electron-pushing diagram of an adiabatic CO4 (3 A00 ) isomerization through
TS3.
angle, stretching of Oc –Od , and ring formation to form TS3, followed by rapid repulsion
from the final TS1/TS2 state. Finally, the large change in geometry from reactants to TS3
should facilitate the transfer of some translational energy into internal degrees of freedom
of the products. Reactive scattering should become less ‘rebound’-like (forward-scattered)
as Ecoll is increased above the reactive threshold; at 37 kcal mol−1 above the reactive barrier,
the tight transition state, repulsive exit channel leading out of TS1/TS2, and low angular
momentum must limit the extent of sideways scattering. While some sideways scattering is
indeed observed in the experiment, the Ecoll dependence of T(θ c.m. ) is not known.
A non-adiabatic transition to another potential surface cannot be excluded, especially
given the high internal energies observed in the products. At these high energies [80 kcal
mol−1 above even the CO4 (3 A00 ) shelf state], many excited-state surfaces must exist, and ra-
diationless transitions via conical intersections may occur. While intersystem crossing (ISC)
in the exit or entrance channels is unlikely at the high relative velocities of the experiment
[Landau, 1932], spin transitions could readily occur if a complex is formed. For instance,
the bridging oxygen atom in TS3, Od , must be equivalently bound to Ob and Oc , and chem-
ical intuition suggests that an intersection with a singlet surface may occur by spin-paired
CO4 (1 A1 ) [Cacace et al., 2003; Elliott and Boldyrev, 2005; Jamieson et al., 2007].
3.6 Conclusion
An O2 –CO2 isotope exchange reaction on the ground triplet electronic surface is possible
and is consistent with our laboratory observations. Nevertheless, additional work would
90L. Y. Yeung Oxygen isotope exchange reactions of CO2 Chapter 3
be valuable in the confirmation of this hypothesis. Collision-energy-dependence studies of
the product angular distribution may elucidate the mechanistic origins of the low average
translational energy of products. Experimental detection of O2 counter-fragments and a
search for products from other channels (e.g., spectroscopic identification of electronically
excited states) would also be revealing. Last, a more complete surface, reactive trajectories,
and locations of possible surface intersection seams leading to ISC would be vital to a full
explanation of the reaction dynamics.
3.7 Acknowledgements
We thank G. B. Ellison, S. L. Mielke, and J. E. Wulff for insightful discussions. This work
was supported by the Missile Defense Agency under cooperative agreement HQ0006-05-2-
0001. L. Y. Y. was supported by the Davidow Fund, and G. C. S. was supported by AFOSR
grant FA955D-07-1-0095.
91L. Y. Yeung Oxygen isotope exchange reactions of CO2 Chapter 3
Appendices
92L. Y. Yeung Oxygen isotope exchange reactions of CO2 Chapter 3
3.A Non-reactive scattering of O2 and CO2
The experiment mainly observed signals due to 16 O2 scattered with little deflection from
its initial direction (see Newton diagram in Figure 3.2); these signals corresponded to the
sum of elastic and inelastic scattering collisions of 16 O2 , which we could not resolve, so they
will be referenced collectively as “scattered 16 O2 .” Five representative laboratory-frame TOF
distributions (m/z = 32), the c.m. angular and translational energy distributions, and the
laboratory-frame angular distribution obtained from 16 O product detection are shown in
2
Figure 3.16. Scattered 16 O
2 had 126.3 kcal mol−1 total translational energy, or 80% of
the available energy, on average. The experimental translational energy distribution was
peaked at ∼148 kcal mol−1 . The c.m. angular distribution for 16 O was highly peaked in
the forward direction with little scattered intensity for θc.m. > 30◦ ; however, the velocity
and angular range for 16 O product detection in the experiment prevented the detection
2
of backward-scattered 16 O (see Figure 3.2). Some dependence of the c.m. translational
2
energy distribution on the c.m. angular distribution was observed in the 16 O TOF data; the
forward-convolution simulations became increasingly faster than the data at larger labora-
tory and c.m. angles (e.g, Θ = 18◦ , 28◦ , and 42◦ in Figure 3.16). We also note that, like for
16 O (see Sections 4.4.2.1 and 4.5.2), the c.m. angular distribution for inelastically scattered
16 O
2 at θc.m. ∼ 0◦ is an extrapolation because of high background from the hyperthermal
source at the small laboratory angles corresponding to small c.m. angles for 16 O . Most of
2
the 16 O probably scatters forward through high-impact-parameter collisions, but the lim-
2
ited constraints on the θc.m. ∼ 0◦ angular distribution (e.g., the laboratory-frame angular
distribution, which only probes Θ = 6◦ ) increase the uncertainty in that part of the c.m.
angular distribution.
The experiment mainly observed 12 C18 O scattered opposite its initial direction in the
2
c.m. frame (see Newton diagram in Figure 3.2). Detected 12 C18 O products (m/z = 48)
2
showed best-fit c.m. translational energy distributions that were both broader and lower in
energy, on average, than that obtained for forward-scattered 16 O . A single pair of P(ET )
2
and T(θc.m. ) distributions was not sufficient to describe the m/z = 48 TOF distributions
(see Sections 4.4.2.1 and 4.5.2), and a second pair of P(ET ) and T(θc.m. ) distributions was
93L. Y. Yeung Oxygen isotope exchange reactions of CO2 Chapter 3
included in the fit; five representative laboratory-frame TOF distributions, the c.m. an-
gular and translational energy distributions, and the laboratory-frame angular distribution
obtained from 12 C18 O product detection are shown in Figure 3.17, along with the c.m.
2
velocity-flux diagram in Figure 3.18. The first P(ET ) and T(θc.m. ) pair for inelastically scat-
tered 12 C18 O
2 described the scattering at θc.m. < 125◦ . In this region, the angular distribu-
tion was peaked near θc.m. = 60◦ , though the probability of scattered products was roughly
constant for 0◦ < θc.m. < 40◦ . The probability of finding these products decayed steadily
at θc.m. > 60◦ . The corresponding translational energy distribution was peaked at 60 kcal
mol−1 with an average hET i = 62.8 kcal mol−1 , or 40% the available energy. The second
P(ET ) and T(θc.m. ) pair for inelastically scattered 12 C18 O2 described the scattering at 60◦ <
θc.m. < 125◦ (corresponding to the maximum θc.m. observed in the experiment), although
there was a small component 0◦ < θc.m. < 60◦ . This angular distribution overlapped, in
the sideways-scattering region, with the first pair. For θc.m. > 60◦ the distribution increased
rapidly until it peaked near θc.m. = 120◦ and decayed quickly at θc.m. > 120◦ . This part
of the distribution, however, is uncertain because our experiment did not probe it directly.
The translational energy distribution was peaked at 103 kcal mol−1 with an average hET i =
100.8 kcal mol−1 , or 64% the available energy.
The similarity in product c.m. angular and translational energy distributions in the
O2 + CO2 system and the O(3 P) + CO2 system (see Sections 4.4.2.1 and 4.5.2) suggests
that the collisional energy transfer mechanism is similar in both cases. Ryali et al. [1982]
found that CO2 collisions with N2 , O2 , and Ar near at high collision energies all had similar
translational-to-vibrational energy transfer cross-sections for the excitation of CO2 (ν3 ), so
they suggested that energy transfer sampled the repulsive part of the intermolecular po-
tential in all cases. Transfer of vibrational energy from O2 to CO2 cannot be ruled out in
our experiments because we did not characterize the vibrational temperature of the hyper-
thermal O2 . Consequently, the similarity in inelastic scattering dynamics of O(3 P) and O2
collisions with CO2 could also be coincidental.
94L. Y. Yeung Oxygen isotope exchange reactions of CO2 Chapter 3
Figure 3.16: Laboratory scattering data detected at m/z = 32. (A) Laboratory TOF,
(B) c.m. translational energy, and (C) c.m. and (D) laboratory angular distributions for
scattered 16 O2 products from 16 O2 + 12 C18 O2 collisions at hEcoll i = 158.1 kcal mol−1 . The
circles in (A) and (D) are experimental data, while the lines (orange and brown) are the
best-fit forward-convolution simulations of the experimental data derived from the c.m.
translational energy and angular distributions shown in (B) and (C), respectively. The error
bars in (D) represent 2σ uncertainties in the integrated experimental TOF distributions (see
Appendix 4.7). These data indicate that 16 O2 is scattered mainly in the forward direction
with little change in its initial direction or velocity.
95L. Y. Yeung Oxygen isotope exchange reactions of CO2 Chapter 3
Figure 3.17: Laboratory inelastic scattering data detected at m/z = 48. (A) Laboratory
TOF, (B) c.m. translational energy, and (C) c.m. and (D) laboratory angular distributions
for inelastically scattered 12 C18 O2 products from 16 O2 + 12 C18 O2 collisions at hEcoll i = 158.1
kcal mol−1 . The circles in (A) and (D) are experimental data, while the lines are the best-fit
forward-convolution simulations of the experimental data derived from the c.m. transla-
tional energy and angular distributions shown in (B) and (C), respectively. The error bars
in (D) represent 2σ uncertainties in the integrated experimental TOF distributions (see Ap-
pendix 4.7). The dark blue and cyan lines correspond to products of 16 O(3 P) + 12 C18 O2
collisions, and they are discussed in Section 4.4.2.1. A single c.m. translational energy
and angular distribution for each collision partner was insufficient to describe the TOF dis-
tributions of inelastically scattered 12 C18 O2 , suggesting a scattering dependence on impact
parameter.
96L. Y. Yeung Oxygen isotope exchange reactions of CO2 Chapter 3
Figure 3.18: Velocity-flux contour diagram for inelastically scattered 12 C18 O2 from 16 O2
+ 12 C18 O2 collisions in the center-of-mass frame. The white arrows are the initial 16 O2
and 12 C18 O2 velocity vectors and dashed white line is the maximum recoil velocity for
12 C18 O (v
2 max ). Only the c.m. angles for which the experiment were sensitive are shown; in-
elastically scattered 12 C18 O2 from high-impact-parameter collisions are not shown, as their
flux would be off-scale. Strong coupling of the P(ET ) and T(θ c.m. ) distributions was ob-
served.
97L. Y. Yeung Oxygen isotope exchange reactions of CO2 Chapter 3
3.B MATLAB program for generating Newton diagrams
A series of programs (linked as functions) was written in MATLAB so meaningful Newton
diagrams could be generated with little effort. This proved to be quite useful during data
analysis because the program could display expected product times-of-flight, speeding up
the forward-convolution fitting process considerably. The programs included here (New-
tonD.m, NewtonDcalc.m, and NewtonDplot.m) use parameters specific to the MSU crossed-
beam apparatus, but the code is general and the parameters adjustable for use with any
crossed-beam apparatus with arbitrary crossing angle. Figure 3.19 shows a sample input
and output.
Figure 3.19: Sample output of the NewtonD.m program. Predicted c.m. angles are
defined relative to the slow product’s c.m. velocity vector.
3.B.1 NewtonD.m
% Program for generating Newton diagrams for molecular scattering.
% Command line input is NewtonD(observed,labangle)
function NewtonD(observed, labangle)
clear m1 m2 v1 v2 theta e DEint
observed=observed; % observed product (1 or 2) as inputted below
labangle=labangle; % lab angle of observation relative to initial v1
% vector, in degrees
98L. Y. Yeung Oxygen isotope exchange reactions of CO2 Chapter 3
% Begin input section
m1=16; % mass of particle 1 in g/mol
v1=8262; % initial velocity of particle 1 in m/s
m2=48; % mass of particle 2 in g/mol
v2=800; % initial velocity of particle 2 in m/s
theta=0.5; % angle between v1 and v2 in pi radians, e.g. 0.5 −−> 0.5*pi
% = 90 degrees
e=0.5; % elastic scattering efficiency 0 < e ≤ 1)
DEint=0; % gain of internal energy upon reaction in kcal/mol
mp1=16; % mass of product 1 in g/mol
mp2=48; % mass of product 2 in g/mol
minangle=6; % minimum lab angle relative to v1 vector, in degrees
maxangle=54; % maximum lab angle relative to v1 vector, in degrees
length=33.66; % distance between interaction region and ionizer in cm
if observed == 1
IFT=0;2.44*sqrt(mp1); % ion flight time (delay) in microseconds
else if observed == 2
IFT=0;2.44*sqrt(mp2);
end
end
delec=0;3; % electronics delay in microseconds
dlaser=0;174; % laser firing delay in microseconds
otravel=0;(0.99/v1)*10ˆ6; % O−atom travel time from nozzle to
% interaction region in microseconds
% End input section
% Input error check
if observed 6= 1 && observed 6= 2
disp('Invalid input, "observed" must equal 1 or 2');
return;
end
% Begin calculations
hold off
format short g
disp('Observed m/z'); % Display observed mass
if observed == 1
disp(mp1);
else if observed == 2
disp(mp2);
end
end
disp('Lab angle (degrees)');
disp(labangle);
99L. Y. Yeung Oxygen isotope exchange reactions of CO2 Chapter 3
disp('Predicted center−of−mass angles (degrees)');
disp(' Fast channel | Slow channel');
% Iterate; first round includes specified change in internal energy,
% second round sets the internal energy change to zero, i.e.
% elastic scattering.
for i = 1:2
[vc, thetavc, vrel, u1, u2, vrelp, up1, up2, Ecoll, phi, vd, chi]=
NewtonDcalc(m1, m2, v1, v2, theta, e, DEint, mp1, mp2, labangle,
observed);
NewtonDplot(v1, v2, vc, thetavc, up1, up2, e, minangle, maxangle,
labangle, vd, length, IFT, delec, dlaser, otravel, chi);
if DEint == 0
return;
else
DEint=0;
end
end
disp('Collision Energy (kcal/mol)');
disp(Ecoll);
3.B.2 NewtonDcalc.m
% Function for calculating center−of−mass quantities
function [vc, thetavc, vrel, u1, u2, vrelp, up1, up2, Ecoll, phi, vd,
chi]=NewtonDcalc(m1, m2, v1, v2, theta, e, DEint, mp1, mp2,
labangle, observed)
% reactant parameters
mu=m1*m2/(m1+m2); % reduced mass
vc=sqrt((m1/(m1+m2)*v1)ˆ2+(m2/(m1+m2)*v2)ˆ2); % CM velocity
vrel=sqrt(v1ˆ2+v2ˆ2−2*v1*v2*cos(theta*pi)); % relative velocity
u1=m2/(m1+m2)*vrel; % velocity of particle 1
% in CM frame
u2=m1/(m1+m2)*vrel; % velocity of particle 2
% in CM frame
thetavc=asin((u2/vc)*(v1/vrel)*sin(theta*pi)); % angle between CM
% velocity and v2
Ecoll=(1/2)*mu/1000*vrelˆ2/4.184/1000; % CM collision energy
% reactive product parameters
mup=mp1*mp2/(mp1+mp2); % reduced mass
vrelp=sqrt(((mu/1000)*vrelˆ2−2*(DEint*1000*4.184))/(mup/1000));
%relative velocity
up1=mp2/(mp1+mp2)*vrelp; % velocity of product 1
% in CM frame
up2=mp1/(mp1+mp2)*vrelp; % velocity of product 2
% in CM frame
phi=labangle*pi/180−(theta*pi−(thetavc)); % angle between lab
% detection vector and
% CM velocity
% case structure determining output parameters
if observed == 1
100L. Y. Yeung Oxygen isotope exchange reactions of CO2 Chapter 3
up=up1; u=u1; v=v1;
else if observed == 2
up=up2; u=u2; v=v2;
end
end
% product velocity in lab frame with case structure for removal of
% imaginary roots.
if imag(roots([1 −2*vc*cos(phi) vcˆ2−(up*sqrt(e))ˆ2])) == 0
vd=roots([1 −2*vc*cos(phi) vcˆ2−(up*sqrt(e))ˆ2]);
% Solve for product velocity observed at detector
if vd(1) ≤ 0 && vd(2) ≤ 0
vd(1)=0;
vd(2)=0;
else if vd(1) > 0 && vd(2) ≤ 0
vd(2)=0;
else if vd(1) < 0 && vd(2) > 0
vd(1)=0;
end
end
end
% Product scattering angle relative to CM velocity vector of reactant 2
if phi > 0
chi=(acos((diag(vd*vd')−vcˆ2−diag(up*up')*e)/(−2*vc*up*sqrt(e)))−
asin(v2/u2*sin(thetavc)))*180/pi;
else
chi=360−(acos((diag(vd*vd')−vcˆ2−diag(up*up')*e)/(−2*vc*up*sqrt(e)))+
asin(v2/u2*sin(thetavc)))*180/pi;
end
if imag(chi(1)) 6= 0
chi(1) = 0;
end
if imag(chi(2)) 6= 0
chi(2) = 0;
end
if chi(1) > 180
chi(1)= chi(1)−360;
end
if chi(2) > 180
chi(2)= chi(2)−360;
end
% In case of imaginary roots
else
vd(1,1)=10000;
vd(2,1)=10000;
chi=1;
disp(' N/A N/A') % Display lack of solutions
end
%((1/2)*(mp1/1000)*(up1)ˆ2*e)/4184 % CM Translational energy of
% product 1
%((1/2)*(mp2/1000)*(up2)ˆ2*e)/4184 % CM Translational energy of
% product 2
3.B.3 NewtonDplot.m
101L. Y. Yeung Oxygen isotope exchange reactions of CO2 Chapter 3
function NewtonDplot(v1, v2, vc, thetavc, up1, up2, e, minangle,
maxangle, labangle, vd, length, IFT, delec, dlaser, otravel, chi)
% Messy plotting code for pretty pictures
x1 = vc*cos(thetavc);
y1 = vc*sin(thetavc);
N=256; t=(0:N)*2*pi/N;
plot(sqrt(e)*up2*cos(t)+x1, sqrt(e)*up2*sin(t)+y1, '−.r');
% Newton circle for product 2
hold on
grid on
plot(sqrt(e)*up1*cos(t)+x1, sqrt(e)*up1*sin(t)+y1, '−.b');
% Newton circle for product 1
legend('Particle 2', 'Particle 1')
% text(1,1,'Collision energy = \Ecoll kcal/mol')
x0 = 0;
y0 = 0;
x1 = 0;
y1 = v1;
plot([x0;x1],[y0;y1]) % Particle 1
alpha = 0.05; % Size of arrow head relative to the length of
% the vector
beta = 0.2; % Width of the base of the arrow head relative to
% the length
hu = [x1−alpha*((x1−x0)+beta*((y1−y0)+eps)); x1; x1−alpha*
((x1−x0)−beta*((y1−y0)+eps))];
hv = [y1−alpha*((y1−y0)−beta*((x1−x0)+eps)); y1; y1−alpha*
((y1−y0)+beta*((x1−x0)+eps))];
plot(hu(:),hv(:)) % Plot arrow head
x0 = 0;
y0 = 0;
x1 = v2;
y1 = 0;
plot([x0;x1],[y0;y1],'r') % Particle 2
alpha = 0.4; % Size of arrow head relative to the length of
% the vector
beta = 0.5; % Width of the base of the arrow head relative to
% the length
hu = [x1−alpha*((x1−x0)+beta*((y1−y0)+eps)); x1; x1−alpha*
((x1−x0)−beta*((y1−y0)+eps))];
hv = [y1−alpha*((y1−y0)−beta*((x1−x0)+eps)); y1; y1−alpha*
((y1−y0)+beta*((x1−x0)+eps))];
plot(hu(:),hv(:),'r') % Plot arrow head
x0 = v2;
y0 = 0;
x1 = 0;
y1 = v1;
plot([x0;x1],[y0;y1],'m') % vrel
alpha = 0.05; % Size of arrow head relative to the length of
% the vector
beta = 0.2; % Width of the base of the arrow head relative to
102L. Y. Yeung Oxygen isotope exchange reactions of CO2 Chapter 3
% the length
hu = [x1−alpha*((x1−x0)+beta*((y1−y0)+eps)); x1; x1−alpha*
((x1−x0)−beta*((y1−y0)+eps))];
hv = [y1−alpha*((y1−y0)−beta*((x1−x0)+eps)); y1; y1−alpha*
((y1−y0)+beta*((x1−x0)+eps))];
plot(hu(:),hv(:),'m') % Plot arrow head
x0 = 0;
y0 = 0;
x1 = vc*cos(thetavc);
y1 = vc*sin(thetavc);
plot([x0;x1],[y0;y1],'g') % vc
alpha = 0.1; % Size of arrow head relative to the length of
% the vector
beta = 0.25; % Width of the base of the arrow head relative to
% the length
hu = [x1−alpha*((x1−x0)+beta*((y1−y0)+eps)); x1; x1−alpha*
((x1−x0)−beta*((y1−y0)+eps))];
hv = [y1−alpha*((y1−y0)−beta*((x1−x0)+eps)); y1; y1−alpha*
((y1−y0)+beta*((x1−x0)+eps))];
plot(hu(:),hv(:),'g') % Plot arrow head
x1=10000*sin(minangle*pi/180);
y1=10000*cos(minangle*pi/180);
plot([0;x1],[0;y1],'k') % minimum lab angle
x1=10000*sin(maxangle*pi/180);
y1=10000*cos(maxangle*pi/180);
plot([0;x1],[0;y1],'k') % maximum lab angle
if chi == 1
return
else if chi 6= 1
x1=vd*sin(labangle*pi/180);
y1=vd*cos(labangle*pi/180);
plot([0;x1],[0;y1],'k') % observed lab angle
x0=vc*cos(thetavc);
y0=vc*sin(thetavc);
x1=vd*sin(labangle*pi/180);
y1=vd*cos(labangle*pi/180);
plot([x0;x1],[y0;y1],'k') % center−of−mass scattering
end
end
xlabel('Velocity of Particle B (m/s)')
ylabel('Velocity of Particle A (m/s)')
axis([−9000 11000 −5500 9500])
% Relevant quantities
disp(chi');
if vd(1) == 0 && vd (2) == 0
TOF=[0 0];
else if vd(1) == 0
TOF=[((length/100)/vd(1))*10ˆ6 0]; % Predicted TOF times in
% microseconds
103L. Y. Yeung Oxygen isotope exchange reactions of CO2 Chapter 3
else if vd(2) == 0
TOF=[((length/100)/vd(1))*10ˆ6 0]; % Predicted TOF times in
% microseconds
else if vd(1) == 10000 && vd(2) == 10000
TOF=[0 0];
else if vd(1) > 0 && vd(2) > 0
% Predicted TOF times in microseconds
TOFfast=((length/100)/vd(1))*10ˆ6;
TOFslow=((length/100)/vd(2))*10ˆ6;
TOF=[TOFfast TOFslow];
end
end
end
end
end
% Display TOF on graph next to Newton circle
text(x1(1),y1(1),[' \leftarrow ',num2str(round(TOF(1)+IFT+delec+dlaser+
otravel)), ' \mus'],'FontSize',14)
% Only display second TOF value if there is a product to display
if TOF(2) 6= 0
text(x1(2),y1(2),[' \leftarrow ',num2str(round(TOF(2)+IFT+delec+
dlaser+otravel)), ' \mus'],'FontSize',14)
else
return
end
104You can also read