Comparison of lightning activity in the two most active areas of the Congo Basin
←
→
Page content transcription
If your browser does not render page correctly, please read the page content below
Nat. Hazards Earth Syst. Sci., 18, 479–489, 2018
https://doi.org/10.5194/nhess-18-479-2018
© Author(s) 2018. This work is distributed under
the Creative Commons Attribution 3.0 License.

Comparison of lightning activity in the two most
active areas of the Congo Basin
Jean K. Kigotsi1,2 , Serge Soula1 , and Jean-François Georgis1
1 Laboratoire   d’Aérologie, Université de Toulouse, CNRS, Toulouse, France
2 Département    de Physique, Faculté des Sciences, Université de Kinshasa, Kinshasa, Democratic Republic of Congo

Correspondence: Jean K. Kigotsi (jeankigotsi@gmail.com) and Serge Soula (serge.soula@aero.obs-mip.fr)

Received: 16 March 2017 – Discussion started: 12 June 2017
Revised: 27 October 2017 – Accepted: 14 December 2017 – Published: 13 February 2018

Abstract. A comparison of the lightning activity in the two      tion/regeneration of mesoscale convective systems (MCSs)
most active areas (Area_max for the main maximum and             in relation to the phase of Kelvin waves.
Area_sec for the secondary maximum) of the Congo Basin
is made with data obtained by the World Wide Lightning Lo-
cation Network (WWLLN) during 2012 and 2013. Both ar-
                                                                 1   Introduction
eas of same size (5◦ × 5◦ ) exhibit flash counts in a ratio of
about 1.32 for both years and very different distributions of    According to several studies about the lightning climatol-
the flash rate density (FRD) with maximums in a ratio of 1.94    ogy around the Earth, the Congo Basin is considered as the
and 2.59 for 2012 and 2013, respectively. The FRD is much        most active region with either a large maximum or two dis-
more widely distributed in Area_sec, which means the whole       tinct ones (Christian et al., 2003; Williams and Sátori, 2004;
area contributes more or less equal to the lightning activity.   Albrecht et al., 2011, 2016; Cecil et al., 2014; Soula et al.,
The diurnal cycle is much more pronounced in Area_max            2016). Actually, the features of the maximum area depend
than in Area_sec with a ratio between the maximum and the        on the spatial resolution considered in the calculation of
minimum of 15.4 and 4.7, respectively. However, the min-         the flash rate density (FRD) and the scale resolution in the
imum and maximum of the hourly flash rates are observed          graphic representation. Albrecht et al. (2016) performed a
roughly at the same time in both areas, between 07:00 and        very detailed analysis of FRD thanks to Lightning Imaging
09:00 UTC and between 16:00 and 17:00 UTC, respectively.         Sensor (LIS) data around the Earth by using several spatial
In Area_sec the proportion of days with low lightning rate       resolutions. They showed the features of the maxima FRD
(0–1000 flashes per day) is much larger (∼ 45 % in 2013)         strongly depend on the spatial resolution and on the dura-
compared to Area_max (∼ 23 % in 2013). In Area_max the           tion of the period considered for the study. Thus, the location
proportion of days with moderate lightning rate (1001–6000       and the value of the first- and second-ranked maxima FRD
flashes per day) is larger (∼ 68.5 % in 2013) compared to        stabilize when the period is longer. With the better resolu-
Area_sec (∼ 46 % in 2013). The very intense convective           tion (0.1◦ ) used in Albrecht et al. (2016), the second-ranked
events are slightly more numerous in Area_sec. In summary,       hotspot is always located around [28◦ E, 2◦ S] from 5 years
the thunderstorm activity in Area_sec is more variable at dif-   of data. Furthermore, they showed most of the first 10 light-
ferent scales of time (annually and daily), in intensity and     ning hotspots over the entire African continent, including
in location. Area_max combines two favourable effects for        the strongest ones, are located in Democratic Republic of
thunderstorm development, the convergence associated with        Congo (DRC). By considering the maps of FRD in Albrecht
the African easterly jet of the Southern Hemisphere (AEJ-        et al. (2016), the existence of two regions of maximum ac-
S) and a geographic effect due to the orography and the          tivity in DRC is displayed, but the non-linear scale does not
presence of a lake. The location of the strong convection in     allow a quantitative comparison of the maximum values.
Area_sec is modulated by the distance of westward propaga-

Published by Copernicus Publications on behalf of the European Geosciences Union.
480                                                 J. K. Kigotsi et al.: Comparison of lightning activity in the Congo Basin

   Cecil et al. (2014) provided two maps of lightning flash        2   Data and methodology
density from the Lightning Imaging Sensor (LIS) and Opti-
cal Transient Detector (OTD) data with different resolution,       By following the study by Soula et al. (2016), we define two
0.5 and 2.5◦ , and a non-linear scale. With a 0.5◦ resolution,     areas of the same extent: one for the main maximum consid-
two maxima are distinguished in the region of Congo Basin          ered as “Area_max” and the other for the secondary maxi-
and only one with a 2.5◦ resolution. Two separated maxima          mum considered as “Area_sec”. They are identified by lati-
are also visible in the study by Christian et al. (2003) with a    tude and longitude values in the following intervals:
resolution of 0.5◦ and a non-linear scale of density. However,
                                                                        [25◦ E, 30◦ E] and [4◦ S, 1◦ N] for Area_max
in the latter study, neither maximum remains throughout the
year in considering the lightning activity with 3-month sea-            [18◦ E, 23◦ E] and [4◦ S, 1◦ N] for Area_sec.
sons. Recently, Soula et al. (2016) showed a very pronounced
maximum in the annual and seasonal lightning flash density            We use data from the WWLLN for the present study.
in the eastern Democratic Republic of Congo (DRC) from             The WWLLN (www.wwlln.net/) is a global lightning detec-
World Wide Lightning Location Network (WWLLN) data                 tion network around the Earth. The electromagnetic radiation
with a 0.1◦ resolution and a linear scale. In this study, a        emitted by lightning strokes (from cloud-to-ground and intr-
secondary maximum was also highlighted west of the main            acloud flashes) at very low frequency (VLF) and called sfer-
maximum, especially during the first part of the 9-year period     ics are detected by the sensors of the WWLLN (Abarca et al.,
of study. This secondary maximum was less pronounced and           2011). These strokes are then localized by using the time of
scattered over a large area. In this study the region of max-      group arrival technique (TOGA) (Dowden et al., 2002). The
imum activity could be analysed in detail because the lin-         stations can be separated by thousands of kilometres because
ear scale for flash density was better adapted for large values    VLF frequencies can propagate within the Earth–ionosphere
compared to previous studies.                                      wave guide with very little attenuation. Since its implemen-
   The results of Soula et al. (2016) provided the following       tation in March 2003, the WWLLN has been improved in
characteristics. The main maximum in lightning flash den-          terms of number of stations and development of the process-
sity is observed every year in one small region of the DRC,        ing algorithm (Rodger et al., 2008). In order to give an idea
at about 28◦ E and between 1 and 2◦ S. This maximum is             of the growth of the number of WWLLN stations spread on
embedded within a region of large values of lightning flash        the planet, they numbered 11 in 2003, then 23 in 2005, 30
density, strongly contrasting with the whole study area. The       in 2007, and 67 in 2013, according to the report made by
geographical extent of this region is approximately 300 km         Rodger et al. (2014). Thus, the changes in the network during
north–south and 200 km east–west. It is located in the area        this 10-year period (2003–2013) can explain the continuous
where many authors identified the maximum of planetary             increase in the detection efficiency (DE) observed by Soula
lightning activity: Christian et al. (2003), who falsely at-       et al. (2016) in the total domain of the study. According to
tributed it to Rwanda; Cecil et al. (2014); and Albrecht et        Abarca et al. (2011), DE for CG flashes is about twice that
al. (2011). The high spatial resolution and the linear scale       for IC flashes.
used in Soula et al. (2016) allowed a better localization and         We analyse the DE evolution during this period for each
specification of its shape and amplitude characteristics. In ad-   area. For this purpose and in the same way as Soula et
dition, the maximum number of days with thunderstorms has          al. (2016) for the whole Congo Basin area, Fig. 1 displays
been found in the same area (189 days of storms in 2013)           the annual numbers of lightning flashes detected by WWLLN
as the average number of flashes per day of storms (approx-        and LIS in Area_max and Area_sec during the period 2005–
imately 8 flashes per day). Another area of large flash den-       2013. In the same graph, the values of the WWLLN DE rel-
sity considered as a secondary maximum was pointed out in          ative to the LIS data, are reported for each area. DE is cal-
Soula et al. (2016). This area was broader but less contrasting    culated by following the methodology developed by Soula
from year to year during the period of the study. It extends       et al. (2016), i.e. by applying the correction coefficient for
roughly from the centre of DRC to Congo to the west and to         the estimation of the number of the whole lightning flashes
Angola to the south.                                               LIS could detect with a continuous survey. First, the number
   The goal of this study is to compare the characteristics of     of flashes detected by LIS in each area does not vary much
lightning activity in the two areas of maximum activity. The       during the period, it is always larger in Area_max, its mini-
second section describes the data and the methodology used,        mum is observed for 2007 in each area and more pronounced
the third section presents the results from several compar-        for Area_sec, and the maximum is observed for 2005 in each
isons, and the fourth section is devoted to a discussion.          area too. Thus, no increase tendency is observed in each area.
                                                                   Secondly, the number of flashes detected by WWLLN in
                                                                   each area increases after 2008, especially during the last 2
                                                                   years, 2012 and 2013. As a consequence, DE is significantly
                                                                   larger for 2012 and 2013, and reaches 4.96 and 7.50 % in
                                                                   Area_max, respectively, and 4.24 and 6.11 % in Area_sec.

Nat. Hazards Earth Syst. Sci., 18, 479–489, 2018                            www.nat-hazards-earth-syst-sci.net/18/479/2018/
J. K. Kigotsi et al.: Comparison of lightning activity in the Congo Basin 481
20
NW Area_max
10 NL Area_max
NL Area_sec 15
8
NW (x 10 ) - DE (%)
DE Area_max
NL (10 )
3
DE Area_sec
5
6
10
4
NW Area_sec NL Area_max
NL Area_sec 5
2 NW Area_max
NW Area_sec
DE Area_max
DE Area_sec
0 0
2005 2006 2007 2008 2009 2010 2011 2012 2013
Figure 1. Annual number of flashes detected by the WWLLN (NW ) and that detected by LIS (NL ) for each area, and estimated detection
efficiency (DE) for WWLLN data relative to LIS data, according to the methodology developed in Soula et al. (2016).
This increase in DE is completely independent of the number Table 1. Flash count and flash density in both areas.
of flashes detected by LIS that is relatively stable during the
last years, which means it is totally related to the WWLLN Maximum
performance. According to the DE values, we select the last FRD
2 years of the period (2012 and 2013) for a comparison of Flash count (fl yr−1 km−2 )
the characteristics of the lightning activity in Area_max and 2012 2013 2012 2013
Area_sec. Area_max 696 144 1 000 687 8.6 15.3
Area_sec 526 278 760 405 4.4 5.9
ratio 1.32 1.32 1.94 2.59
3 Results
3.1 Spatial distribution of the lightning activity
By comparing with the values reported by Soula et al. (2016)
Figure 2a–b show the annual FRD, in flashes (fl) km−2 yr−1 , at a resolution of 0.1◦ , it is clear that the maximum of the an-
calculated with a resolution of 0.05◦ from WWLLN data in nual FRD is larger for 0.05◦ . Indeed, it is 12.86 fl km−2 yr−1
the large domain of the Congo Basin for 2012 and 2013, re- at 0.1◦ and 15.33 fl km−2 yr−1 at 0.05◦ in 2013, and it is
spectively. Figure 2c–d show the number of days of the year 8.22 fl km−2 yr−1 at 0.1◦ and 8.62 fl km−2 yr−1 at 0.05◦ in
with lightning activity in the same domain with the same res- 2012. On the other hand, the maximum number of stormy
olution for 2012 and 2013, respectively. The white frames days is lower with the resolution of 0.05◦ , from 189 to 125
indicate the two areas with strong activity (left Area_sec and days for 2013 and from 167 to 99 days for 2012. This obser-
right Area_max). Table 1 displays the flash count, the max- vation is consistent since a day is stormy when at least one
imum FRD for both areas and for each year. Both areas of flash is detected in the pixel.
same size (5◦ × 5◦ ) exhibit total flash counts in a ratio of The difference between the distributions in the two areas
about 1.32 for both years, which indicates a stable situation clearly appears regarding both lightning FRD and number of
from one year to the next. However, the ratio of the maxi- days of the year with lightning activity in Fig. 2. Indeed, the
mum FRD is very different from one year to the next, since highest values of both parameters are located in the same re-
it is 1.94 and 2.59 for 2012 and 2013, respectively. This dif- gion of the 5◦ × 5◦ frame for Area_max, while they are much
ference can be easily understood since the maximum value is more scattered in the frame for Area_sec. The difference be-
very localized and can change substantially from one year to tween both areas is stronger for FRD compared to the num-
the next, and furthermore the spatial density resolution used ber of days with thunderstorms, which means that the num-
in the study is very high, with a value of 0.05◦ . The maximum ber of flashes per stormy day is larger for Area_max. This
value of the FRD depends on the spatial resolution, in the means that the storms in Area_max are more active and/or
sense that it increases when the resolution becomes higher. more stationary, and/or more numerous (Soula et al., 2016).
www.nat-hazards-earth-syst-sci.net/18/479/2018/ Nat. Hazards Earth Syst. Sci., 18, 479–489, 2018482 J. K. Kigotsi et al.: Comparison of lightning activity in the Congo Basin
Figure 2. (a, b) Lightning FRD in fl km−2 yr−1 calculated at a resolution of 0.05◦ from WWLLN data in the area of Congo Basin for 2012
and 2013, respectively. (c, d) Number of days of the year with thunderstorm activity in the same area with a resolution of 0.05◦ for 2012 and
2013, respectively. The white frames indicate the two zones with strong activity (left, Area_sec; right, Area_max).
The differences observed in the maximum values and the dis- between 16:00 and 17:00 UTC for Area_max and for both
tributions of the lightning FRD indicate specific conditions years and for Area_sec in 2013, and between 17:00 and
for the thunderstorm development in Area_max. These con- 19:00 UTC for Area_sec in 2012. The contrast in flash counts
ditions are the presence of a mountain range that exceeds between the morning minimum and the afternoon maximum
3000 m (28.75◦ E, 1.5–2.2◦ S), on the west side of which the is stronger for Area_max (ratio of 14.5 and 15.4, for 2012
FRD increases markedly, and the presence of the Lake Kivu and 2013, respectively) than for Area_sec (ratio of 6.2 and
(29.2◦ E, 1.9◦ S), above which the FRD increases (Soula et 4.7, for 2012 and 2013, respectively). It means the diurnal
al., 2016). No specific shape of the FRD or stormy day is cycle is much more pronounced in Area_max. Consequently,
visible in Area_sec. while the lightning flash rate is larger in Area_max for the
main part of the day, it is lower during a short interval be-
3.2 Daily cycle tween 06:00 and 10:00 UTC corresponding to the minimum
activity in both areas.
Figure 3 shows the daily cycle of the flashes detected by the
WWLLN in Area_max and Area_sec, for 2012 and 2013. 3.3 Day-to-day variability
The time is indicated in UTC, which is 2 h late compared to
local time (LT = UTC + 2). These flash counts are calculated We compare the lightning activity in both areas in terms of
over 1 h and averaged over all days of the year. The timescale daily distribution of flashes detected during 1 year. The years
of the graph is made so that the flashes are associated with of reference are 2012 and 2013 with a total of 366 and 362
the beginning of the 1 h period of calculation. Both areas ex- days, respectively, available in the database. The flash count
hibit the same type of diurnal lightning activity with a large is performed day by day in each area and then the days are
proportion of flashes during the afternoon and whatever the classified by range of flash numbers. Thus, Table 2 displays
year. The minimum and maximum numbers of flashes are ob- the result of the classification for each area and each year,
served roughly at the same time in both areas. The minimum over 12 classes of flash number. This result is expressed in
is observed in the morning between 08:00 and 09:00 UTC for terms of number of days for each area and year, and in pro-
Area_max and between 07:00 and 08:00 UTC for Area_sec, portion (%) of the total number of days for the year in each
for both years. The maximum is observed in the afternoon, area. The range of each class is over 1000 flashes, except for
Nat. Hazards Earth Syst. Sci., 18, 479–489, 2018 www.nat-hazards-earth-syst-sci.net/18/479/2018/J. K. Kigotsi et al.: Comparison of lightning activity in the Congo Basin 483
Table 2. Number of days corresponding to lightning classes in the two study areas during the 2012 (366 days) and 2013 (362 days). The
percentage is calculated in relation to the total number of days during the year.
Flash number CLASS Number of days (%)
2012 2013
Area_max Area_sec Area_max Area_sec
0–100 CL0 7 (1.91) 59 (16.12) 4 (1.10) 43 (11.88)
101–1000 CL1 121 (33.06) 130 (35.52) 80 (22.10) 121 (33.43)
1001–2000 CL2 99 (27.05) 68 (18.58) 79 (21.82) 58 (16.02)
2001–3000 CL3 73 (19.94) 52 (14.21) 70 (19.34) 52 (14.36)
3001–4000 CL4 30 (8.20) 24 (6.56) 43 (11.88) 29 (8.01)
4001–5000 CL5 16 (4.37) 17 (4.64) 38 (10.50) 17 (4.70)
5001–6000 CL6 10 (2.73) 7 (1.91) 18 (4.97) 12 (3.31)
6001–7000 CL7 4 (1.09) 4 (1.09) 12 (3.31) 11 (3.04)
7001–8000 CL8 2 (0.55) 1 (0.27) 7 (1.93) 10 (2.76)
8001–9000 CL9 4 (1.09) 1 (0.27) 2 (0.55) 2 (0.55)
9001–10 000 CL10 0 (0.00) 0 (0.00) 2 (0.55) 2 (0.55)
> 10 000 CL11 0 (0.00) 0 (0.00) 7 (1.93) 5 (1.38)
Total 366 (100) 366 (100) 362 (100) 362 (100)
(a) Area_max Area_sec flashes. To make the interpretation of the results easier, they
10 are also plotted in Fig. 4.
2012 The distribution is similar for both years, (a) for 2012 and
Flash number (104)
8
(b) for 2013. The number of days in CL0 is much larger for
6 Area_sec than for Area_max (59 and 7, respectively, in 2012,
43 and 4 in 2013), as indicated in Table 2. For CL1, cor-
4
responding to the flash numbers 101–1000, the number of
2 days is also larger for Area_sec, with 130 days in 2012 and
121 in 2013, compared to Area_max, which has 121 days in
0
2012 and 80 days in 2013. On the other hand, the number
00:00
01:00
02:00
03:00
04:00
05:00
06:00
07:00
08:00
09:00
10:00
11:00
12:00
13:00
14:00
15:00
16:00
17:00
18:00
19:00
20:00
21:00
22:00
23:00
of days for classes corresponding to intermediate flash num-
Time (UTC) bers (CL2 to CL4 in 2012, CL2 to CL6 in 2013) is signifi-
cantly larger for Area_max, for both the cumulative number
(b) Area_max Area_sec of days (202 compared to 144 in 2012 and 248 compared to
10
168 in 2013) and for each class considered separately. For
2013
the classes with a very high activity (CL5 to CL11 and CL7
Flash number (104)
8
to CL11, in 2012 and 2013, respectively) the total number
6 of days is small and not very different in both areas (36 and
4 30 in 2012, 20 and 30 in 2013, for Area_max and Area_sec,
respectively).
2 From 2012 to 2013, for both areas, the proportion of the
0 number of day decreases in the first three classes (CL0–CL2)
00:00
01:00
02:00
03:00
04:00
05:00
06:00
07:00
08:00
09:00
10:00
11:00
12:00
13:00
14:00
15:00
16:00
17:00
18:00
19:00
20:00
21:00
22:00
23:00
and for the cumulative value it is ∼ 62 % in 2012 and ∼ 45 %
in 2013 for Area_max, and ∼ 70 % in 2012 and ∼ 61 % in
Time (UTC)
2013 for Area_sec. It is almost equal in CL3: ∼ 20 % in
Figure 3. Daily evolution of the hourly lightning flash counts in 2012 and ∼ 19 % in 2013 for Area_max, and ∼ 14 % in 2012
Area_max and Area_sec for 2012 (a) and 2013 (b). and ∼ 14 % in 2013 for Area_sec. It increases almost in all
classes after CL3, and for cumulative value it is ∼ 18 % in
2012 and ∼ 36 % in 2013 for Area_max, and ∼ 16 % in 2012
and ∼ 25 % in 2013 for Area_sec.
the first two classes CL0 (0–100 flashes) and CL1 (101–1000
flashes). The first class CL0 corresponds to 0–100 flashes
to distinguish the days with a very low number of flashes.
The last class (CL11) groups the days with more than 10 000
www.nat-hazards-earth-syst-sci.net/18/479/2018/ Nat. Hazards Earth Syst. Sci., 18, 479–489, 2018484 J. K. Kigotsi et al.: Comparison of lightning activity in the Congo Basin
20
(a) Area_max Area_sec
(a)
40 R2 = 0.1147
35 2012
Day number (%)
30
Daily flash number in Area_max (10 )
15
3
25
20
15
10
5 10
0
CL0 CL1 CL2 CL3 CL4 CL5 CL6 CL7 CL8 CL9 CL10CL11
Flash class
5
(b) Area_max Area_sec
40
35 2013
Day number (%)
30
0
25 0 5 10 15 20
20 3
Daily flash number in Area_sec (10 )
15
10 20
5 (b) 2
R = 0.0643
0
CL0 CL1 CL2 CL3 CL4 CL5 CL6 CL7 CL8 CL9 CL10CL11
Flash class
Daily flash number in Area_max (10 )
3
15
Figure 4. Distribution of the number of days (% of the annual num-
ber of days) versus the classes of flash number in both areas: (a) for
366 days in 2012 and (b) for 362 days in 2013.
10
3.4 Correlation between daily lightning activities
5
Now we consider the lightning activity for a comparison day
by day of both areas to perform a quantitative correlation.
The goal is to evaluate whether the storm activities in both
areas are simultaneous or shifted in time. In order to illustrate 0
the result about this correlation between lightning activity in 0 5 10 15 20
3
Daily flash number in Area_sec (10 )
Area_max and Area_sec, we display the graph of correlation
between the daily lightning flash amounts for both areas and Figure 5. Diagrams of correlation between daily numbers of light-
in 2013. These daily counts are calculated in two ways, first ning flashes for Area_max and Area_sec in 2013: (a) at calendar
by considering the calendar day (00:00–24 00 UT) and then daily scale (00:00–24:00 UTC) and (b) at lightning activity daily
according to the daily cycle of lightning activity between two scale (06:00–06:00 UTC).
minimums (06:00–06:00 UT; see Fig. 3). Figure 5 shows the
result of this correlation study: (a) for the calendar days and
(b) for the lightning cycle days. Fig. 5b, these values are 6 and 8, respectively, which means
In the first case the correlation coefficient R 2 is ∼ 0.118 there are more days with a large number of lightning flashes
and in the second case it is ∼ 0.064. Thus, the correlation is in Area_sec, by considering the daily cycle of the lightning
weak but positive, that is to say, the tendency is that when the activity. This observation is consistent with the fact that the
daily flash number increases for one area it also increases for lightning activity is more widely distributed during the day
the other. At first glance, both distributions are similar. They in Area_sec as indicated in Fig. 3. This may be due to the
reflect the trend highlighted by Fig. 4 insofar as the low val- contribution of nocturnal lightning by mesoscale convective
ues (≤ 1000 flashes per day) are more numerous in Area_sec. systems (MCSs) or isolated storms that develop later in the
Inversely, the intermediate values (between 1001 and 5000 afternoon if compared to Area_max. Indeed, the work by Al-
flashes per day) are more numerous in Area_max with 230 brecht et al. (2016) shows in their Fig. 3 that during the night,
days in 2013, compared to 156 days for Area_sec. For the the hotspots located in Area_sec (i.e, 6th and 7th Africa’s
values exceeding 10 000 flashes per day, there are 7 days hotspots) exhibit a larger contribution to the daily lightning
for Area_max and 5 days for Area_sec in 2013 (Fig. 5a). In activity. Thus, by considering the day according to the light-
Nat. Hazards Earth Syst. Sci., 18, 479–489, 2018 www.nat-hazards-earth-syst-sci.net/18/479/2018/J. K. Kigotsi et al.: Comparison of lightning activity in the Congo Basin 485
16 than in Area_max, although the distribution is different from
(a) 2012 Area_sec
2012 to 2013 for both areas. For example, in April it is 6.1
14 2012 Area_max
and 11.3 % for Area_max, 5.7 and 9.4 % for Area_sec, in
12
2012 and 2013, respectively. Inversely in May, the propor-
10 tion of each area is much lower in 2013 compared to 2012
Proprtions (%)
8 (4.7 and 8.1 % for Area_max, 7.9 and 13.9 % for Area_sec).
6
For a given month, the respective proportions for Area_max
and Area_sec remain in the same order, except for the first 3
4
months of the year.
2 Figure 6c shows the 3-month proportion over a longer pe-
0 riod including data from 2011. The 3-month periods are cho-
1 2 3 4 5 6 7 8 9 10 11 12 sen according to Christian et al. (2003), Jackson et al. (2009),
Month
and Soula et al. (2016). Thus, the months of June, July,
16
(b) 2013 Area_sec
and August are grouped into JJA; September, October, and
14 2013 Area_max November into SON; December, January, and February into
12
DJF; and March, April, and May into MAM. The annual vari-
ability at this 3-month scale is more visible and constant from
10
one year to the next. Indeed, for both areas, the minimum is
Proportion (%)
8 always in JJA with a constant decrease during the preceding
6 3-month periods. For the maximum, it seems SON is more
4
favourable to Area_max, while DJF is for Area_sec.
2
0 4 Discussion
1 2 3 4 5 6 7 8 9 10 11 12
Month
40
Albrecht et al. (2016) studied the lightning hotspots over the
(c) Area_sec Earth, based on satellite optical observations of lightning.
35 Area_max
They consider that a hotspot is a region 100 km in radius
30 around a maximum of FRD. They found that 6 out of the 10
25
most active spots over the whole African continent, including
Proportion (%)
the three strongest ones, are located in an area corresponding
20
to Area_max, while only two are located in an area corre-
15 sponding to Area_sec. Our results confirm the predominance
10 of the larger FRD in Area_max.
5
The characteristics of the diurnal cycle observed in
Area_max and Area_sec are consistent with Laing et
0
DJF MAM JJA SON DJF MAM JJA SON DJF MAM JJA SON
al. (2011). These authors analysed the cycle of the deep con-
2011 2012 2013 vection over a large area of tropical Africa, including both ar-
eas of our study and during 2000–2003. For two 1 h intervals
Figure 6. Proportions of flashes detected by WWLLN in Area_max
(14:00–15:00 and 17:00–18:00 UTC) besides eight consid-
and Area_sec: monthly (a) in 2012 and (b) 2013; (c) seasonally in
ered in their study, they found the location of a sharp max-
the period 2011–2013.
imum of the average hourly frequency of coldest clouds in
eastern DRC close to Area_max. The intervals 15:00–16:00
ning activity (06:00–06:00), the episodes of strong lightning and 16:00–17:00 UTC were not plotted in their graphs. They
activity in this area are more likely to be counted in full. noted this maximum for the two months of April and Octo-
ber analysed in the study. They also showed that the thun-
3.5 Month-to-month variability derstorm activity is minimum in the part of DRC that cor-
responds to both areas of our study during the time inter-
Figure 6a–b show the monthly proportion of flashes detected val 05:00–06:00 UTC in April and during 08:00–09:00 UTC
in Area_max and Area_sec during 2012 and 2013. The min- in October (06:00 and 07:00 UTC were not plotted). The
imum proportion is found in August and in Area_sec (be- present observations about minimum and maximum light-
tween 3 and 4 %) for both years. The maximum proportion ning activities displayed in Fig. 3 are consistent with those
is also found in Area_sec in May for 2012 (about 14 %) and by Laing et al. (2011). Indeed, the maximum of the activity
in December (about 14 %) for 2013. These two characteris- is invariably between 16:00 and 17:00 UTC for Area_max,
tics show that the variability is always stronger in Area_sec and in a larger temporal window for Area_sec (∼ 17:00–
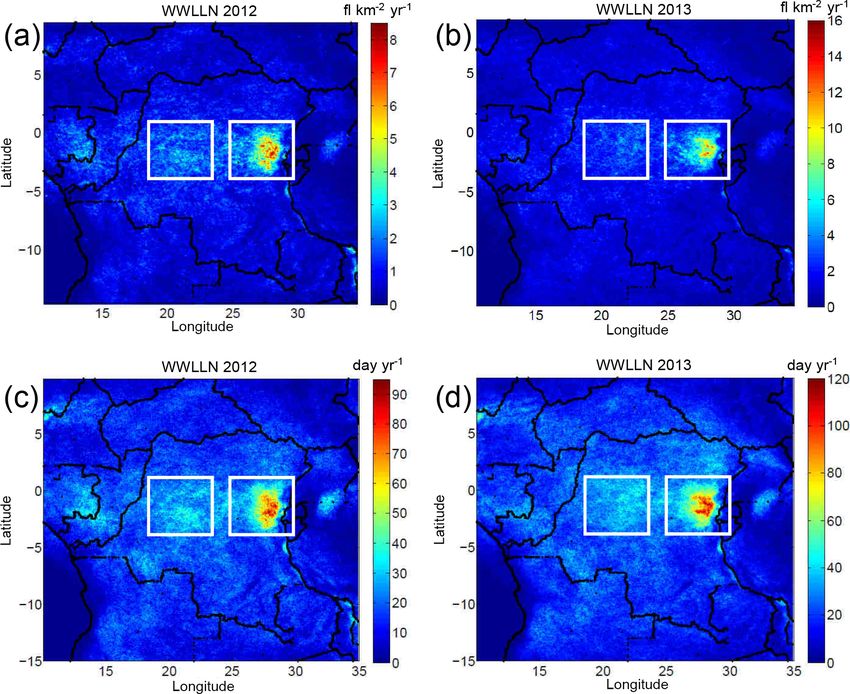
www.nat-hazards-earth-syst-sci.net/18/479/2018/ Nat. Hazards Earth Syst. Sci., 18, 479–489, 2018486 J. K. Kigotsi et al.: Comparison of lightning activity in the Congo Basin Figure 7. Density of lightning flashes (fl km−2 day−1 ) detected by WWLLN on 25 December 2013, (a) in Area_sec and (b) in Area_max. 19:00 UTC in 2012 and 16:00–17:00 UTC in 2013). The this distribution shows the lightning density is high (scale in maximum storm activity is therefore more variable in time fl km−2 day−1 ) in local spots that correspond to convective for Area_sec. The minimum is invariably between 07:00 and cores of thunderstorms. In other words, for a given day, the 08:00 UTC for Area_sec, between 08:00 and 09:00 UTC for lightning activity can be strong in a restricted area and weak Area_max. In Albrecht et al. (2016) for the study of lightning around in terms of flash number. This characteristic of the hotspots, the daily cycles are considered for several hotspots storm activity is well known and pointed out by many works located in our areas. They found a daily cycle more pro- (Carey et al., 2005; Soula et al., 2014). Secondly, the major- nounced for the hotspots included in Area_max compared to ity of the lightning spots seem east–west elongated, which the hotspots included in Area_sec, which is consistent with could indicate a propagation of the storms within this di- the present study. rection. Thus, the strong activity of a given storm is prob- The comparison of the monthly activity in Area_max and ably limited over the time. However, the correlation between Area_sec in 2012 and 2013 suggests that the seasonal con- both areas probably exists because of the eastward propa- trast is stronger in Area_sec, where the maximum monthly gation of conditions favourable to the development of thun- amounts are observed in May and December, respectively, derstorms, as instability of the atmosphere. Indeed, Laing and the minimum in August for the 2 years. At the seasonal et al. (2011) showed convection over equatorial Africa can scale, the lightning activity is cumulated over 3 months fol- be modulated by different conditions at synoptic scale for lowing the seasons considered in Soula et al. (2016) for the local occurrence or propagation of MCSs. They especially whole Congo Basin. The inter-annual variability is well vis- mentioned the eastward-moving equatorially trapped Kelvin ible and reproduced from one year to the next. Even in these waves, the south-westerly monsoonal flow and the midlevel 3 years the minimum proportion is always in August and easterly jets. It is therefore consistent to obtain a low correla- in Area_sec (about 3 to 4 %). The maximum proportion is tion between our two areas characterized by a strong annual also in Area_sec but in different months (from 14 to 16 %). storm activity. Furthermore, the correlation study is done at Therefore, the seasonal contrast is much stronger in Area_sec the scale of the day and as most thunderstorms develop at the than in Area_max. This result, due to the migration of the In- end of the day, storm activity can occur during the following tertropical Convergence Zone (ITCZ), is consistent with the day in Area_sec, which is several hundred kilometres to the contrast of the seasonal variation in lightning activity found west. in Soula et al. (2016). Area_max is less impacted by the mi- The distribution of storms in the Congo Basin mainly re- gration of the ITCZ because the triggering of thunderstorms sults from four contributions, namely development, propaga- in this area has a very local origin. tion, merging, and regeneration of thunderstorms. As thun- The positive correlation observed between the daily ac- derstorms can develop everywhere in the Congo Basin, they tivities of the two areas means there may be an influence can naturally form in both Area_max and Area_sec. How- between them or a common cause to explain the storm ac- ever, the great lakes and numerous mountains of Rift val- tivity. However, the low value of the correlation coefficient ley close to Area_max offer most favourable conditions for indicates the activities can be different on the quantitative as- development and enhancement of thunderstorms. The most pect. Figure 7 displays the daily density of lightning flashes intense storms, at planetary scale, are found in the Congo detected by WWLLN on 25 December 2013 in Area_sec (a) Basin (Zipser et al., 2006). Area_max is probably the most and in Area_max (b). This day is considered because the ac- active region in the world in terms of thunderstorms since tivity is strong in both areas with 18 107 and 10 257 flashes the number of days of the year with thunderstorm activity is detected in Area_sec and Area_max, respectively. Firstly, found to be maximum there (Fig. 2c–d) and the density of Nat. Hazards Earth Syst. Sci., 18, 479–489, 2018 www.nat-hazards-earth-syst-sci.net/18/479/2018/
J. K. Kigotsi et al.: Comparison of lightning activity in the Congo Basin                                                      487

lightning is large over this extended area (Soula et al., 2016).   shear to develop into mesoscale systems. On the other hand
On the other hand, according to previous studies, equato-          and according to several authors, the propagation of convec-
rial Africa thunderstorms spread from the east to the western      tion in equatorial Africa is modulated by convectively cou-
Congo Basin (Laing et al., 2011; Nguyen and Duvel, 2008;           pled, equatorial Kelvin waves (Laing et al., 2011). During
Laing and Fritsch, 1993). Then thunderstorms may propagate         the active phase of these eastward-propagating large-scale
from Area_max to Area_sec, but different processes such as         waves, MCSs are larger and more intense. These convec-
merging and regeneration may affect their intensity and in-        tive systems occur farther east from day to day and prop-
duce different characteristics in these areas. Several studies     agate westward within the Kelvin wave envelope. During
have shown that heterogeneity of soil moisture or vegeta-          the dry phase of the Kelvin waves an upper-level conver-
tion plays a role in the triggering of thunderstorms trigger-      gence is produced, which eliminates the deep convection and
ing (Taylor et al., 2011; Garcia-Carreras et al., 2010). Fur-      the westward propagation. Thus, the region corresponding
thermore, the modelling results of the Global Land Atmo-           to Area_max seems to have a stronger maximum of MCS
sphere Coupling Experiment (GLACE) classified equatorial           number, as we find a larger FRD. Area_max combines two
Africa, including Area_max and Area_sec, among the re-             conditions favourable for thunderstorm activity: the conver-
gions of strong coupling between the atmosphere and the soil       gence evoked by Jackson et al. (2009) for the large region and
moisture (Koster et al., 2004). Thus, differences in soil mois-    a local orographic effect that reinforces the effect of the first
ture and/or vegetable cover between Area_max and Area_sec          one. Area_sec seems to take advantage of the westward prop-
may contribute to the differences between lightning activities     agation/regeneration of MCS, at a distance from the initial
of the two areas.                                                  occurrence that depends on the phase of the Kelvin waves,
    Farnsworth et al. (2011) pointed out that the MCSs con-        which explains the widespread large values of FRD observed
stitute the fundamental unit of vertical energy transport in       within this area.
Central Africa. In other words, convection in this region gen-         The presence of mountains or elevated terrain is always
erally leads to the formation of MCSs. This observation is         a determining factor in the mechanism of thunderstorm. For
consistent with the results of Liu and Zipser (2005) and           example, on a very local scale, Munoz et al. (2016) explain
Zipser et al. (2006) (on deep convection in the Congo Basin).      the role of the topography combined with nocturnal low-level
They showed convection in the Congo Basin frequently over-         jet in the largest FRD in the world observed in the region
shoots the tropopause. The climatology of MCSs in equato-          of the Lake Maracaibo, Venezuela. On a more global scale,
rial Africa, including the whole Congo Basin, was presented        Williams and Sátori (2004) compared the lightning and rain-
in Jackson et al. (2009). From a 5-year series of data, these      fall activities in both the Amazon and Congo basins and ex-
authors have shown that the zone straddling the equator be-        plained that the larger values of FRD observed in the Congo
tween 5◦ S and 5◦ N and extending from the Atlantic coast          Basin were due to a more continental environment (drier and
to the west side of the high mountains of the Rift Valley is       warmer) and a higher elevation.
the most active in terms of storms because it includes three           According to Zipser et al. (2006) the proportion of in-
maxima of the number of MCSs among the four they iden-             tense convective events is larger in the region corresponding
tified. In our study, Area_max and Area_sec coincide with          to Area_sec compared to that corresponding to Area_max
the region where Jackson et al. (2009) found the main num-         (see their Fig. 3). This result is consistent with the present
ber maximum of MCS. In Jackson et al. (2009) two cores             Fig. 5 concerning the distribution of the daily flash number
appeared in the structure of this main maximum: one that           in each area, especially the panel (b), where the flash counts
corresponds to Area_sec with a less pronounced maximum             are made from 06:00 to 06:00 UTC. Furthermore, the DE is a
of number of MCS and a larger number of lightning flashes          little lower in Area_sec compared to Area_max, according to
per MCS, and the second core corresponds to Area_max with          the results displayed in Fig. 1. Thus, Area_sec is concerned
a more pronounced maximum. They explain the origin of the          by more irregular thunderstorm activity, with both the least
large number of MCS in this large area by a maximum of             active days and the most active days. It is well illustrated
midtropospheric convergence on the west side of the African        with the example in Fig. 7, displaying the daily lightning ac-
easterly jet of the Southern Hemisphere (AEJ-S). They ob-          tivity for the most active day in Area_sec (see Fig. 5a). In-
serve that this condition is more pronounced in the SON            deed, the FRD for the day is more scattered in the whole
season compared to MAM in the same way that we also                area for Area_sec. The distribution of thunderstorm activity
observe more flashes according to Fig. 6c. Indeed, accord-         is substantially different in each area, concentrated with a
ing to Mohr and Thorncroft (2006) and Laing et al. (2008),         very marked daily cycle in Area_max, and scattered with a
the vertical shear related to the African easterly jet (AEJ)       daily cycle much less pronounced.
influences the location of intense convective systems. Fur-
thermore, mountain ranges help to initiate long-lived MCSs
(Laing et al., 2008, 2011). According to these authors, in
all the regions the convection initiates over the elevated ter-
rain and then propagates in conditions of moderate vertical

www.nat-hazards-earth-syst-sci.net/18/479/2018/                             Nat. Hazards Earth Syst. Sci., 18, 479–489, 2018
488 J. K. Kigotsi et al.: Comparison of lightning activity in the Congo Basin
5 Conclusions References
Abarca, S. F., Corbosiero, K. L., and Vollaro, D.: The World Wide
The spatial and temporal characteristics of the lightning Lightning Location Network and convective activity in tropical
activity are analysed in two areas of the Congo Basin: cyclones, Mon. Weather Rev., 139, 175–191, 2011.
Albrecht, R. I., Goodman, S. J., Petersen, W. A., Buechler, D. E.,
Area_max with the strongest thunderstorm activity and
Bruning, E. C., Blakeslee, R. J., and Christian, H. J.: The 13 years
Area_sec with a secondary maximum. First, the lightning
of TRMM Lightning Imaging Sensor: from individual flash char-
flashes are much more concentrated in the same part of acteristics to decadal tendencies, Proceedings of the XIV Inter-
Area_max for both years, while they are widespread in national Conference on Atmospheric Electricity, 08–12 August
Area_sec. Secondly, the frequency of days with low activity 2011, Rio de Janeiro, Brazil, 2011.
is larger in Area_sec and the frequency of days with high ac- Albrecht, R., Goodman, S., Buechler, D., Blakeslee, R., and Chris-
tivity is larger in Area_max. However, the frequency of days tian, H.: Where are the lightning hotspots on Earth?, B. Am. Me-
with very high activity is similar in both areas and even the teorol. Soc., 97, 2051–2068, https://doi.org/10.1175/bams-d-14-
largest daily flash numbers are detected in Area_sec. Thirdly, 00193.1, 2016.
a stronger contrast between the maximum and the minimum Carey, L. D., Murphy, M. J., McCormick, T. L., and Deme-
in the daily cycle is observed in Area_max with a ratio of triades, N. W. S.: Lightning location relative to storm
structure in a leading-line, trailing-stratiform mesoscale
about 15.4, while it is only 4.7 for Area_sec. In conclu-
convective system, J. Geophys. Res., 110, D03105,
sion, the thunderstorm activity is more variable in Area_sec,
https://doi.org/10.1029/2003JD004371, 2005.
in terms of location, daytime of occurrence, seasonal distri- Cecil, D., Buechler, D. E., and Blakeslee, R. J.: Grid-
bution, and intensity in terms of number of flashes. These ded lightning climatology from TRMM-LIS and
differences are consistent because Area_max combines two OTD: Dataset description, Atmos. Res., 135, 404–414,
favourable effects for thunderstorm development, the conver- https://doi.org/10.1016/j.atmosres.2012.06.028, 2014.
gence associated with the AEJ-S, especially during SON and Christian, H. J., Blakeslee, R. J., Boccippio, D. J., Boeck, W. L.,
DJF, and a geographic effect due to the orography and the Buechler, D. E., Driscoll, K. T., Goodman, S. J., Hall, J. M.,
presence of a lake. The location of the strong convection in Koshak, W. J., Mach, D. M., and Stewart, M. F.: Global fre-
Area_sec is widespread, according to the distance and direc- quency and distribution of lightning as observed from space by
tion of propagation/regeneration of MCSs that initiate farther the Optical Transient Detector, J. Geophys. Res., 108, 4005,
https://doi.org/10.1029/2002JD002347, 2003.
eastern, especially in relation to the phase of Kelvin waves.
Dowden, R. L., Brundell, J. B., and Rodger, C. J.: VLF lightning
location by time of group arrival (TOGA) at multiple sites, J.
Atmos. Solar-Terr. Phys., 64, 817–830, 2002.
Data availability. All data used in this paper can be requested Farnsworth, A., White, E., Williams, C. J., Black, E., and Kniveton,
from the corresponding author, Serge Soula (serge.soula@aero.obs- D. R.: Understanding the Large Scale Driving Mechanisms of
mip.fr). Rainfall Variability over Central Africa, in: African Climate and
Climate Change, edited by: Williams, C. and Kniveton, D., Ad-
vances in Global Change Research, Vol. 43, Springer, Dordrecht,
Competing interests. The authors declare that they have no conflict https://doi.org/10.1007/978-90-481-3842-5_5, 2011.
of interest. Garcia-Carreras, L., Parker, D. J., Taylor, C. M., Reeves, C. E.,
and Murphy, J. G.: Impact of mesoscale vegetation hetero-
geneities on the dynamical and thermodynamic properties of
Acknowledgements. The authors thank the World Wide Lightning the planetary boundary layer, J. Geophys. Res., 115, D03102,
Location Network (http://wwlln.net/) and Christelle Barthe from https://doi.org/10.1029/2009JD012811, 2010.
the University of la Réunion (France) for providing the lightning Jackson, B., Nicholson, S. E., and Klotter, D.: Mesoscale convec-
location data used in this study. Jean K. Kigotsi is grateful to the tive systems over western equatorial Africa and their relationship
French “Ministère des Affaires Etrangères”, to the French Embassy to large-scale circulation, Mon. Weather Rev., 137, 1272–1294,
in DRC, especially Patrick Demougin, for supporting his stay in https://doi.org/10.1175/2008MWR2525.1, 2009.
France and “Groupe International de Recherche en Géophysique Koster, R. D., Dirmeyer, P. A., Guo, Z., Bonan, G., Chan, E.,
Europe/Afrique” (GIRGEA), especially Christine Amory, for help Cox, Peter, Gordon, C. T., Kanae, S., Kowalczyk, E., Lawrence,
with cooperation. Jean K. Kigotsi thanks Albert Kazadi from the D., Liu, P., Lu, C., Malyshev, S., McAvaney, B., Mitchell, K.,
University of Kinshasa for his support, help and discussions. Mocko, D., Oki, T., Oleson, K., Pitman, A., Sud, Y. C., Taylor,
C. M., Verseghy, D., Vasic, R., Xue, Y., and Yamada, T.: Regions
Edited by: Vassiliki Kotroni of strong coupling between soil moisture and precipitation, Sci-
Reviewed by: Earle Williams and one anonymous referee ence, 305, 1138–1140, https://doi.org/10.1126/science.1100217,
2004.
Laing, A. G. and Fritsch, J. M.: Mesoscale convective complexes in
Africa, Mon. Weather Rev., 121, 2254–2263, 1993.
Nat. Hazards Earth Syst. Sci., 18, 479–489, 2018 www.nat-hazards-earth-syst-sci.net/18/479/2018/J. K. Kigotsi et al.: Comparison of lightning activity in the Congo Basin 489 Laing, A. G., Carbone, R. E., Levizzani, V., and Tuttle, J. D.: The Rodger, C. J., Brundell, J. B., Hutchins M., and Holzworth, R. H.: propagation and diurnal cycles of deep convection in northern The world wide lightning location network (WWLLN): Update tropical Africa, Q. J. Roy. Meteor. Soc., 134, 93–109, 2008. of status and applications, 29th URSI General Assembly and Sci- Laing, A. G., Carbone, R. E., and Levizzani, V.: Cycles and propa- entific Symposium (URSI GASS), Beijing (P. R. of China), 16– gation of deep convection over equatorial Africa, Mon. Weather 23 August, 2014. Rev., 129, 2832–2853, 2011. Soula, S., Iacovella, F., van der Velde, O., Montanyà, J., Füllekrug, Liu, C. and Zipser, E. J.: Global distribution of convection pene- M., Farges, T., Bór, J., Georgis, J.-F., NaitAmor, S., and Martin, trating the tropical tropopause, J. Geophys. Res., 110, D23104, J.-M.: Multi-instrumental analysis of large sprite events and their https://doi.org/10.1029/2005JD006063, 2005. producing storm in southern France, Atmos. Res., 135, 415–431, Mohr, K. I. and Thorncroft, C. D.: Intense convective systems in https://doi.org/10.1016/j.atmosres.2012.10.004, 2014. West Africa and their relationship to the African easterly jet, Q. Soula, S., Kigotsi, K. J., Georgis, J. F., and Barthe, C.: Lightning J. Roy. Meteor. Soc., 132, 163–176, 2006. climatology in the Congo Basin, Atmos. Res., 178–179, 304– Munoz, A. G., Daz-Lobaton, J., Chourio, X., and Stock, M. J.: Sea- 319, https://doi.org/10.1016/j.atmosres.2016.04.006, 2016. sonal prediction of lightning activity in north western Venezuela: Taylor, C. M., Gounou, A., Guichard, F., Harris, P. P., Ellis, R. J., Large-scale versus local drivers, Atmos. Res., 172, 147–162, Couvreux, F., and De Kauwe, M.: Satellite detection of soil mois- https://doi.org/10.1016/j.atmosres.2015.12.018, 2016. ture impacts on convection at the mesoscale, Geophys. Res. Lett., Nguyen, H. and Duvel, J. P.: Synoptic wave perturbations and con- 33, L03404, https://doi.org/10.1029/2005GL025252, 2011. vective systems over equatorial Africa, J. Climate, 21, 6372– Williams, E. R. and Sátori, G.: Lightning, thermodynamic and hy- 6388, 2008. drological comparison of the two tropical continental chimneys, Rodger, C. J., Brundell, J. B., Holzworth, R. H., and Lay, E. H.: J. Atmos. Sol.-Terr. Phys., 66, 1213–1231, 2004. Growing Detection Efficiency of the World Wide Lightning Lo- Zipser, E. J., Cecil, D. J., Liu, C., Nesbitt, S. W., and Yorty, D. cation Network, Am. Inst. Phys. Conf. Proc., Coupling of thun- P.: Where are the most intense thunderstorms on Earth, B. Am. derstorms and lightning discharges to near-Earth space: Proceed- Meteorol. Soc., 1057–1071, https://doi.org/10.1175/BAMS-87- ings of the Workshop, Corte (France), 23–27 June 2008, 1118, 8-1057, 2006. 15–20, https://doi.org/10.1063/1.3137706, 2008. www.nat-hazards-earth-syst-sci.net/18/479/2018/ Nat. Hazards Earth Syst. Sci., 18, 479–489, 2018
You can also read