Vaccination Prioritization Strategies for COVID-19 in Korea: A Mathematical Modeling Approach
←
→
Page content transcription
If your browser does not render page correctly, please read the page content below
International Journal of
               Environmental Research
               and Public Health

Article
Vaccination Prioritization Strategies for COVID-19 in Korea: A
Mathematical Modeling Approach
Yongin Choi † , James Slghee Kim † , Jung Eun Kim, Heejin Choi and Chang Hyeong Lee *

                                            Department of Mathematical Sciences, Ulsan National Institute of Science and Technology, Ulsan 44919, Korea;
                                            yongin9@unist.ac.kr (Y.C.); jameskim@unist.ac.kr (J.S.K.); jkimmath1@unist.ac.kr (J.E.K.);
                                            chlgmlwls@unist.ac.kr (H.C.)
                                            * Correspondence: chlee@unist.ac.kr
                                            † These authors contributed equally to this work.

                                            Abstract: Coronavirus disease 2019 (COVID-19) vaccination has recently started worldwide. As the
                                            vaccine supply will be limited for a considerable period of time in many countries, it is important
                                            to devise the effective vaccination strategies that reduce the number of deaths and incidence of
                                            infection. One of the characteristics of COVID-19 is that the symptom, severity, and mortality of
                                            the disease differ by age. Thus, when the vaccination supply is limited, age-dependent vaccination
                                            priority strategy should be implemented to minimize the incidences and mortalities. In this study,
                                            we developed an age-structured model for describing the transmission dynamics of COVID-19,
                                            including vaccination. Using the model and actual epidemiological data in Korea, we estimated the
                                            infection probability for each age group under different levels of social distancing implemented in
                                            Korea and investigated the effective age-dependent vaccination strategies to reduce the confirmed

                                     cases and fatalities of COVID-19. We found that, in a lower level of social distancing, vaccination
Citation: Choi, Y.; Kim, J.S.; Kim, J.E.;
                                            priority for the age groups with the highest transmission rates will reduce the incidence mostly, but,
Choi, H.; Lee, C.H. Vaccination             in higher levels of social distancing, prioritizing vaccination for the elderly age group reduces the
Prioritization Strategies for               infection incidences more effectively. To reduce mortalities, vaccination priority for the elderly age
COVID-19 in Korea: A Mathematical           group is the best strategy in all scenarios of levels of social distancing. Furthermore, we investigated
Modeling Approach. Int. J. Environ.         the effect of vaccine supply and efficacy on the reduction in incidence and mortality.
Res. Public Health 2021, 18, 4240.
https://doi.org/10.3390/                    Keywords: COVID-19; vaccination priority strategy; mathematical modeling; social distancing
ijerph18084240

Academic Editor: Eunha Shim

                                            1. Introduction
Received: 4 March 2021
Accepted: 12 April 2021
                                                  Since the first case reported in Wuhan, China, in December 2019, Coronavirus Disease
Published: 16 April 2021
                                            2019 (COVID-19) has rapidly spread worldwide. COVID-19 is caused by severe acute
                                            respiratory syndrome coronavirus 2 (SARS-CoV-2). The cases of the disease display similar
Publisher’s Note: MDPI stays neutral
                                            symptoms to those of Middle East Respiratory Syndrome and Severe Acute Respiratory
with regard to jurisdictional claims in
                                            Syndrome, such as fever, dry cough, dyspnea, and diarrhea [1]. The disease has been
published maps and institutional affil-     characterized as a pandemic by the World Health Organization (WHO) on 11 March 2020 [2].
iations.                                    On 17 February 2021, it was reported that more than 108.8 million people were infected
                                            with COVID-19, and more than 2.4 million casualties were recorded across 223 countries [3].
                                            To reduce the spread of the disease while COVID-19 vaccines were not available, countries
                                            initially used contact tracing [4] and later implemented non-pharmaceutical interventions
Copyright: © 2021 by the authors.
                                            (NPIs), which include social distancing (SD), wearing masks, epidemiological surveys,
Licensee MDPI, Basel, Switzerland.
                                            and work/school closure, following the guidelines made by their own government and
This article is an open access article
                                            by WHO.
distributed under the terms and                   On 16 February 2021, there have been 84,325 cases with 1534 casualties in Korea;
conditions of the Creative Commons          57.1% of these cases were from the densely populated metropolitan area—26,484 cases
Attribution (CC BY) license (https://       from Seoul and 21,648 cases from Gyeonggi Province [5]. As contact tracing was not
creativecommons.org/licenses/by/            sufficient to prevent the spread of the disease, NPIs have been implemented differently
4.0/).                                      across regions in Korea, and owing to high floating population and population density,

Int. J. Environ. Res. Public Health 2021, 18, 4240. https://doi.org/10.3390/ijerph18084240                      https://www.mdpi.com/journal/ijerph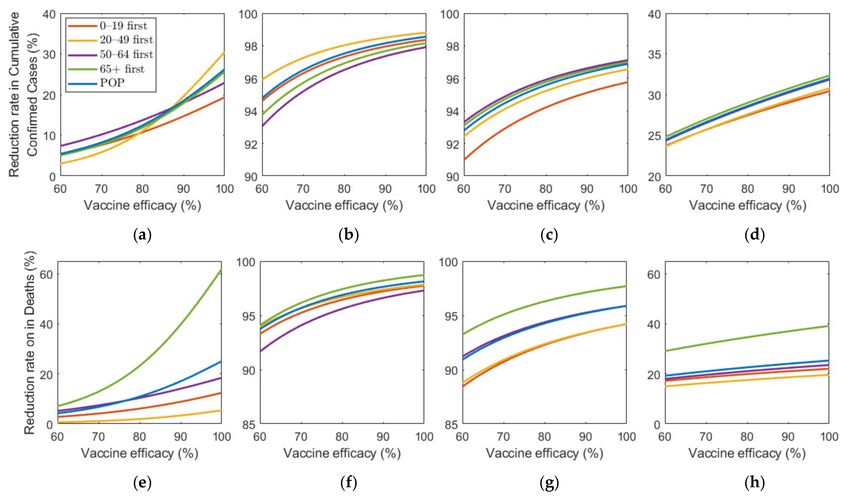
Int. J. Environ. Res. Public Health 2021, 18, 4240                                                                               2 of 19

                                        reinforced measures for infection control have been implemented in Seoul and Gyeonggi
                                        Province. Many social events and gatherings were limited or prohibited, work-at-home
                                        was enforced or advised, and schools were closed frequently. However, despite these
                                        efforts, which are not without economic, social, and psychological sacrifices caused by
                                        NPIs and ethical issues that accompany contact tracing [6], COVID-19 cases still exist, and
                                        ending this dynamic does not seem probable with the current level of efforts. It is expected
                                        that effective vaccination can improve this situation.
                                              As of 17 February 2021, four different COVID-19 vaccines have been approved for
                                        full use, and six different vaccines have already been approved for early or limited use [7].
                                        The Korean government has released the plan for vaccination schedule, in which the ad-
                                        ministration starts in February until December 2021 [8]. A description of the vaccines is
                                        given in Table 1. The government plans to finish the administration of the first dose for
                                        the public by the third quarter of 2021 and accomplish herd immunity in November 2021.
                                        Currently, Korea has secured the access of COVID-19 vaccines from five different pharma-
                                        ceutical companies—Pfizer, AstraZeneca, Moderna, Johnson & Johnson, and Novavax—for
                                        79 million people [8,9], which is approximately 152.5% of the total population.

                                                          Table 1. Description of vaccines.

          Producer                         Method                       Efficacy              Total Number of Doses    Reference
        Moderna                        mRNA base                        94.1%
                                                                                                    40 million            [10]
      “mRNA-1273”                 2 doses, 4 weeks apart        2 weeks after 2nd dose
      Pfizer-BioNTech                  mRNA base                        95.0%
                                                                                                    26 million            [11]
       “BNT162b2”                 2 doses, 3 weeks apart         1 week after 2nd dose
    Oxford University-
                                     Viral vector base               62.1–90.0%
      AstraZeneca                                                                                   20 million            [12]
                                  2 doses, 4 weeks apart        2 weeks after 2nd dose
      “AZD1222”
    Johnson & Johnson                 Viral vector base       57.0~72.0% (Overall 66.0%)
                                                                                                    6 million             [13]
     “Ad26.COV2.S”                         1 dose                 4weeks after dose
        Novavax                       Protein-based                     89.3%
                                                                                                    40 million            [14]
     “NVX-CoV2373”                2 doses, 3 weeks apart         1 week after 2nd dose

                                              Recent studies have reported that the susceptibility [15,16], infectivity [16], sever-
                                        ity [17], and fatality [18] of COVID-19 vary with age. Thus, the number of incidences,
                                        severe patients, and deaths will vary depending on how the vaccination priority is deter-
                                        mined for each age group. Besides essential workers and patients in critical condition,
                                        Centers for Disease Control and Prevention recommends vaccination priority for the elderly
                                        people [19].
                                              The Korean government plans to prioritize vaccination by dividing the entire popula-
                                        tion, excluding frontline essential workers and patients in critical condition, into different
                                        age groups [8]. To reflect this plan and simulate the effect of vaccination under various
                                        scenarios, we construct a mathematical model for describing the transmission of COVID-19
                                        with the vaccination prioritization of four age groups: 0–19, 20–49, 50–64, and 65 or older.
                                        Several studies on mathematical modeling for COVID-19 vaccination have been conducted
                                        recently. In References [20,21], the critical vaccination coverage for various hypothetical
                                        vaccine efficacy scenarios is estimated in South Africa and Australia, respectively, to con-
                                        trol the disease. In References [22–25], the effect of vaccination in terms of efficacy and
                                        coverage is investigated combined with other interventions, such as the rollout speed
                                        of COVID-19 vaccine, face mask usage, or SD. Age-structured models are considered in
                                        References [26–29], and optimal vaccine allocation strategies on age groups are identified
                                        under various control scenarios. A multi-region epidemic model is constructed in Refer-
                                        ence [30], and the optimal control theory is applied to reduce the number of infectious
                                        individuals in the targeted domain with an optimal cost. The appropriate price for COVID
                                        19 vaccine is suggested in Reference [31] using a mathematical model.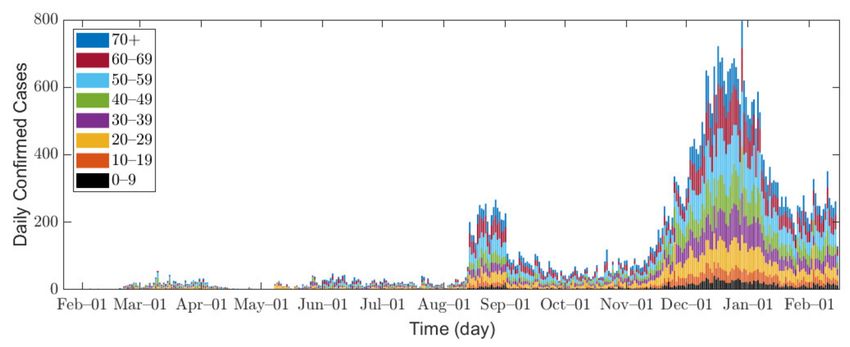
Int. J. Environ. Res. Public Health 2021, 18, 4240                                                                                     3 of 19

                                             In this study, we aimed to investigate the effect of vaccination priority strategies for
                                        different age groups on infection incidence and mortality under different SD levels imple-
                                        mented in Korea. For this purpose, we first developed an age-structured mathematical
                                        model to describe the transmission dynamics of COVID-19 combined with vaccination. Us-
                                        ing the age-structured mathematical model, we also compared the effect of age-dependent
                                        vaccination priority strategies on various levels of vaccine efficacy and supply.

                                        2. Materials and Methods
                                        2.1. Epidemiological Data
                                             In this research, we used data of confirmed COVID-19 cases in Seoul and Gyeonggi
                                        Province between 1 February 2020 and 14 February 2021 [32,33]. Because the data for Seoul
                                        are provided in age groups of 10 years, we combine the data from both Seoul and Gyeonggi
                                        Province into 10-year age groups for consistent interpretation, namely 0–9, 10–19, 20–29,
                                        30–39, 40–49, 50–59, 60–69, and 70 or older (70+). Figure 1 shows the epidemic curve of
                                        confirmed COVID-19 cases, and Table 2 shows the total number of confirmed cases for
                                        each age group in Seoul/Gyeonggi area.

                                                 Figure 1. Confirmed cases in Seoul/Gyeonggi area.

                                        Table 2. Confirmed cases in Seoul/Gyeonggi area.

                                                                                                               Region
                                                Age Group                  Total
                                                                                                     Seoul               Gyeonggi
                                              All age groups          47,371 (100.0%)         25,853 (54.6%)            21,518 (45.4%)
                                                     0–9                1987 (4.2%)             850 (3.3%)               1137 (5.3%)
                                                     10–19              2921 (6.2%)            1342 (5.2%)               1579 (7.3%)
                                                     20–29             6314 (13.3%)            3291 (12.7%)             3023 (14.0%)
                                                     30–39             6240 (13.2%)            3483 (13.5%)             2757 (12.8%)
                                                     40–49             6817 (14.4%)            3625 (14.0%)             3192 (14.8%)
                                                     50–59             8861 (18.7%)            4947 (19.1%)             3914 (18.2%)
                                                     60–69             7962 (16.8%)            4714 (18.2%)             3248 (15.1%)
                                                     70+               6269 (13.2%)            3601 (13.9%)             2668 (12.4%)

                                             In Seoul/Gyeonggi area, the number of confirmed cases per day remained below
                                        100 before August 2020 but increased to approximately 200 after mid-August. Since mid-
                                        November, a large number of confirmed cases has emerged as winter approaches [34],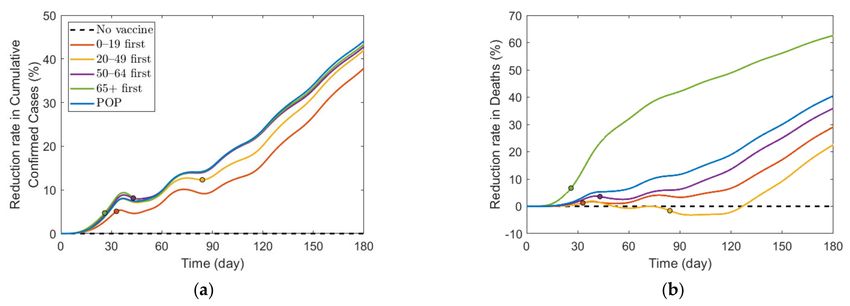
Int. J. Environ. Res. Public Health 2021, 18, 4240                                                                                        4 of 19

                                        which can be explained by the fact that the contact time in a confined space has increased,
                                        and indoor environments provide a stable condition for SARS-CoV-2 with less sunlight [35].
                                             The infection incidences in Seoul/Gyeonggi area were heavily affected by different
                                        levels of SD implemented by the Korean government [36–39]. The definition of SD levels
                                        announced by the government varied in the course of our study. Initially, there were three
                                        levels of governmental SD, but, on 7 November 2020, the Korean government revised the
                                        governmental SD to five levels as shown in Table S1 in Supplementary Section A1 [40].
                                        In addition, the government’s decision and policy-making does not strictly follow the
                                        definitions, as the SD announced by the government is considered as a guideline. For
                                        example, elevation to governmental SD level 2 requires a monitoring duration of confirmed
                                        cases for at least 1 week at governmental SD level 1.5 [40], but governmental SD level 1.5
                                        only lasted for 5 days [41]. Moreover, governmental SD level 2.5 was reinforced with the
                                        prohibition of gathering of five or more people on 24 December 2020 [42], despite the fact
                                        that governmental SD level 3 only prohibits the gathering of 10 or more people. For the
                                        above reasons, the definite classification of SD was difficult, so referring to the government
                                        policies that actually took effect, we set our own criteria for SD as presented in Table 3.
                                        In this research, the contact matrix, which characterizes the contact degree between age
                                        groups, is the linear combination of the location-specific matrices of workplace, school,
                                        household, and other locations [43], and SD levels directly impact the contact matrix by
                                        location and age as shown in Table 3; the details of the contact matrix will be explained in
                                        Section 2.2 and Supplementary Section B1.

                                       Table 3. Description of the modified social distancing (SD) in Korea.

    SD Levels                      Description                         Criteria                         Contact Matrix Variations
          0                           No SD                          No criterion                               No change
                                                                                               Contact in locations other than workplace,
                                                                                                household, and school decreased by 30%.
                        Corresponds to governmental          Weekly average is less than
          1                                                                                    Contact in household increased by 50% for
                             SD level 1 and 1.5                  170 cases per day
                                                                                                 age less than 20 and 10% for age 20 and
                                                                                                                above [44].
                                                                                               Contact in locations other than workplace,
                                                                                                household, and school decreased by 50%.
                        Corresponds to governmental
          2                                                  At least 170 cases for 7 days     Contact in household increased by 50% for
                             SD level 2 and 2.5
                                                                                                 age less than 20 and 10% for age 20 and
                                                                                                                above [44].
                                                                                               Contact in locations other than workplace,
                        Corresponds to governmental                                             household, and school decreased by 70%.
                                                            Weekly average is 280 or more
          3                   SD level 2.5 with                                                Contact in household increased by 50% for
                                                                   cases per day
                              reinforcements *                                                   age less than 20 and 10% for age 20 and
                                                                                                                above [44].
      * Governmental SD level 2.5 with reinforcements is assumed to be equivalent to governmental SD level 3 despite having slightly weaker
      standards [40] (Table S1 in Supplementary Section B1) due to stronger prohibition of gathering [40,42].

                                        2.2. Mathematical Model
                                             We developed an age-structured mathematical model to describe the transmission
                                        dynamics of COVID-19 with vaccination. In this model, the population is separated into
                                        compartments based on their characteristics for each age group i: Si = susceptible, Vi =
                                        vaccinated, Ei = exposed, Pi = pre − symptomatically infectious, Ai = asymptomatically
                                        infectious, Ii = asymptomatically infectious, HiM = hospitalized with mild symptoms,
                                        HiS = hospitalized with severe symptoms, Ri = recovered and Di = dead. The age
                                        classes i = 1, 2, . . . , 8 represent individuals aged 0–9, 10–19, 20–29, 30–39, 40–49, 50–59,
                                        60–69, and 70+, respectively. The schematic diagram of the model is shown in Figure 2.
                                        The susceptible population can be vaccinated or become infected. Infection can occur
                                        for both the susceptible and the vaccinated if pre-symptomatically, asymptomatically, or
                                        symptomatically infectious population makes contact. Once considered infected, this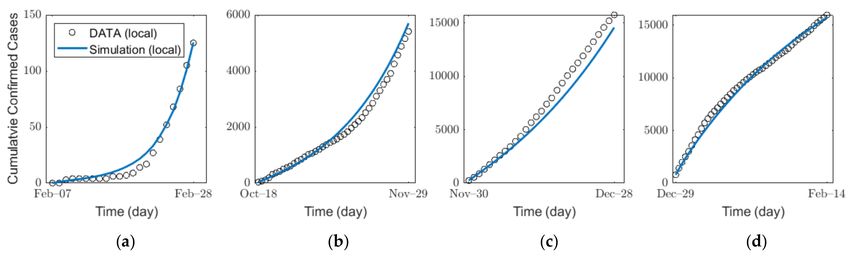
Int. J. Environ. Res. Public Health 2021, 18, 4240                                                                                                    5 of 19

                                        population is exposed and becomes pre-symptomatically infectious after the latent period.
                                        The pre-symptomatically infectious population does not show any symptom and moves on
                                        to either asymptomatically infectious or symptomatically infectious. The asymptomatically
                                        infectious population continues to show no symptoms; thus, no isolation is made until they
                                        become recovered. On the other hand, the symptomatically infectious population will be
                                        hospitalized based on the severity of their symptoms—either mild or severe—once they
                                        are confirmed with COVID-19. The hospitalized population is completely prohibited from
                                        making contacts with others. Both hospitalized groups recover, except for those who die
                                        from a group with severe symptoms.

                                              Figure 2. Schematic diagram of the mathematical model.

                                               The differential equations for describing the model are as follows.
                                                                                  .
                                                                                   Si = −Λi Si − φi v
                                                                                 .
                                                                                Vi = φi v − (1 − τ )Λi Vi
                                                                           .
                                                                          Ei = (Si + (1 − τ )Vi )Λi − α E Ei
                                                                                    .
                                                                                   Pi = α E Ei − α P Pi
                                                                              .
                                                                             Ai = (1 − ρ)α P Pi − γ A Ai
                                                                                     .                                                                     (1)
                                                                                    Ii = ρα P Pi − qIi
                                                                             . M
                                                                            H i = (1 − κi )qIi − γiM HiM
                                                                             . S
                                                                             H = κi qIi − γiS HiS − µi HiS
                                                                            . i
                                                                           Ri = γ A Ai + γiM HiM + γiS HiS
                                                                                     .
                                                                                    Di = µi HiS ,

                                                                                                                      8        mij (θ P Pj +θ A A j +θ I Ij )
                                        where the infection force Λi for each age group i = 1, 2, . . . , 8 is Λi = bi ∑                    Nj                   .
                                                                                                                      j
                                        The model parameters in Equation (1) are described in Table 4, and Nj is the total contact
                                        possible population of age group j, equivalently Nj = S j + Ej + Pj + A j + Ij + R j . Note that
                                        mij is an entry of the contact matrix,C M , which is an 8 × 8 matrix estimated from [36,43]
                                        reflecting the actual transmission rates between individuals of different ages in the target
                                        area. The detailed computation for contact matrix is given in Supplementary Section B1.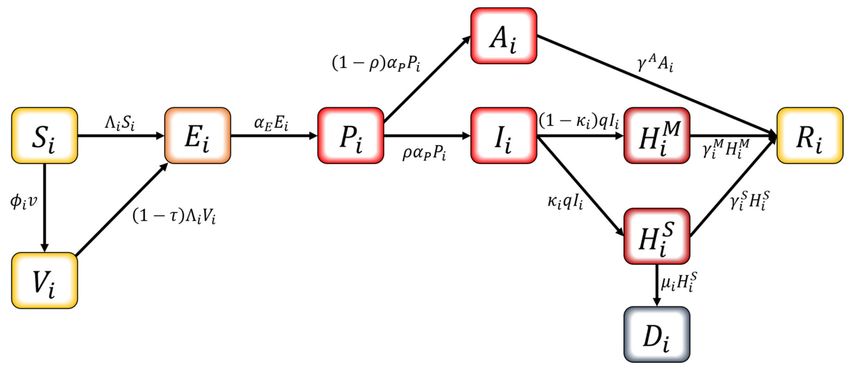
Int. J. Environ. Res. Public Health 2021, 18, 4240                                                                                                        6 of 19

                                                           Table 4. Descriptions of parameters.

    Parameter                                         Description                                               Value                        References
            bi          Infection probability of a person in age group i per contact                            Table 5                      Estimated
                         Number of contacts made by a person in age group j with
         mij                                                                                                  Figure S1                         [36]
                                         people in age group i
          φi                         Vaccination allocation for age group i                                      vary                        Estimated
            v                                 Daily vaccination doses                                           88,283                          [8,9]
         VP                                      Vaccination period                                              180                            [45]
         VC                                   Total vaccine coverage                                              0.7                           [45]
            τ                                        Vaccine efficacy                                            0.88                        [10–14,45]
         θP                Relative infectiousness of pre-symptomatic infectious                                 0.51                           [27]
         θA                  Relative infectiousness of asymptomatic infectious                                  0.51                           [27]
          θI                Relative infectiousness of symptomatically infectious                                 1                             [27]
        1/α E                                   Latent period (day)                                               3                             [46]
        1/α P                             Pre-symptomatic period (day)                                            3.2                           [46]
            ρ                           Probability of having symptoms                                           0.84                           [27]
         1/q                       Mean duration of case confirmation (day)                                       3                             [36]
       1/γ A                    Recovery period of asymptomatic cases (day)                                       3.5                           [27]
                                                                                                      * 15.3, 14.9, 16.3, 15.9,
       1/γiM             Recovery period of mild symptom cases for group i (day)                                                                [32]
                                                                                                       15.5, 15.8, 16.5, 18.2
                                                                                                      * 15.3, 14.9, 16.3, 15.9,
        1/γiS           Recovery period of severe symptom cases for group i (day)                                                               [32]
                                                                                                       15.5, 15.8, 16.5, 18.2
            κi                      Probability of having severe symptoms                                        0.26                           [47]
                                                                                                           * 0, 0, 0, 0,
          µi                    Death rate of individuals in H S in age group i                                                                 [32]
                                                                                                   0.001, 0.002, 0.009, 0.0832
      * For cells with an asterisk (*), values from left to right at the top (bottom) are for age groups: 0–9, 10–19, 20–29, and 30–39 (40–49, 50–59,
      60–69, and 70+).

                         Table 5. Values of infection probability and reproduction number depending on age group.

   SD Level           Time Interval              Contact Matrix                                          bi *                                           Rt
                       1 February–                                           3.97 ×  10−5 ,5.57 ×    10−2 ,
                                                                                                         7.82 ×         10−2 ,
                                                                                                                       7.00 ×       10−2 ,
        0                                                M0                                                                                        3.6606
                       22 February                                           5.78 × 10⁻² , 3.06 × 10⁻² , 1.12 × 10⁻¹ , 3.45 × 10⁻¹ .
                       12 October–                                           3.43 × 10⁻² , 2.74 × 10⁻² , 2.84 × 10⁻² , 2.03 × 10⁻² ,
        1                                                M1                                                                                        1.4219
                      23 November                                            2.15 × 10⁻² , 2.76 × 10⁻² , 7.73 × 10⁻² , 1.31 × 10⁻¹ .
                     24 November–                                            2.99 × 10⁻² , 2.01 × 10⁻² , 2.28 × 10⁻² , 1.93 × 10⁻² ,
        2                                                M2                                                                                        1.2785
                      22 December                                            1.93 × 10⁻² , 3.66 × 10⁻² , 1.08 × 10⁻¹ , 1.68 × 10⁻¹ .
                      23 December–                                           2.64 × 10⁻² , 2.04 × 10⁻² , 1.78 × 10⁻² , 1.38 × 10⁻² ,
        3                                                M3                                                                                        0.8467
                       14 February                                           1.33 × 10⁻² , 2.44 × 10⁻² , 7.45 × 10⁻² , 1.20 × 10⁻¹ .
      * In each cell for the fitted bi , the values from left to right at the top (bottom) are for the age groups of 0–9, 10–19, 20–29, and 30–39 (40–49,
      50–59, 60–69, and 70+), respectively.

                                            In this study, we find the effective reproduction number Rt which measures the mean
                                        number of secondary cases infected by an infectious individual. Mathematically, it is
                                        computed as Rt = ρ(G), where ρ is the spectral radius of the next generation matrix G.
                                        For model (1), Rt is derived as follows:

                                                                                     (1 − ρ)θ A ρθ I

                                                                               θP
                                                              R t = ρ (G) =        +           +       ρ ( MA )
                                                                               αP       γA       q

                                               Here, MA is the matrix computed as follows: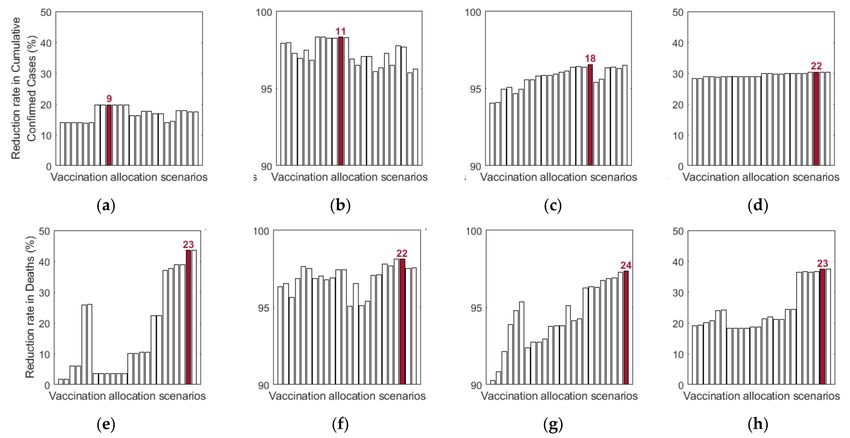
Int. J. Environ. Res. Public Health 2021, 18, 4240                                                                                             7 of 19


                                                                                                                  1 1         1
       MA = diag{b1 (S1 + (1 − τ )V1 ), b2 (S2 + (1 − τ )V2 ), . . . , b8 (S8 + (1 − τ )V8 )}8 ∗ C M ∗ diag         ,   ,...,              ,
                                                                                                                  N1 N2       N8       8

                                        where Si is the susceptible population of age group i, Vi is the vaccinated population of
                                        age group i, C M is the 8 × 8 contact matrix, and diag{ }n denotes the diagonal matrix
                                        with n diagonal entries. The detailed derivation of the above formula for Rt is given in
                                        Supplementary Section B2.

                                        2.3. Vaccination Strategies
                                              The Korean governmental vaccination plan on 28 January 2021 states that [8], ex-
                                        cluding frontline essential workers and patients in critical condition, vaccines will be
                                        administered based on age groups, such as 18–49, 50–64, and 65 or older, starting with the
                                        elderly, and 70% of the population will be vaccinated in 6 months from its start date [45].
                                        Though the vaccination of people under the age of 18 has not been decided, the government
                                        is planning to administer the vaccine depending on the clinical outcomes [8]. To emphasize
                                        the effects of vaccine administration scenarios based on age groups, and because of non-
                                        exact vaccination administration schedule based on the producers, the overall vaccination
                                        efficacy was used in this research, which was calculated as 88% by taking the average of
                                        efficacy of different vaccines in Table 1 with doses as weights. The details of the calculation
                                        are explained in Supplementary A2. As the demographic in our study considered 10-year
                                        age groups, we investigated four different vaccination priority strategies, which initially
                                        distributed vaccination to target age groups of 0–19, 20–49, 50–64, and 65 or older (65+) by
                                        70% of the target population, and then vaccination was administered to other age groups
                                        proportional to their population until 70% of the total population was vaccinated. We will
                                        refer this vaccination priority strategies for different age groups 0–19, 20–49, 50–64, and
                                        65+ by “0–19 first”, “20–49 first”, “50–65 first”, and “65+ first”, respectively. Note that
                                        our simulation was based on 10-year age groups, but we implemented two vaccination
                                        strategies “50–64 first” and “65+ first”, which are not separable by 10-year intervals. To
                                        resolve the discrepancy in the age intervals, vaccines distributed to age groups 60–64
                                        and 65–69 were based on population ratio [48]. Four of the five vaccines planned to be
                                        introduced in Korea require two vaccine doses per person as shown in Table 1. In this study,
                                        we considered the date of the last vaccination as the vaccination date. To compare the
                                        case with no prioritization, an additional strategy was considered where vaccination was
                                        administered to 70% of all age groups with proportion of population from the start, which
                                        will be referred to herein as the POP strategy. Figure 3 illustrates the vaccination allocation
                                        for age groups in the five vaccination strategies. The slight difference of distribution of
                                        vaccines between age groups within each strategy is caused by the population difference
                                        of age groups. The general population ratio between age groups can be observed in the
                                        distribution of vaccines in the POP strategy where all age groups were administered with
                                        equal coverage rate.
                                              Since the SD can significantly affect the transmission dynamics of COVID-19 [36] and
                                        it is very likely that vaccination will be administered while appropriate SD policies are
                                        implemented in Korea, we investigated the effect of the five vaccination priority strategies
                                        on the number of confirmed cases and mortalities under the assumption of the different
                                        SD levels. Furthermore, as the Korean government has criteria for changing the intensity
                                        of SD according to the number of confirmed cases [33], we reflected these criteria in the
                                        simulation to investigate the effect of the age-dependent vaccination priority strategies on
                                        the number of confirmed cases and mortalities.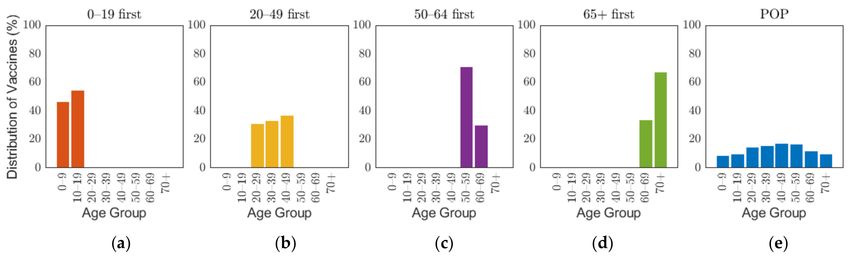
Int. J. Environ. Res. Public Health 2021, 18, 4240                                                                                     8 of 19

      Figure 3. Distribution of vaccine scenarios for five prioritization strategies: (a) 0–19 first, (b) 20–49 first, (c) 50–64 first,
      (d) over 65 first, and (e) proportion of population (POP).

                                        2.4. Parameter Estimation
                                             We estimated the infection probability bi by fitting the actual confirmed cases for
                                        each age group by using a MATLAB-embedded function, lsqcurvefit, which is a nonlinear
                                        solver that finds the coefficient bi that minimizes gap of confirmed cases between the actual
                                        data and the simulated results from Equation (1) in the least-squares sense. The detailed
                                        explanation of the function is given in Supplementary Section B3. In the estimation, we
                                        used the contact matrix for each age group in Korea [36,43]. For SD level 0, 1, 2, and 3, to
                                        reflect the impacts of SD levels, we used different contact matrices M0 , M1 , M2 , and M3 ,
                                        respectively. As shown by the parameter values in Table 4, the average time from the pre-
                                        symptomatic stage to confirmation is approximately 6 days. Thus, under the assumption
                                        that SD affects pre-symptomatic infection immediately, it is estimated that the number of
                                        confirmed cases is influenced approximately 6 days after the implementation of new SD.
                                        The details on the SD affecting confirmed cases and the infection probability bi are shown
                                        in Supplementary Section B4. Figure 4 and Table 5 show the results of the estimation of
                                        infection probability from the actual data of confirmed cases in the four distinct periods
                                        of SD levels 0, 1, 2, and 3. As SD level increases, the effective reproduction number Rt
                                        decreases as shown in Table 5. The results of the confirmed cases fitting for all ages for each
                                        SD level are shown in Figure S2 in Supplementary Section C. The results of the (cumulative)
                                        confirmed cases fitting for each age group in different SD levels are shown in (Figures
                                        S7–S10) Figures S3–S6 in Supplementary Section C.

              Figure 4. Estimation of the infection probability for different levels of SD: SD level (a) 0, (b) 1, (c) 2, and (d) 3.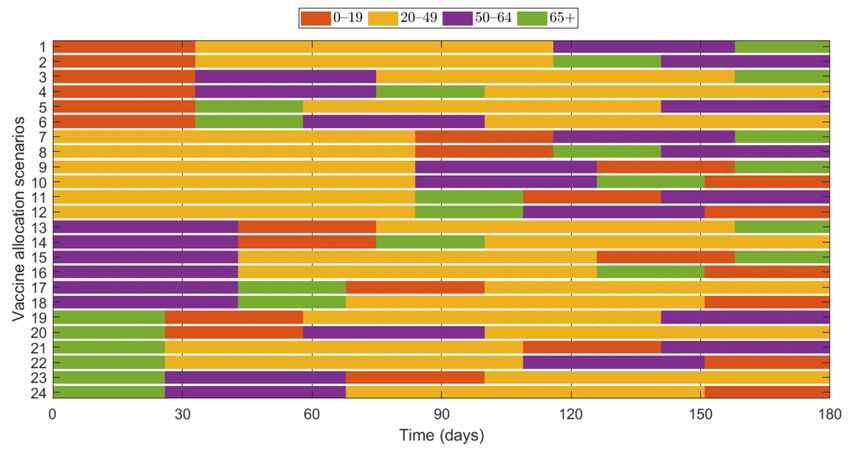
Int. J. Environ. Res. Public Health 2021, 18, 4240                                                                                       9 of 19

                                        2.5. Ethical Considerations and Data Sharing Policy
                                             COVID-19 data for Seoul and Gyeonggi Province are accessible in Reference [32,33],
                                        respectively. We used the fully anonymized data available in Reference [32,33], so there is
                                        no ethical issue to consider in this work.

                                        3. Results
                                             In this section, we investigated the effect of the age-dependent vaccination priority
                                        strategies under different levels of SD as described in Section 2.3. We assumed that 70% of
                                        the total population was vaccinated over 6 months, and the number of vaccinations per
                                        day was equal.
                                             As shown in Figure 5, we compared the effects of the vaccination priority strategies
                                        on the number of confirmed cases and deaths under different levels of SD. The exact values
                                        of the results displayed in Figure 5 are shown in Table 6.

      Figure 5. Effect of vaccination priority strategies for different SD levels (a) 0, (b) 1, (c) 2, (d) 3. Labels “0–19”, “20–49”,
      “50–64”, “65+” denote the vaccination priority strategies “0–19 first”, “20–49 first”, “50–64 first”, and “65+ first”, respectively.

          Table 6. Values of cumulative confirmed cases and deaths depending on SD level and vaccination priority strategy.

                                   Cumulative Confirmed Cases                                                Death
  Scenarios
                       SD 0              SD 1          SD 2          SD 3            SD 0            SD 1            SD 2           SD 3
  No Vaccine        16,820,437         6,378,361     1,315,182       9423          371,430         114,929           30,611          321
   0–19 first       14,236,200          145,172       67,228         6716          335,020           3523            2109            254
  20–49 first       13,162,693          106,477       55,142         6696          347,875           3309            2098            262
  50–64 first       13,732,446          187,425       46,725         6604          316,673           4296            1521            250
   65+ first        13,734,070          165,249       48,442         6557          225,287           2323             940            204
      POP           13,670,909          131,505       50,502         6593          306,758           3009            1539            245

                                              Figure 5 shows that any vaccination strategies significantly reduced the number of
                                        incidences and mortalities, compared with no vaccination. Furthermore, Table 6 showed
                                        that any vaccination strategies under any SD level can reduce the number of incidences and
                                        fatalities by more than 10 times, compared with no SD at all. In particular, the highest SD
                                        level reduced the number by more than 4 times, compared with other SD levels. However,
                                        if the highest SD level persists for months, economic and social damage must be considered.
                                        Under SD level 0 or 1, when SD was minimally or not at all implemented, vaccination
                                        priority for the 20–49 age group reduced the cumulative incidence the most, and prioritizing
                                        the 65 or older group had the greatest reduction in the number of deaths. This result is
                                        consistent with the results of previous studies that did not assume SD [26]. However, under
                                        SD level 2 and 3, vaccination priority for 50–64 and 65 or older age groups reduced the
                                        cumulative confirmed cases the most, respectively.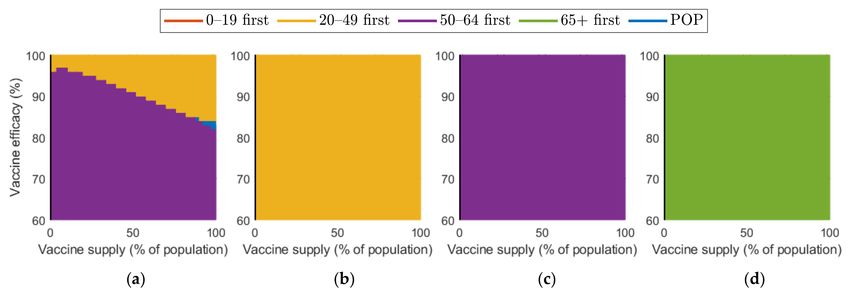
Int. J. Environ. Res. Public Health 2021, 18, 4240                                                                               10 of 19

                                              We also investigated the effect of vaccination priority strategies on the number of
                                        confirmed cases and deaths when the SD level changed adaptively according to the Korean
                                        governmental strategies [40]. The SD level changing criteria are presented in Table 3.
                                        Figure 6 illustrates the transition of SD level according to the incidence, and Figure 7 shows
                                        the reduction rates in confirmed cases and deaths for each vaccination strategies, compared
                                        with the case of no vaccination. The exact values of cumulative confirmed cases and deaths
                                        of each scenario in Figure 7 are shown in Table 7. The changes of SD level according to
                                        confirmed cases and SD level criteria when no vaccination was given is presented in Figure
                                        S11 in Supplementary Section C. Both in Figures 6 and 7, the colored circles for strategies
                                        “0–19 first”, “20–49 first”, “50–64 first”, and “65+ first” denote the point when vaccination
                                        of the priority target population has reached 70%. Beyond this colored circle, vaccination
                                        was administered to other age groups proportional to their population until 70% of the
                                        total population was vaccinated.

                             Figure 6. Transition of SD level according to the incidence under different scenarios.

      Figure 7. Effects of vaccination priority strategies when SD level changes adaptively according to the incidence. Time series
      of (a) reduction in cumulative confirmed cases and (b) reduction in deaths.

                                              Figure 6 shows that SD level was higher in the case of no vaccination than in other
                                        vaccination cases for most of the time, because, as shown in Figure 7, the number of
                                        confirmed cases in the case of no vaccination was much larger than that in other cases,
                                        making the SD level higher than that in other cases for most of the time. Figure 6 shows that
                                        without vaccination, SD level alternates between 2 and 3, while any vaccination strategy
                                        will lower the required SD level to 1. Figure 7 shows that reduction in death is substantially
                                        effective with strategy “65+ first”, compared with other strategies since vaccination targets
Int. J. Environ. Res. Public Health 2021, 18, 4240 11 of 19
the age group with the highest death rate, and any vaccination strategy successfully reduces
the cumulative confirmed cases, compared with no vaccination scenario.
Table 7. Values of cumulative confirmed cases and deaths with SD levels changing adaptively.
Scenarios Cumulative Confirmed Cases Death
No Vaccine 50,538 1409
0–19 first 32,028 1000
20–49 first 29,361 1092
50–64 first 29,106 903
65+ first 28,774 527
POP 28,249 839
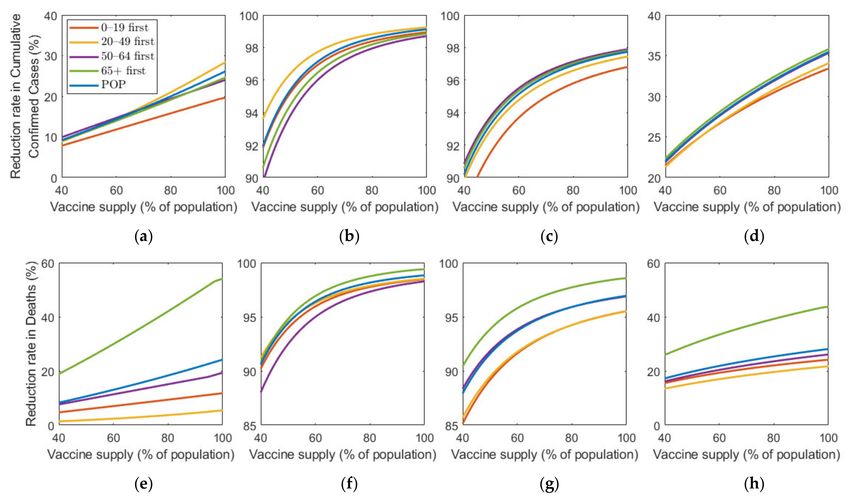
Figure 8 shows the effect of vaccine supply on the reduction in cumulative confirmed
cases and mortalities for different SD levels. Instead of focusing on the vaccine strategy
introduced previously at 70% coverage of the total population, we explored the effects
for different vaccination coverages. As vaccine supply varied, we assumed that, in each
vaccination priority strategy, vaccine was initially administered to the target age groups by
x% of the target population and then administered to the other age groups proportionally
to their population until x% of the total population was vaccinated, where x% ranged from
0% to 100%. Similarly, the POP strategy also considered variation in vaccine supply using
the same total coverage as that in the other strategies.
Figure 8. Impact of vaccination coverage rate on the reduction in cumulative confirmed cases and deaths for different SD
levels: (a,e) 0, (b,f) 1, (c,g) 2, and (d,h) 3.
Figure 8 shows that the reduction rate for the number of confirmed cases and deaths
increased as vaccine supply rate increased in any SD levels. In particular, in the absence
of SD, the reduction rate for the number of confirmed cases and deaths increased rapidlyInt. J. Environ. Res. Public Health 2021, 18, 4240 12 of 19
as the rate of vaccine supply increased. However, under SD, the reduction rate gradually
increased with increasing vaccine supply. For the reduction in deaths, “65+ first” strategy
was the most effective for any vaccine supply in all SD levels. However, the most effective
strategy for reducing cumulative confirmed cases varied depending on SD level or supply.
In SD level 0, when vaccine supply was relatively limited, “50–64 first” was the most
effective strategy in reducing cumulative confirmed cases, but as supply increases, “20–49
first” was the best strategy. Strategies “20–49 first”, “50–64 first”, and “65+ first” were the
most effective for any vaccine supply in SD level 1, 2, and 3, respectively, although the
difference of reduction rate is minimal, compared with other strategies.
Figure 9 shows the effect of vaccine efficacy on the reduction in cumulative confirmed
cases and mortalities.
Figure 9. Impact of vaccination efficacy on the reduction in cumulative confirmed cases and deaths for different SD levels:
(a,e) 0, (b,f) 1, (c,g) 2, and (d,h) 3.
Figure 9 illustrates that an increase in vaccine efficacy resulted in an increase in
reduction rate under any SD level. Similar to the results about vaccine supply, as the
vaccine efficiency increased, the reduction rate of the number of confirmed cases and
deaths increased much more rapidly in the absence of SD than in the case of SD. Moreover,
“65+ first” strategy was the most effective for any vaccine efficacy in all SD levels for
reducing deaths. The most effective strategy for reducing cumulative confirmed cases
varied depending on SD level or vaccine efficacy. At SD level 0, when vaccine efficacy was
relatively less effective, “50–64 first” was the most effective strategy in reducing cumulative
confirmed cases, but with higher efficacy, “20–49 first” became the best strategy. Strategies
“20–49 first”,”50–64 first”, and “65+ first” were the most effective for any vaccine supply
in SD level 1, 2, and 3, respectively, although the reduction rate difference is minimal,
compared with other strategies.
Figures 10 and 11 show the combined effect of vaccine supply and efficacy on the
reduction in cumulative confirmed cases and mortalities, respectively. Given the vac-
cine supply and efficacy, the best vaccination priority strategy for reducing cumulative
confirmed cases and deaths was found for each SD level.Int. J. Environ. Res. Public Health 2021, 18, 4240 13 of 19
Figure 10. Vaccination priority strategy for the best reduction in cumulative confirmed cases of various vaccination supplies
and efficacies under different SD levels: (a) 0, (b) 1, (c) 2, and (d) 3.
Figure 11. Effect of vaccination supply and efficacy on the reduction in mortality for different SD levels: (a) 0, (b) 1, (c) 2,
and (d) 3.
Figure 10 shows that, in the case of no SD, “20–49 first” was the best strategy in
terms of reducing the number of confirmed cases when both vaccine supply and efficacy
were sufficiently large, but “50–64 first” gave the best reduction when vaccine supply and
efficacy were relatively small. When SD level 1 was implemented, “20–49 first” resulted
in the best reduction. However, in the case of SD level 2 and 3, “50–64 first” and “over 65
first” were the best strategy, respectively.
Regarding mortalities, Figure 11 illustrates that “over 65 first” was the best strategy
for reducing the number of mortalities under any levels of SD, except for the case that
vaccine supply was relatively low in SD levels 0 or 1.
Additionally, we investigated the effects of vaccine allocation order based on the age
groups 0–19, 20–49, 50–64, and 65+. Unlike the previous strategies, in which vaccine was
distributed to the rest of the population after covering the target coverage rate of the initial
age group, the next age group was selected for vaccination after the first group, where all
four groups were vaccinated eventually. We assumed that only one group was vaccinated
at a time with a coverage of 70% until the next vaccination group started vaccinating. Since
there are four groups, there were 4! = 24 different scenarios to vaccinate all the age groups
in order. Like previous results, the effects of vaccine allocation order were examined based
on reduction of the number of cumulative confirmed cases and deaths, compared with
when vaccine was not given for each SD level. Figure 12 shows the details and orders of
the vaccine administration for each scenario. Figure 13 shows the effects of each scenarioInt. J. Environ. Res. Public Health 2021, 18, 4240 14 of 19
at different SD levels. The optimal vaccine allocation order was determined for reducing
cumulative confirmed cases and deaths for each SD level; the optimal results were colored
red in Figure 13.
Figure 12. Scenarios of vaccination allocation orders.
Figure 13. Impact of vaccination allocation scenarios on the reduction in cumulative confirmed cases and deaths for different
SD levels: (a,e) 0, (b,f) 1, (c,d) 2, and (d,h) 3.
In Figure 13, for reducing the number of deaths, Scenario 23 (65+ → 50–64 → 0–19 →
20–49), Scenario 22 (65+ → 20–49 → 50–64 → 0–19), Scenario 24 (65+ → 50–64 → 20–49 →
0–19), and Scenario 23 (65+ → 50–64 → 0–19 → 20–49) were the most effective orders at
SD level 0, 1, 2, and 3, respectively. That is, for any SD level, starting with the vaccination
of the eldest age group 65+ yielded the best result for reducing mortalities. For reducing
the number of cumulative confirmed cases, Scenario 9 (20–49 → 50–64 → 0–19 → 65+),Int. J. Environ. Res. Public Health 2021, 18, 4240 15 of 19
Scenario 11 (20–49 → 65+ → 0–19 → 50–64), Scenario 18 (50–64 → 65+ → 20–49 → 0–19),
and Scenario 22 (65+ → 20–49 → 50–64 → 0–19) were the most effective orders at SD level
0, 1, 2, and 3, respectively.
4. Discussion
In this study, we developed an age-structured mathematical model for describing
the transmission of COVID-19, including vaccination. Using the model, we investigated
the effect of vaccination priority strategies for different age groups on the transmission
dynamics of COVID-19 under various scenarios of SD in Seoul/Gyeonggi area in Korea.
We estimated the infection probability of each age group under different levels of
SD in the focus area by fitting the actual data of the confirmed cases by the least squares
method. SD is one of the main NPIs implemented in Korea, and it played an important
role in preventing a massive increase in the number of incidences and mortalities [36–39].
The effect of SD was reflected in terms of the contact matrix in our model, and the change
in the number of confirmed patients due to direct/indirect effects of SD was used in the
estimation of the infection probability. The change in the intensity of SD influenced the
magnitude of the infection force, which was proportional to the infection probability and
the entries of the contact matrix in the model Equation (1).
We observed that the reproduction number Rt value decreased as the intensity of SD
increased (Table 5), which shows the effect of NPIs implemented by the government in the
course of our study.
To investigate the effect of vaccination in the target area, we reflected the vaccination
plan prepared by the Korean government. The vaccination efficacy was calculated as 88%,
based on the actual vaccine supply plan [8] in Korea and the efficacy of each vaccine as
shown in Table 1. In the same manner as in the Korean government’s vaccination plan, we
divided the total population into four age groups, 0–19, 20–49, 50–64, and 65 or older, and
investigated the effect of various vaccination priorities for the age groups on the reduction
in the number of confirmed cases and mortalities under different levels of SD implemented
in Korea. We found that prioritization of COVID-19 vaccination for the eldest age group of
65 or older resulted in the greatest reduction in the total mortalities under any levels of SD.
This result is consistent with WHO recommendations to prioritize COVID-19 vaccination
for the elder age groups [49]. Recent studies suggested prioritizing vaccine allocation
for younger age groups with higher contact rate to effectively reduce the incidence of
infection [26], which is consistent with our results for the case that no or a low-level SD
was implemented during the vaccination period. However, when a higher level of SD was
implemented, our results showed that prioritizing COVID-19 vaccination for the elder age
groups was the better strategy to reduce the number of confirmed cases. These results can
be explained by the characteristics of the elderly life in Korea: when the intensity of SD is
high, the elderly people who have close contacts in confined spaces, such as nursing homes
and religious facilities, are more vulnerable to infection.
The Korean government has criteria for changing the intensity of SD according to the
size of the number of confirm case [40]. By reflecting these criteria in the simulation, we
investigated the effect of age-dependent vaccination priority strategies. The simulation
results showed that vaccine priority for 65 or older group minimized the number of
mortalities (Figure 7). One interesting thing is that, in the case of “20–49 first”, the reduction
rate in mortality was lower than even that in the case of no vaccination. This can be
explained by the fact that it takes more time to complete the vaccination at 70% for the
“20–49” age group than for the other age group, as the former had the highest population
ratio among all age groups [48], and thus vaccination for the elder age group with the
highest mortality rate was delayed.
We investigated the effect of various vaccine supply rates on the reduction in the
number of confirmed cases and mortalities (Figure 8). The results showed that the number
of confirmed cases and deaths decreased very rapidly with increasing vaccine supply in
the case of no SD, but, as the level of SD increased, the reduction rate in the number ofInt. J. Environ. Res. Public Health 2021, 18, 4240 16 of 19
confirmed cases and deaths decreased when vaccine supply increased. In other words, as
the SD intensity decreased, the effectiveness of the vaccine supply in reducing the number
of confirmed patients and deaths increased. Similar results were obtained qualitatively in
the simulation about vaccine efficacy (Figure 9). Thus, in the case of no or low-level SD, a
sufficient supply of vaccines with high efficacy is very important in reducing the number
of confirmed cases and deaths.
We investigated the effect on the reduction in cumulative confirmed cases and deaths
under different SD levels when vaccine supply and efficacy were considered together.
Considering the currently expected vaccine supply and vaccine efficiency in Korea, “over
65 first” was the best strategy for reducing mortalities under all SD levels. Concerning
the cumulative confirmed cases, “50–64 first” and “over 65 first” were the best strategy
under SD level 2 and 3, respectively, but in SD level 1, prioritizing age group 20–49 gave
the best result. In SD level 0, “50–64 first” was the best strategy in reducing the cumulative
confirmed cases, except for the case that both of vaccine efficacy and supply are sufficiently
large, for which “20–49 first” gave the best result.
Lastly, we examined the effects of vaccine allocation order on age groups 0–19, 20–49,
50–64, and 65+, where all four groups were vaccinated in succession with 70% coverage.
The reduction in cumulative confirmed cases and deaths were tested for 24 different
scenarios in each SD level. Depending on SD level, the optimal results varied, but for all
SD levels, the optimal vaccination order for reducing deaths started with vaccinating the
eldest group 65+.
The present study had some limitations. Priority vaccination for essential workers
has been planned by the Korean government, but it is not considered in our simulation.
Currently, the contact matrix is not available for essential workers related to COVID-19
in Korea; however, the total number of essential workers is only approximately 1% of
the population in Korea. As we focused on the effect of vaccination priority strategy on
different age groups, essential workers were not included in our model. Moreover, the
infection probability in our model is affected by the contact matrix and incidence data,
which differ by countries and regions. Thus, if the approach used in our study is applied to
other countries or regions, the results would be different from ours.
Nevertheless, despite these limitations, we successfully analyzed the effect of the
vaccination priority policy for different age groups on the reduction in the number of
confirmed cases and mortalities by using our newly developed mathematical model, which
reflected the actual SD policy and vaccination plan implemented in Korea. In addition, we
investigated the effective age-dependent vaccination priority strategies to minimize the
number of confirmed cases and deaths for various vaccine supplies and vaccine efficiencies.
We believe that the modeling approach in this study can be used to investigate the potential
effect of age-dependent vaccination priority strategies with various vaccine supplies and
efficacies on the reduction in confirmed cases and mortalities in other target areas.
Supplementary Materials: The following are available online at https://www.mdpi.com/article/10
.3390/ijerph18084240/s1, Section A1: Social Distancing (SD) in Korea (Table S1: Description of social
distancing determined by Korean government); Section A2: Overall Vaccine Efficacy Calculation; Sec-
tion B1: Contact Matrix (Figure S1: Contact matrix for different SD levels; SD level (a) 0, M0 , (b) 1, M1 ,
(c) 2, M2 , and (d) 3, M3 ); Section B2: The Effective Reproduction Number Rt ; Section B3: lsqcurvefit;
Section B4: Infection Probability bi ; Section C: additional result figures (Figure S2: Estimation of trans-
mission rate: confirmed cases of each SD level; Figure S3: Estimation of transmission rate: confirmed
cases of each age group for SD level 0; Figure S4: Estimation of transmission rate: confirmed cases of
each age group for SD level 1; Figure S5: Estimation of transmission rate: confirmed cases of each age
group for SD level 2; Figure S6: Estimation of transmission rate: confirmed cases of each age group
for SD level 3; Figure S7: Estimation of transmission rate: cumulative confirmed cases of each age
group for SD level 0; Figure S8: Estimation of transmission rate: cumulative confirmed cases of each
age group for SD level 1; Figure S9: Estimation of transmission rate: cumulative confirmed cases of
each age group for SD level 2; Figure S10: Estimation of transmission rate: cumulative confirmed
cases of each age group for SD level 3); Figure S11. Effects of vaccination priority strategies when SDInt. J. Environ. Res. Public Health 2021, 18, 4240 17 of 19
level changes adaptively according to confirmed cases. Time series of (a) cumulative confirmed cases
and (b) deaths.
Author Contributions: Conceptualization, Y.C., J.S.K., C.H.L.; methodology, Y.C., J.S.K., J.E.K., and
C.H.L.; software, Y.C. and J.S.K.; validation, Y.C., J.S.K., J.E.K., H.C., and C.H.L.; formal analysis, Y.C.,
J.S.K., and C.H.L.; investigation, Y.C., J.S.K., J.E.K., H.C., and C.H.L.; data curation, Y.C., J.S.K., and
H.C.; Writing—Original draft preparation, Y.C., J.S.K., J.E.K., H.C., and C.H.L.; Writing—Review and
Editing, Y.C., J.S.K., and C.H.L.; visualization, Y.C., J.S.K., H.C., and C.H.L.; supervision, C.H.L. All
authors have read and agreed to the published version of the manuscript.
Funding: C.H.L. was supported by a National Research Foundation of Korea (NRF) grant funded by
the Korea government (MSIT) (2019R1F1A1040756), and by the BK21 Four funded by the Ministry of
Education (MOE, Korea) and National Research Foundation of Korea (NRF). J.E.K. was supported by
Basic Science Research Program through the National Research Foundation of Korea (NRF) funded
by the Ministry of Education (2018R1D1A1B07047163).
Institutional Review Board Statement: Not applicable.
Informed Consent Statement: Not applicable.
Data Availability Statement: The daily number of confirmed cases associated with COVID-19 in
Seoul and Gyeonggi Province was accessed from publicly available sources, available at https://www.
seoul.go.kr/coronaV/coronaStatus.do (accessed on 15 February 2021) and http://www.gidcc.or.kr/
(accessed on 15 February 2021).
Conflicts of Interest: The authors declare no conflict of interest. The funders had no role in the study
design, data collection and analysis, the decision to publish, or preparation of the manuscript.
References
1. Wang, C.; Horby, P.W.; Hayden, F.G.; Gao, G.F. A novel coronavirus outbreak of global health concern. Lancet 2020, 395, 470–473.
[CrossRef]
2. World Health Organization. WHO Director-General’s Opening Remarks at the Media Briefing on COVID-19—11 March 2020.
Available online: https://www.who.int/director-general/speeches/detail/who-director-general-s-opening-remarks-at-the-
media-briefing-on-covid-19---11-march-2020 (accessed on 26 November 2020).
3. World Health Organization. Coronavirus Disease (COVID-19) Pandemic. Available online: https://www.who.int/emergencies/
diseases/novel-coronavirus-2019 (accessed on 26 November 2020).
4. Park, Y.J.; Choe, Y.J.; Park, O.; Park, S.Y.; Kim, Y.M.; Kim, J. Contact tracing during coronavirus disease outbreak, South Korea,
2020. Emerg. Infect. Dis. 2020, 26, 2465–2468. [CrossRef]
5. Ministry of Health and Welfare. Regular Briefing on COVID-19 Posted on 16 February 2021. Available online: http:
//ncov.mohw.go.kr/tcmBoardView.do?brdId=3&brdGubun=31&dataGubun=&ncvContSeq=4826&contSeq=4826&board_id=
312&gubun=ALL (accessed on 25 February 2021).
6. Dar, A.B.; Lone, A.H.; Zahoor, S.; Khan, A.A.; Naaz, R. Applicability of mobile contact tracing in fighting pandemic (COVID-19):
Issues, challenges and solutions. Comput. Sci. Rev. 2020, 38, 100307. [CrossRef] [PubMed]
7. The New York Times. Coronavirus Vaccine Tracker. Available online: https://www.nytimes.com/interactive/2020/science/
coronavirus-vaccine-tracker.html (accessed on 26 November 2020).
8. Ministry of Health and Welfare. Vaccination Schedule Posted on 28 January 2021. Available online: http://ncov.mohw.go.kr/
tcmBoardView.do?brdId=3&brdGubun=31&dataGubun=&ncvContSeq=4713&contSeq=4713&board_id=312&gubun=ALL# (ac-
cessed on 16 February 2021).
9. Ministry of Health and Welfare. Vaccination Schedule Posted on 16 February 2021. Available online: http://ncov.mohw.go.kr/
tcmBoardView.do?brdId=3&brdGubun=31&dataGubun=&ncvContSeq=4824&contSeq=4824&board_id=312&gubun=ALL (ac-
cessed on 16 February 2021).
10. Baden, L.R.; El Sahly, H.M.; Essink, B.; Kotloff, K.; Frey, S.; Novak, R. Efficacy and safety of the mRNA-1273 SARS-CoV-2 vaccine.
N. Engl. J. Med. 2021, 384, 403–416. [CrossRef]
11. Polack, F.P.; Thomas, S.J.; Kitchin, N.; Absalon, J.; Gurtman, A.; Lockhart, S. Safety and efficacy of the BNT162b2 mRNA Covid-19
vaccine. N. Engl. J. Med. 2020, 383, 2603–2615. [CrossRef] [PubMed]
12. Voysey, M.; Clemens SA, C.; Madhi, S.A.; Weckx, L.Y.; Folegatti, P.M.; Aley, P.K. Safety and efficacy of the ChAdOx1 nCoV-19
vaccine (AZD1222) against SARS-CoV-2: An interim analysis of four randomised controlled trials in Brazil, South Africa, and the
UK. Lancet 2021, 397, 99–111. [CrossRef]
13. Johnson & Johnson COVID-19 Vaccine Authorized by, U.S. FDA For Emergency Use—First Single-Shot Vaccine in Fight Against
Global Pandemic. Available online: https://www.jnj.com/johnson-johnson-announces-single-shot-janssen-covid-19-vaccine-
candidate-met-primary-endpoints-in-interim-analysis-of-its-phase-3-ensemble-trial (accessed on 3 February 2021).Int. J. Environ. Res. Public Health 2021, 18, 4240 18 of 19
14. Novavax COVID-19 Vaccine Demonstrates 89.3% Efficacy in UK Phase 3 Trial. Available online: https://ir.novavax.com/news-
releases/news-release-details/novavax-covid-19-vaccine-demonstrates-893-efficacy-uk-phase-3 (accessed on 3 February 2021).
15. Davies, N.G.; Klepac, P.; Liu, Y.; Prem, K.; Jit, M.; Eggo, R.M. Age-dependent effects in the transmission and control of COVID-19
epidemics. Nat. Med. 2020, 26, 1205–1211. [CrossRef]
16. Dattner, I.; Goldberg, Y.; Katriel, G.; Yaari, R.; Gal, N.; Miron, Y. The role of children in the spread of COVID-19: Using household
data from Bnei Brak, Israel, to estimate the relative susceptibility and infectivity of children. PLoS Comput. Biol. 2021, 17, e1008559.
[CrossRef] [PubMed]
17. Dong, Y.; Mo, X.I.; Hu, Y.; Qi, X.; Jiang, F.; Jiang, Z.; Tong, S. Epidemiological characteristics of 2143 pediatric patients with 2019
coronavirus disease in China. Pediatrics 2020, 58, 712–713. [CrossRef]
18. Zhou, F.; Yu, T.; Du, R.; Fan, G.; Liu, Y.; Liu, Z. Clinical course and risk factors for mortality of adult inpatients with COVID-19 in
Wuhan, China: A retrospective cohort study. Lancet 2020, 395, 1054–1062. [CrossRef]
19. Centers for Disease Control and Prevention. Vaccine Rollout Recommendations. Available online: https://www.cdc.gov/
coronavirus/2019-ncov/vaccines/recommendations.html (accessed on 21 February 2021).
20. Mukandavire, Z.; Nyabadza, F.; Malunguza, N.J.; Cuadros, D.F.; Shiri, T.; Musuka, G. Quantifying early COVID-19 outbreak
transmission in South Africa and exploring vaccine efficacy scenarios. PLoS ONE 2020, 15, e0236003. [CrossRef]
21. MacIntyre, C.R.; Costantino, V.; Trent, M.J. Modelling of COVID-19 vaccination strategies and herd immunity, in scenarios of
limited and full vaccine supply in NSW, Australia. medRxiv 2020. [CrossRef]
22. Iboi, E.A.; Ngonghala, C.N.; Gumel, A.B. Will an imperfect vaccine curtail the COVID-19 pandemic in the US? Infect. Dis. Model.
2020, 5, 510–524. [PubMed]
23. Gumel, A.B.; Iboi, E.A.; Ngonghala, C.N.; Ngwa, G.A. Mathematical assessment of the roles of vaccination and non-
pharmaceutical interventions on COVID-19 dynamics: A multigroup modeling approach. medRxiv 2021, 2020-12. [CrossRef]
24. Foy, B.H.; Wahl, B.; Mehta, K.; Shet, A.; Menon, G.I.; Britto, C. Comparing COVID-19 vaccine allocation strategies in India:
A mathematical modelling study. Int. J. Infect. Dis. 2020, 103, 431–438. [CrossRef]
25. Paltiel, A.D.; Schwartz, J.L.; Zheng, A.; Walensky, R.P. Clinical Outcomes Of A COVID-19 Vaccine: Implementation Over Efficacy:
Study examines how definitions and thresholds of vaccine efficacy, coupled with different levels of implementation effectiveness
and background epidemic severity, translate into outcomes. Health Aff. 2021, 40, 42–52. [CrossRef]
26. Bubar, K.M.; Reinholt, K.; Kissler, S.M.; Lipsitch, M.; Cobey, S.; Grad, Y.H.; Larremore, D.B. Model-informed COVID-19 vaccine
prioritization strategies by age and serostatus. Science 2021, 371, 916–921. [CrossRef] [PubMed]
27. Buckner, J.H.; Chowell, G.; Springborn, M.R. Dynamic Prioritization of COVID-19 Vaccines When Social Distancing is Limited for
Essential Workers. medRxiv 2020, 118. [CrossRef]
28. Matrajt, L.; Eaton, J.; Leung, T.; Brown, E.R. Vaccine optimization for COVID-19, who to vaccinate first? medRxiv 2020. [CrossRef]
29. Shim, E. Optimal Allocation of the Limited COVID-19 Vaccine Supply in South Korea. J. Clin. Med. 2021, 10, 591. [CrossRef]
[PubMed]
30. Hamza, B.; Sara, B.; Omar, Z.; Imane, A.; Mostafa, R. New automated optimal vaccination control with a multi-region SIRS
epidemic mode. Commun. Math. Biol. Neurosci. 2020, 70. [CrossRef]
31. Martonosi, S.E.; Behzad, B.; Cummings, K. Pricing the COVID-19 Vaccine: A Mathematical Approach. arXiv 2020,
arXiv:2101.03234.
32. Seoul Metropolitan Government. Available online: https://www.seoul.go.kr/coronaV/coronaStatus.do (accessed on 15 Febru-
ary 2021).
33. Gyeonggi Infectious Disease Control Center. Available online: http://www.gidcc.or.kr/ (accessed on 15 February 2021).
34. Merow, C.; Urban, M.C. Seasonality and uncertainty in global COVID-19 growth rates. Proc. Natl. Acad. Sci. USA 2020, 117,
27456–27464. [CrossRef]
35. Ratnesar-Shumate, S.; Williams, G.; Green, B.; Krause, M.; Holland, B.; Wood, S. Simulated sunlight rapidly inactivates SARS-
CoV-2 on surfaces. J. Infect. Dis. 2020, 222, 214–222. [CrossRef]
36. Choi, Y.; Kim, J.S.; Choi, H.; Lee, H.; Lee, C.H. Assessment of Social Distancing for Controlling COVID-19 in Korea: An
Age-Structured Modeling Approach. Int. J. Environ. Res. Public Health 2020, 17, 7474. [CrossRef]
37. Kim, S.; Ko, Y.; Kim, Y.J.; Jung, E. The impact of social distancing and public behavior changes on COVID-19 transmission
dynamics in the Republic of Korea. PLoS ONE 2020, 15, e0238684. [CrossRef]
38. Choi, W.; Shim, E. Optimal strategies for social distancing and testing to control COVID-19. J. Theor. Biol. 2021, 512, 110568.
[CrossRef] [PubMed]
39. Kim, S.; Jeong, Y.D.; Byun, J.H.; Cho, G.; Park, A.; Jung, J.H. Evaluation of COVID-19 epidemic outbreak caused by temporal
contact-increase in South Korea. Int. J. Infect. Dis. 2020, 96, 454–457. [CrossRef]
40. Ministry of Health and Welfare. Regular Briefing on COVID-19 Posted on 1 November 2020. Available online: http:
//ncov.mohw.go.kr/tcmBoardView.do?brdId=&brdGubun=&dataGubun=&ncvContSeq=360602&contSeq=360602&board_
id=&gubun=ALL# (accessed on 23 February 2020).
41. Ministry of Health and Welfare. Regular Briefing on COVID-19 Posted on 24 November 2020. Available online: http://ncov.mohw.
go.kr/tcmBoardView.do?brdId=&brdGubun=&dataGubun=&ncvContSeq=361307&contSeq=361307&board_id=&gubun=ALL
(accessed on 23 February 2020).You can also read