Shark Gillnet and Shark Hook sectors - Department of ...
←
→
Page content transcription
If your browser does not render page correctly, please read the page content below
Chapter 12
      Shark Gillnet and Shark
      Hook sectors
      T Emery, J Woodhams and R Curtotti

FIGURE 12.1 Relative fishing intensity in (a) the Shark Gillnet Sector and (b) the
Shark Hook Sector of the Southern and Eastern Scalefish and Shark Fishery,
2018–19 fishing season
(a)

                                                                                 ABARES     243
                                                              Fishery status reports 2019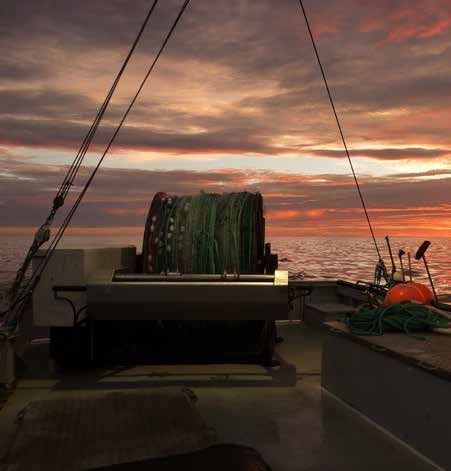
Chapter 12: Shark Gillnet and Shark Hook sectors
FIGURE 12.1 Relative fishing intensity in (a) the Shark Gillnet Sector and (b) the
Shark Hook Sector of the Southern and Eastern Scalefish and Shark Fishery,
2018–19 fishing season continued
(b)
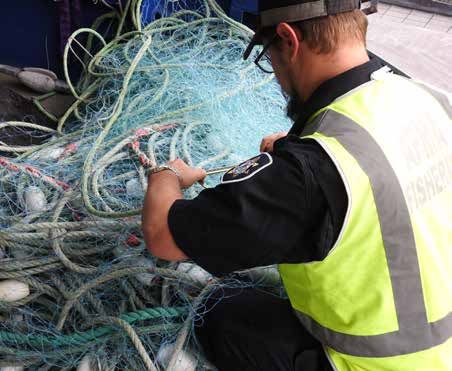
Measuring gillnet
Dylan Maskey, AFMA
244 ABARES
Fishery status reports 2019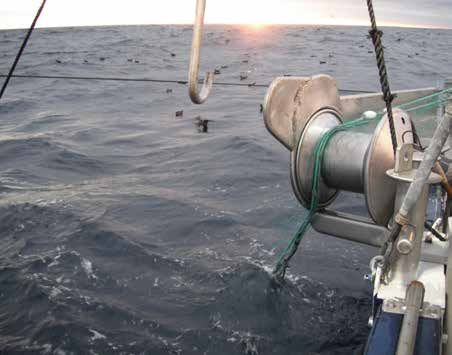
Chapter 12: Shark Gillnet and Shark Hook sectors

TABLE 12.1 Status of the Shark Gillnet and Shark Hook sectors
Status                               2017                          2018               Comments
Biological status          Fishing       Biomass        Fishing        Biomass
                           mortality                    mortality
Elephantfish                                                                          Standardised CPUE remains
(Callorhinchus milii)                                                                 relatively stable and
                                                                                      above the limit reference
                                                                                      point, indicating stability
                                                                                      in biomass and fishing
                                                                                      mortality.
Gummy shark                                                                           Catch is below RBC.
(Mustelus antarcticus)                                                                Estimates of pup production
                                                                                      are close to, or above, the
                                                                                      target reference point.
Sawsharks                                                                             CPUE is above the target
(Pristiophorus cirratus,                                                              reference point; catch is
P. nudipinnis)                                                                        below RBC.
School shark                                                                          Uncertain if fishing mortality
(Galeorhinus galeus)                                                                  in 2018–19 will allow recovery
                                                                                      within the specified time
                                                                                      frame. Biomass is likely
                                                                                      to remain below 20% of
                                                                                      unexploited levels.
Economic status a          NER were –$3.9 million in 2014–15. Preliminary estimates for 2015–16 and
                           2016–17 indicate that NER are likely to become positive. Although gummy shark
                           biomass is not constraining NER, the management of non-target species and
                           marine mammal interactions has likely contributed to low NER in recent years.
a NER refer to the entire Gillnet, Hook and Trap Sector; therefore, this figure includes scalefish. Shark species
account for around 70% of total Gillnet, Hook and Trap Sector gross value of production.
Notes: CPUE Catch-per-unit-effort. NER Net economic returns. RBC Recommended biological catch.

Fishing mortality            Not subject to overfishing              Subject to overfishing                 Uncertain
Biomass		                    Not overfished		                        Overfished		                           Uncertain

12.1 Description of the fishery
Area fished
The Shark Gillnet and Shark Hook sectors (SGSHS) of the Southern and
Eastern Scalefish and Shark Fishery (SESSF) extend south from the New South Wales –
Victoria border, around Tasmania, and west to the South Australia – Western Australia
border. Most fishing occurs in waters adjacent to the coastline and throughout Bass
Strait (Figure 12.1).

Fishing methods and key species
The SGSHS uses demersal gillnet and longline to target gummy shark (Mustelus
antarcticus). School shark (Galeorhinus galeus), elephantfish (Callorhinchus milii)
and sawsharks (Pristiophorus cirratus and P. nudipinnis) are byproducts from the
gummy shark fishery. School shark was historically the primary target species in
the fishery, but biomass was reduced below the limit reference point around 1990.
Although overfished, school shark is the second most economically important species
in the fishery.

                                                                                                       ABARES     245
                                                                                    Fishery status reports 2019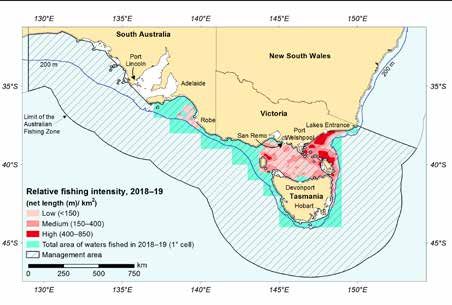
Chapter 12: Shark Gillnet and Shark Hook sectors

Other important byproduct species (by weight) are snapper (Chrysophrys auratus),
whiskery shark (Furgaleus macki), broadnose sevengill shark (Notorynchus
cepedianus), bronze whaler (Carcharhinus brachyurus), draughtboard shark
(Cephaloscyllium laticeps) and blue morwong (Nemadactylus valenciennesi).

Management methods
The fishery is managed using a combination of input controls (gear restrictions and
closed areas) and output controls (individual transferable quotas and limits on the
proportion of school shark to gummy shark catch). The four principle commercial
stocks taken in the SGSHS are managed under the SESSF harvest strategy framework
(AFMA 2014a). The harvest strategy is summarised in Chapter 8. School shark is
subject to an incidental catch limit, and other measures to reduce targeting and catch.
Spatial closures across the fishery protect pupping areas and school shark.
Gear and area closures have been implemented (primarily off South Australia) to
reduce the risk of interactions with Australian sea lions and dolphins. These have
changed the fishing areas and targeting behaviour of fishers, influenced the take of
target species and consequently affected catch-per-unit-effort (CPUE). These and
other key wildlife bycatch issues are discussed further in Chapter 8.
From 1 July 2015, electronic monitoring (e-monitoring) has been mandatory
for all full-time vessels in the SGSHS. The management aim is to review at least
10% of all recorded hauls to verify the accuracy of logbooks. In addition, gillnet
boats operating off South Australia’s Australian Sea Lion Management Zones are
subject to 100% review of video footage to monitor interactions with protected
species. The deployment of physical observers ceased with the commencement of
e-monitoring, but this meant that some important data from the fishery were not
collected, and physical observers were deployed again from September 2017 to
July 2018. In late 2018, trials of the Shark Industry Data Collection project (SIDaC)
were undertaken to collect size composition data and samples for close-kin work.

Fishing effort
Before spatial closures, which have been progressively implemented since 2003,
effort in the SGSHS was spread across the waters of South Australia and eastern
Victoria. However, the spatial closures outlined above have resulted in gillnet effort
being concentrated off Victoria (Figure 12.1). Effort in the gillnet sector peaked in
1987 at 99,000 km of gillnet hauled, but has decreased to around one-third of this
level in recent years. Hook effort has been variable in recent years, ranging between
1.1 million and 2.3 million hooks per season.

Catch history
Fishing for sharks in the waters off southern Australia began in the 1920s, using
longlines. During the 1970s and 1980s, the sector mainly targeted school shark
(Figure 12.2). Adoption of monofilament gillnets and concern about mercury content
in large school sharks, coupled with declining school shark catches, resulted in
gummy shark becoming the principal target species from around 1986 (Figures 12.2
and 12.3). This transition occurred in the early 1970s in Bass Strait, and later in the
waters off South Australia and Tasmania. Recent catch records indicate that trawl
operations in the SESSF are now landing more sawshark and elephantfish than
gillnet operations.

246 ABARES
     Fishery status reports 2019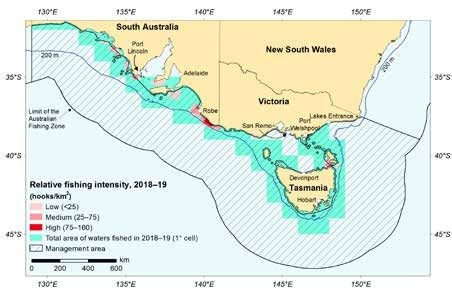
Chapter 12: Shark Gillnet and Shark Hook sectors

FIGURE 12.2 Annual landings and effort in the SGSHS, by species, 1970–2018
                                Figure 12.2 Catch and Effort: shark, GS & ShHS
                 5,000                                                                   125

                                                                                                                                   Elephantfish

                                                                                               Effort (thousand kilometre−lifts)
                 4,000                                                                   100                                       Sawsharks

                                                                                                                                   Gummy shark
Catch (tonnes)
                 3,000                                                                   75                                        School shark
                                                                                                                                   Equivalent
                                                                                                                                   gillnet effort
                 2,000                                                                   50

                 1,000                                                                   25

                    0                                                                    0
                         1970    1978     1986      1994      2002       2010     2018

Note: ‘Equivalent gillnet effort’ is an estimate of total effort after converting hook effort to the equivalent
gillnet effort using the methods in Walker et al. (1994).

FIGURE 12.3 Annual landings in the Commonwealth Trawl Sector, by species,
2001–2018
                                        Figure 12.3 Catch: shark, CTS
                  250
                                                                                                      Elephantfish

                  200                                                                                 Sawsharks

                                                                                                      Gummy shark
Catch (tonnes)

                  150                                                                                 School shark

                  100

                   50

                    0
                                2003     2006      2009      2012       2015     2018

                                                                                                            ABARES                             247
                                                                                         Fishery status reports 2019
Chapter 12: Shark Gillnet and Shark Hook sectors
TABLE 12.2 Main features and statistics for the SGSHS
Fishery statistics a 2017–18 fishing season 2018–19 fishing season
Stock TAC Catch GVP (2017–18) TAC Catch
(t) (t) (GHTS, CTS) (GHTS, CTS) (t) (t) (GHTS, CTS)
Elephantfish 122 62Chapter 12: Shark Gillnet and Shark Hook sectors
12.2 Biological status
Elephantfish (Callorhinchus milii)
Line drawing: Karina Hansen
Stock structure
Stock structure of elephantfish is not known, and populations are considered to
constitute a single stock for management purposes.
Catch history
Elephantfish is a small component (~3%) of landed catch of the four stocks assessed
in this chapter. Catch of elephantfish in the SGSHS increased during the 1970s and
peaked at almost 120 t in 1985 (Figure 12.4). Catch has since declined, and has been
relatively stable at around 50–60 t in recent years. Reported catch in 2018–19 in the
Gillnet, Hook and Trap Sector (GHTS) and the Commonwealth Trawl Sector (CTS)
combined was 50 t (Table 12.2). The level of discarding in the SGSHS is uncertain and
variable. Burch et al. (2018) used data from the Independent Scientific Monitoring
Program (ISMP) to estimate a discard rate of 57.4% for elephantfish in 2014. Data are
not available to update this rate. Castillo-Jordán et al. (2018) report state catch for
elephantfish from New South Wales, South Australia, Tasmania, Victoria and Western
Australia. Estimated total catch of elephantfish from all states (excluding Western
Australia) during 2013–2017 averaged around 3.7 t. Recreational catch of
elephantfish is unknown for all states but has been considered insignificant in
New South Wales and Tasmania (Woodhams et al. 2018a). In Victoria, historical
recreational catches have been significant, with up to 45 t caught in Western Port
in March–May 2008. Catch rates and popularity of this fishery have declined more
recently (Conron 2016), which presents an uncertainty in assessing this stock.
ABARES 249
Fishery status reports 2019Chapter 12: Shark Gillnet and Shark Hook sectors
FIGURE 12.4 Annual elephantfish catch and fishing season TAC in the SGSHS,
1970–2018
Figure 12.4 Catch: elephantfish, GS & ShHS
180
Discards
Catch
150
Actual TAC
Catch and TAC (tonnes)
120
90
60
30
0
1970 1978 1986 1994 2002 2010 2018
Notes: TAC Total allowable catch. Actual TAC includes carryover of undercatch or overcatch from the previous
season. Discard data are only available by calendar year and for 2007–2015.
Source: Sporcic & Thomson 2015; AFMA catch disposal records (2016–2018 catch data)
Stock assessment
Elephantfish has been managed as a tier 4 stock under the SESSF harvest strategy
framework since 2009. The tier 4 harvest strategy framework uses standardised
CPUE as an index of abundance.
The Shark Resource Assessment Group (SharkRAG) did not agree to apply the
harvest control rule for elephantfish in 2018 (to apply for the 2019–20 season) and
recommended rolling over the total allowable catch (TAC) from the 2018–19 season.
The main reasons were the high and sometimes variable levels of discarding of
the stock (which undermines the use of CPUE based on landed catches), uncertain
estimates of recreational catch (which are thought to be a significant portion of the
catch) and the challenges these present for applying the harvest control rule.
The CPUE standardisations performed for the stock (both including and excluding
discards) show relative stability in recent years (albeit with a decreasing trend)
when compared with CPUE in the late 1990s and early 2000s. The recent average
CPUE was above the target for the series including discards and slightly below the
target (but above the limit) for the series excluding discards. In making its TAC
recommendation for 2019–20, SharkRAG recorded that ‘it felt that it did not have any
new concerns about stock status’ (AFMA 2018a). Improved estimation of discarding
across the fishery should help to reduce uncertainty in the CPUE series in the
future. It was noted that these analyses will be updated after receiving advice from
South East Resource Assessment Group in 2019 on species that are currently difficult
to assess (AFMA 2019).
250 ABARES
Fishery status reports 2019Chapter 12: Shark Gillnet and Shark Hook sectors
Stock status determination
Although it was not possible to output a reliable recommended biological catch (RBC)
through a harvest control rule for this stock in 2018, the standardised CPUE series,
albeit variable, indicated relative stability and was above the limit reference point
based on the last accepted analysis in 2015. Catches since 2015 have been relatively
stable, and below the RBC and TAC because elephantfish are not actively targeted.
This indicates that the fishery is unlikely to be applying an unsustainable level of
fishing mortality to the stock. On this basis, the stock is classified as not overfished
and not subject to overfishing.
Gummy shark (Mustelus antarcticus)
Line drawing: Karina Hansen
Stock structure
The most recent research on stock structure for gummy shark indicates that there
are most likely two stocks in Australian waters: one in southern Australia, extending
from Bunbury in Western Australia to Jervis Bay in New South Wales, and another
in eastern Australia, extending from Newcastle to the Clarence River in New South
Wales (White & Last 2008). The southern Australian biological stock is split into four
populations for modelling purposes: the continental shelf of Bass Strait, Tasmania,
South Australia and Western Australia. The first three are assessed together by the
Commonwealth (Punt, Thomson & Sporcic 2016) and are reported here. The fourth is
assessed and reported separately by Western Australia (Braccini & Blay 2019).
Catch history
Catch of gummy shark in the SGSHS increased after 1970, initially as byproduct in
the school shark fishery, and then increasingly as a target as school shark catches
decreased from 1986 (Figure 12.5). Catch in the SGSHS reached a peak of around
2,300 t in 1993. It dropped to a low of 1,288 t in 2012, before increasing to around
1,700 t in recent years (Figure 12.5). Total Commonwealth catch (including from the
CTS) in 2018–19 was 1,682 t, which is approximately 79% of the total catch across the
four stocks assessed in this chapter. The level of discarding in the SGSHS is uncertain.
Burch et al. (2018) used ISMP data to estimate a discard rate of 5.1% for gummy
shark in 2014. Data are not available to update this rate. Castillo-Jordán et al. (2018)
report state catch for gummy shark for New South Wales, South Australia, Tasmania,
Victoria and Western Australia. Reported state catch of gummy shark during
2013–2017 averaged around 564 t (around 133 t if Western Australia is excluded).
State recreational catches are poorly known, with limited data reported—for
example, 37 t was reported in South Australia in 2013–14 and 934 fish were reported
caught in Western Australia in 2015–16 (Woodhams et al. 2018b). In 2018, SharkRAG
recommended deducting the weighted average state catch from the RBC, which is
standard practice for other SESSF species (AFMA 2019).
ABARES 251
Fishery status reports 2019Chapter 12: Shark Gillnet and Shark Hook sectors
FIGURE 12.5 Annual gummy shark catch and fishing season TAC in the SGSHS,
1970–2018
Figure 12.5 Catch: gummy shark, GS & ShHS
3,000
Discards
Catch
2,500
Actual TAC
Catch and TAC (tonnes)
2,000
1,500
1,000
500
0
1970 1978 1986 1994 2002 2010 2018
Notes: TAC Total allowable catch. Actual TAC includes carryover of undercatch or overcatch from the previous
season. Discard data are only available by calendar year and for 2007–2015.
Source: Punt, Thomson & Sporcic 2016; AFMA catch disposal records (2016–2018 catch data)
Stock assessment
The most recent update of the integrated stock assessment model for gummy
shark was in 2016, using data to the end of 2015 (Punt, Thomson & Sporcic 2016).
Updated inputs to the assessment included landing data from 2013 to 2015, revisions
to earlier catch and length-frequency data, new age-frequency data and updated
CPUE indices. Some changes to the model structure were also made: catches by
the different gear types are now assumed to occur simultaneously rather than
sequentially; the ‘hook fleet’ has been separated into trawl, deep and shallow fleets;
and allowances have been made for age-reading errors. As before, the assessment
uses estimated pup production as a proxy for biomass because of the expected close
relationship between pup production and female spawning biomass. This is because
most of the data come from the gillnet sector, which catches a narrow size range of
fish and does not catch adults.
Bass Strait, South Australian and Tasmanian regions were treated as separate
populations in the model, with no movement of animals between these populations
and no density-dependent effects of one population on another. The models share
some model-estimated parameter values, especially Tasmania, where the data are
unable to support full parameter estimation. The model also assumes commonality
in biological parameters, including age–length and length–weight relationships,
fecundity, gear selectivity, and overall availability as a function of age.
252 ABARES
Fishery status reports 2019Chapter 12: Shark Gillnet and Shark Hook sectors
The gillnet closures off South Australia have influenced catch and CPUE of gummy
shark in this area. When the 2014 assessment was run, there was concern that the
South Australian CPUE data were less reliable as an index of abundance in recent
years (Thomson & Sporcic 2014). Consequently, South Australian CPUE data after
2009 were not included in the 2014 or 2016 assessments.
The model estimated RBCs and relative pup production for each population. The RBCs
were then summed to give a stock-level RBC for the fishery. In addition, different gear
types are known to have different selectivities, which result in differences in the
average size of sharks caught. Consequently, a range of RBCs were calculated, based
on different catch proportions taken by line and gillnet, which were assessed against
their impact on pup production at a regional level (Punt, Thomson & Sporcic 2016).
The base-case assessment estimated 2016 pup production as a proportion of the
unfished level of pup production (P0; 1927) to be above 0.48P0 (48% of virgin pup
production) for all three populations modelled: 0.53P0 for Bass Strait (Figure 12.6a),
0.63P0 for South Australia (Figure 12.6b) and 0.75P0 for Tasmania (Figure 12.6c).
These are all slightly lower than those estimated by the 2014 assessment
(Thomson & Sporcic 2014).
Gillnet vessel
Mike Gerner, AFMA
ABARES 253
Fishery status reports 2019Chapter 12: Shark Gillnet and Shark Hook sectors
FIGURE 12.6 Estimated pup production as a proportion of unfished level of pup
production for gummy shark in (a) Bass Strait, (b) South Australia and (c) Tasmania,
1927–2016
Figure 12.6A CPUE: gummy shark (Bass Strait), SESSF
(a) 1.2
Bass Strait scenario 1
Limit reference point
1
Target reference point
Relative pup production
0.8
0.6
0.4
0.2
0
1932 1944 1956 1968 1980 1992 2004 2016
Figure 12.6B CPUE: gummy shark (South Australia), SESSF
(b)
1.2
South Australia scenario 1
Limit reference point
1
Target reference point
Relative pup production
0.8
0.6
0.4
0.2
0
1932 1944 1956 1968 1980 1992 2004 2016
Figure 12.6C CPUE: gummy shark (Tasmania), SESSF
(c)
1.2
Tasmania scenario 1
Limit reference point
1
Target reference point
Relative pup production
0.8
0.6
0.4
0.2
0
1932 1944 1956 1968 1980 1992 2004 2016
Source: Punt, Thomson & Sporcic 2016
254 ABARES
Fishery status reports 2019Chapter 12: Shark Gillnet and Shark Hook sectors
Stock status determination
The 2016 stock assessment estimated pup production in the most recent year (2015)
to be above the target for each of the three populations modelled. As a result, gummy
shark in the SGSHS is classified as not overfished. Given that recent catches in
2018–19 totalling 1,901 t (Commonwealth 1,682 t, discards 86 t and state weighted
average 133 t) were less than the RBC of 1,961 t, the current fishing mortality
is unlikely to deplete the population below the limit biomass reference point.
Therefore, the stock is classified as not subject to overfishing.
Sawshark (Pristiophorus cirratus, P. nudipinnis)
Line drawing: FAO
Stock structure
Three species of sawshark (common sawshark—Pristiophorus cirratus, southern
sawshark—P. nudipinnis and eastern sawshark—P. peroniensis) are caught in southern
Australian waters. Little is known about the stock structure or movements of
sawshark. Two species dominate reported sawshark catches in this sector: common
sawshark and southern sawshark. For assessment purposes, all sawsharks found
south of the Victoria – New South Wales border are assumed to be common or
southern sawshark, and those found north of that border are assumed to be eastern
sawshark (AFMA 2014e). Around 90% of the total sawshark catch from southern
Australia is taken from Bass Strait (AFMA 2011a). All sawshark catch in the SESSF is
managed under a single TAC, and status is reported for a single multispecies stock.
Catch history
Catch of sawshark in the SGSHS increased in the early 1970s to around 200 t by
1974, and then fluctuated between about 170 and 350 t per year until the early
2000s. Combined catch in the SGSHS and the CTS in 2018–19 was 179 t (Figure 12.7;
Table 12.2), which is approximately 8% of the total catch across the four stocks
assessed in this chapter. The level of discarding in the SGSHS is uncertain. Burch et al.
(2018) used ISMP data to estimate a discard rate of 15.5% for sawshark in 2014.
Data are not available to update this rate. Castillo-Jordán et al. (2018) report state
catch for sawshark from New South Wales, South Australia, Tasmania, Victoria
and Western Australia. Estimated total catch of sawshark from all states during
2013–2017 averaged around 17.1 t (around 11.7 t if Western Australia is excluded).
State recreational catches are unknown but considered low (Woodhams et al. 2018c).
ABARES 255
Fishery status reports 2019Chapter 12: Shark Gillnet and Shark Hook sectors
FIGURE 12.7 Sawshark catch and TAC in the SGSHS, 1970–2018
Figure 12.7 Catch: sawshark, GS & ShHS
600
Discards
Catch
500
Actual TAC
Catch and TAC (tonnes)
400
300
200
100
0
1970 1978 1986 1994 2002 2010 2018
Notes: TAC Total allowable catch. Actual TAC includes carryover of undercatch or overcatch from the previous
season. Discard data are only available by calendar year and for 2007–2015.
Source: Haddon & Sporcic 2018; AFMA catch disposal records (2016–2018 catch data)
Stock assessment
Sawshark has been managed as a tier 4 stock under the SESSF harvest strategy
framework since 2009. Potential avoidance of this species by operators using gillnets
suggests that the corresponding standardised CPUE may not adequately reflect stock
abundance. As a result, SharkRAG recommended using standardised trawl CPUE as
an index of abundance (AFMA 2015c) for applying the tier 4 harvest control rule.
The most recent CPUE analyses of sawshark (three alternative CPUE series were
constructed), using SESSF trawl data to 2017, indicated that current CPUE was above
the target reference point (Sporcic & Haddon 2018) (see Figure 12.8). The adopted
tier 4 analyses in 2017 produced an RBC of 519 t, which was converted to the first
year of a three-year TAC of 430 t for the 2018–19 fishing season.
In 2014, SharkRAG recommended a decrease in the biomass target (BTARG) from 48%
to 40% of unfished biomass. Since sawshark is currently a byproduct species in
the gillnet sector, SharkRAG noted that commercial catch largely depends on effort
targeted at gummy shark (AFMA 2014c).
256 ABARES
Fishery status reports 2019Chapter 12: Shark Gillnet and Shark Hook sectors
FIGURE 12.8 Standardised CPUE index for sawshark in the CTS, 1995–2016 (trawl)
Figure 12.8 CPUE: sawshark (trawl), SESSF
1.4
CPUE
1.2 Recent average CPUE
Limit reference point
Target reference point
1
Standardised CPUE
0.8
0.6
0.4
0.2
0
1995 1998 2001 2004 2007 2010 2013 2016
Note: CPUE Catch-per-unit-effort.
Source: Haddon & Sporcic 2018
Stock status determination
The average recent CPUE for sawshark was estimated to be above the target reference
point (Figure 12.8). On this basis, the stock is assessed as not overfished.
Given that recent catches in 2018–19 totalled 191 t (Commonwealth 179 t, and
state weighted average 12 t), which is less than the RBC of 519 t, the current fishing
mortality is unlikely to deplete the population below the limit reference point. On this
basis, the stock is assessed as not subject to overfishing.
School shark (Galeorhinus galeus)
Line drawing: Karina Hansen
Stock structure
School shark has a broad distribution throughout temperate waters of the eastern
North Atlantic, western South Atlantic, and north-eastern and south-eastern Pacific
oceans; and temperate waters off South Africa, New Zealand and southern Australia.
There is some uncertainty about the stock structure for school shark; however, a
recent genetic study found there is likely to be one genetic stock spread between
Australia and New Zealand (Hernández et al. 2015). School shark is managed as a
single stock in the SESSF.
ABARES 257
Fishery status reports 2019Chapter 12: Shark Gillnet and Shark Hook sectors
Catch history
Catch of school shark in the SGSHS peaked at more than 2,500 t in 1970 and then
declined rapidly to around 500 t in 1973. Catch in the sector again increased to
around 2,000 t in 1986, before declining steadily through the late 1980s and 1990s,
stabilising at around 200 t per year from 2000 onwards (Figure 12.9). In 2009, the
species was listed as conservation-dependent under the Environment Protection and
Biodiversity Conservation Act 1999 (EPBC Act) and has been subject to other measures
to reduce catch. These include the implementation of a catch ratio of 20% school shark
to gummy shark—whereby a quota holder must hold five times more gummy shark
quota than their school shark catch (2011–12 season)—and the requirement that all
live-caught school shark be released (2014–15 season).
The reported landed catch in the SGSHS in 2018–19 was 196 t, which is approximately
9% of the total catch across the four stocks assessed in this chapter. The level of
discarding in the SGSHS is uncertain. Burch et al. (2018) used ISMP data to estimate
a discard rate of 15.1% for school shark in 2014. New ISMP data are not available to
update this number.
Applying the 2014 discard rate to the Commonwealth commercial catch of 196 t
results in an estimated 29.6 t of additional school shark catch by the commercial
fishery in 2018–19, assuming 100% mortality. We do not know what the level of
post-release survival for these discarded sharks is, but it is unlikely to be zero,
making the assumption of 100% mortality conservative.
Walker et al. (2008) used tag–recapture data to estimate a mortality rate of 44% for
school shark taken using gillnets. Braccini, Walker and Gason (2009) report a similar
rate (41%) in their study of gillnet-caught school shark. We do not have a comparable
number for line-caught school shark. Rogers et al. (2017) examined survival of
relatively large discarded female school shark from line fishing using satellite popup
tags. The authors indicate that their results are skewed towards healthy/lively
individuals and that survival of injured individuals remains a gap in knowledge.
Further, the study did not use fishing methods (or gear) completely consistent with
that used by the commercial fleet, which will further distance the results from what
we can expect to occur in the commercial fishery. That said, all sharks tagged in the
study (10 animals) survived for at least five days post-release (longest time frame
recorded is 44 days). We do not have a survival rate for discarded sharks from the
trawl fleet, but it is reasonable to assume that survivability of discarded trawl-caught
school shark would be low because of the restricted movement of catch within the
nets (particularly the codend) and the crushing that can occur in trawl nets.
An estimate of state catch for the 2018–19 fishing season is not available.
However, Castillo-Jordán et al. (2018) report state catches up to and including 2017.
The state catches they report (excluding Western Australia) show relative stability
over the past five years. Pending evidence of any significant changes in activity in
state fisheries, catch in 2018–19 is likely to be at similar levels to that reported for the
previous five years for each state. The average during 2013–2017 was approximately
23 t across South Australia, Victoria, Tasmania and New South Wales. The discard
rate (or post-release survival) for state catches is unknown. State recreational
catches are also not available, except for estimates of 9 t in 2008 and 53 t in 2014
from South Australia (Castillo-Jordán et al. 2018). Total mortality in state fisheries is
uncertain as a result.
258 ABARES
Fishery status reports 2019Chapter 12: Shark Gillnet and Shark Hook sectors
FIGURE 12.9 Annual school shark catch and fishing season TAC in the SGSHS,
1970–2018
Figure 12.9 Catch: school shark, GS & ShHS
3,000
Discards
Catch
2,500
Actual TAC
Catch and TAC (tonnes)
2,000
1,500
1,000
500
0
1970 1978 1986 1994 2002 2010 2018
Notes: TAC Total allowable catch. Actual TAC includes carryover of undercatch or overcatch from the previous
season. Discard data are only available by calendar year and for 2007–2015.
Source: Thomson 2012; AFMA catch disposal records
Stock assessment
Assessments for school shark indicate that the stock has been overfished since
approximately 1990, and the stock has been classified as such since ABARES began
status reporting in 1992. In 2018, a close kin mark–recapture study and a new
population dynamics model (termed a ‘close-kin model’ [CKM]) provided an estimate
of current absolute abundance and recent population trend (2000–2017) from a
single region and population (that is, assuming one mixed stock) (AFMA 2018b).
In contrast to previous assessments, the CKM does not provide an estimate of
population depletion for unfished biomass levels.
The abundance of school shark (in numbers) estimated by the CKM (c. 80,000 adults)
was lower than the previous assessment model projections undertaken in 2012
(c. 200,000 adults; Thomson 2012). However, the 2012 estimate was not as robust
as the new estimate derived from the CKM model (because absolute biomass was
confounded with productivity in the 2012 model). Although there were indications
in the CKM that some stock recovery occurred during 2000–2017, there was large
uncertainty associated with this trend (AFMA 2018a). It was noted that continued
close-kin sampling and analysis will increase confidence in the trend in abundance
in the future.
Catch and abundance projections were based on four constant exploitation rate
scenarios (zero, the 2017 and 2016 rates, and the 2013–2017 mean exploitation rate).
These calculations used the deterministic projection (that is, the median), rather than
a more conservative approach such as choosing a lower confidence limit from a set of
stochastic projections.
ABARES 259
Fishery status reports 2019Chapter 12: Shark Gillnet and Shark Hook sectors
SharkRAG recommended using the 2013–2017 mean exploitation rate to set an
incidental catch TAC for the next three years based on the projections. This rate
provided total fishing mortality estimates of 256 t in 2019–20, 263 t in 2020–21 and
270 t in 2021–22. The 2013–2017 fishing mortality rate provided for a consistent
recovery, as opposed to the 2017 fishing mortality rate, which would lead to an initial
reduction in stock size (for the first two years) before recovery (AFMA 2018c).
It is important to note that the CKM model only considers 2000–2017, since this was
the period over which the animals sampled would have been born. It was unable
to account for historical high catches before 2000. Similar difficulty hampered the
previous assessment model, which used complex stock structure assumptions to
reconcile observed CPUE time series with large historical catches (Punt & Pribac
2001). From a management perspective, this creates considerable uncertainty
because (a) the adult abundance estimate from the CKM cannot be directly compared
with the previous 2012 stock assessment estimate (AFMA 2018b), and (b) we may
be unable to determine an estimate of unfished biomass or initial abundance for
school shark, making it impossible to estimate biomass or population size relative
to an unfished state, as required under the School Shark Rebuilding Strategy
(AFMA 2015b). From a stock perspective, this could mean that (a) the population
sampled from the CKM may not be the same stock that supported catches before
2000 and could be a smaller subset (or stock) of a multistock population that was
fished historically (AFMA 2018c), or (b) the school shark population could have
been subject to a productivity shift (similar to jackass morwong) (AFMA 2018c).
If true, either would have ramifications for the appropriateness of current reference
points under the current harvest strategy framework (AFMA 2014a). This remains a
significant area of uncertainty for assessing the school shark stock, and there may be
other untested explanations for the inability of the CKM model to account for catches
before 2000.
In December 2018, SharkRAG supported continued close-kin sampling (for three
years) and use of the CKM for estimating abundance of school shark, while also
discussing the utility and complexity of updating the old school shark assessment
with addition of the recent CKM work. At this time, SharkRAG also discussed the need
for updating the School Shark Rebuilding Strategy (AFMA 2015b) in light of the latest
information provided by the CKM work.
Stock status determination
Since the CKM does not provide an estimate of population depletion compared with
historical unfished levels, biomass status in 2018–19 is determined based on the
most recent estimate of population depletion. The last full stock assessment in 2009
(Thomson & Punt 2009), which used data up to 2008, estimated the biomass at
0.12B0 . Projections of this model in 2012 indicated that recovery to 0.2B0 would take
23 years under a zero-catch scenario (Thomson 2012). Landings have not been zero
in the intervening period, averaging 192 t in the SGSHS over the last five years. On this
basis, the stock remains classified as overfished.
260 ABARES
Fishery status reports 2019Chapter 12: Shark Gillnet and Shark Hook sectors
Combining commercial catch, discards (assuming 100% mortality) and state catches
provides an estimated total mortality for the stock in 2018–19 of around 248 t. If we
assume some level of survivability in discarded sharks in the SGSHS (40% for line
and gillnet, and 100% for trawl), the estimated total mortality for the stock is around
233 t. Under both scenarios, total mortality is above the incidental catch allowance
(215 t) and above the maximum level (225 t) reported to allow recovery in the time
frame specified in the rebuilding strategy, noting that discards from state fisheries
are unknown. However, this level of catch is below the highest level (250 t) forecast to
allow for recovery in the 2012 modelling (assuming gear selectivity, and spatial and
temporal distribution of catches remain similar to those in 2011). This level of catch is
also less than the total fishing mortality estimate of 256 t generated from the CKM for
2019–20, which allowed for a consistent recovery in stock size.
It is important to note that the discard rate and the mortality of those discards have
been key uncertainties in the calculation of total mortality for this stock, and should
be addressed as a priority.
Other indications that the school shark stock may have stabilised and may even
be recovering include an increasing preliminary index of school shark abundance
based on trawl CPUE (Sporcic 2016), surveys by the Institute for Marine and
Antarctic Studies showing higher numbers of pups from school shark pupping
areas off Tasmania (McAllister et al. 2015) and anecdotal reports from industry.
Furthermore, the CKM suggested that some stock recovery occurred between 2000
and 2017, although there was large uncertainty associated with this trend. Given
the above information, the level of school shark fishing mortality in 2018–19 is
classified as uncertain.
Hauling the gear
Gavin Kewana, AFMA
ABARES 261
Fishery status reports 2019Chapter 12: Shark Gillnet and Shark Hook sectors
12.3 Economic status
Key economic trends
The real gross value of production (GVP) in the SGSHS for the four shark species taken
in the GHTS declined from a peak of $27.2 million in 2008–09 to $16.61 million in
2013–14 and then recovered to $19.5 million by 2017–18 (Figure 12.10). This recent
recovery is primarily the result of higher volumes of gummy shark landings.
Gummy shark accounts for the majority of GVP in the SGSHS (88% in 2017–18).
FIGURE 12.10 Real GVP for the SGSHS, by key species, and real price for gummy
shark, 2007–08 to 2017–18
Figure 12.10 GVP: shark species, GS & ShHS
30 10
Elephantfish
Real price per kg (2017−18 A$)
24 8 School shark
GVP (2017−18 A$ million)
Sawshark
18 6 Gummy shark
Gummy shark
price
12 4
6 2
0 0
2007−08 2009−10 2011−12 2013−14 2015−16 2017−18
Note: GVP Gross value of production.
The four shark species that make up the SGSHS—gummy shark, school shark,
sawshark and elephantfish—accounted for around 71% of the GHTS GVP in the
decade to 2017–18, with scalefish species making up the remainder. Therefore,
overall economic performance in the GHTS may contribute to an understanding of
the economic status of the SGSHS.
Survey-based estimates of revenue, costs and net economic returns (NER) in the
GHTS are available for 2016–17, and preliminary estimates are available for 2017–18
(Figures 12.11 and 12.12). In 2017–18, non–survey based estimates indicate that
NER became negative, −$0.18 million, potentially a result of lower catch volume of
gummy shark and higher unit fuel prices. This reverses a trend of recovery in NER
that started in 2013–14. Estimates for 2015–16 and 2016–17 indicate that NER
were positive in those years due to higher unit prices (increasing fishing income)
and lower fuel prices (causing operating costs to decline). NER increased further
in 2016–17, driven by the highest catch and GVP levels in the fishery since 2010–11
(Mobsby forthcoming). NER reached a low of −$7.93 million in 2013–14 and remained
negative in 2014–15. NER were positive between 2003–04 and 2008–09, peaking at
$7.25 million in 2008–09.
262 ABARES
Fishery status reports 2019Chapter 12: Shark Gillnet and Shark Hook sectors
FIGURE 12.11 Real revenue and costs for the GHTS, 2007–08 to 2017–18
Figure 12.11 Net economic returns, GN & ShHS
35
Revenue
30 Costs
25
2017−18 A$ million
20
15
10
5
0
2007−08 2009−10 2011−12 2013−14 2015−16 2017−18p
Note: Data for 2017–18 are preliminary.
Source: Mobsby forthcoming
FIGURE 12.12 Real NER for the GHTS, 2007–08 to 2017–18
Figure 12.12 Net economic returns, GN & ShHS
8
6
NER (2017−18 A$ million)
4
2
0
−2
−4
−6
−8
2007−08 2009−10 2011−12 2013−14 2015−16 2017−18p
Notes: NER Net economic returns. NER estimates for 2017–18 are preliminary non–survey based estimates.
Source: Mobsby forthcoming
A profit decomposition of the gillnet sector of the GHTS (Skirtun & Vieira 2012)
showed that the key driver of profitability in the sector from 2006–07 to 2008–09
was productivity growth. This was linked to the Securing our Fishing Future
structural adjustment package (completed in 2006–07), which is considered
to have removed the least efficient vessels from the sector (Vieira et al. 2010).
The decline in NER in recent years can be partly linked to falls in the price of fish in
the fishery, making the role of productivity in driving NER improvement less clear.
Productivity followed an increasing trend between 2009–10 and 2013–14, and may
have provided some support to a declining trend in NER (Mobsby forthcoming).
Productivity was more variable from 2014–15 to 2016–17, and coincided with a
period of improvement in NER for the fishery, indicating that fisher terms of trade
may have been a more important factor driving NER improvement in this period
(Mobsby forthcoming).
ABARES 263
Fishery status reports 2019Chapter 12: Shark Gillnet and Shark Hook sectors
Management arrangements
Significant spatial closures have been implemented in recent years to reduce the
catch of protected species, primarily off the South Australian coast (see Chapter 8).
This started with voluntary closures in 2009–10, followed by mandatory closures
in 2010–11. As a result, fishing intensity relocated to other areas. Particularly
affected were operators who had the full extent of their usual fishing grounds closed,
and those who had to switch to use of hooks rather than gillnets in areas where
gillnet closures are in place. Some South Australian gillnet fishers also operate in
the South Australian Rock Lobster Fishery, which is considered to be profitable
(Econsearch 2014) and could have supported some SGSHS operators affected by the
closures. These changes would have reduced the profitability of gillnet operations in
South Australia, contributing to the negative NER in the GHTS following the closures.
South Australian gillnet operators (subject to specific qualification criteria) can use
hook methods in areas where gillnetting is prohibited (or restricted), so that they
can continue to operate. However, anecdotal reports from industry suggest that
their vessel-level economic efficiency is lower using these methods (AFMA 2011b).
Anecdotal information also indicates that allowing gillnet permit holders to use hooks
has had a negative impact on the value of hook permits in the sector, because rights
provided by hook permits have become less exclusive.
School shark biomass remains below the limit reference point, and stock rebuilding
measures are likely to be affecting sector profitability. These measures include low
incidental catch allowances and the prohibition of targeted fishing. School shark is
often caught incidentally with gummy shark—the main target species of the sector—
and actively avoiding school shark can involve an increase in trip length, increasing
the cost of catching gummy shark. Additionally, given the relatively high beach prices
of school shark, changes in its catch allowance can have a relatively large influence
on the revenue of the sector. Operators who do not hold quota for school shark, or
actively avoid it when targeting gummy shark, are forfeiting a potential means of
profit. The substantial time projected for rebuilding of the school shark stock means
that it may be some time before these issues are resolved.
Preliminary results from trials to test the efficiency of longer gillnets (4,200–6,000 m)
were considered inconclusive by SharkRAG in January 2016 (AFMA 2016). However,
giving fishers the option to use longer nets provides them with greater flexibility to
operate under individual transferable quotas, potentially improving efficiency and
NER. In 2017, AFMA removed net length restrictions in Commonwealth waters for
vessels with e-monitoring.
Performance against economic objective
A comparison of the biomass levels of key species with harvest strategy targets
gives additional information on the economic status of the SGSHS. Gummy shark
is the primary driver of economic performance in the SGSHS, accounting for 88%
of SGSHS GVP in 2017–18. The target reference point for gummy shark is the BMEY
(biomass that corresponds to maximum economic yield) proxy of 0.48P0 (48% of
virgin pup production). The results of the 2016 stock assessment indicate that the
biomass of gummy shark stocks is likely to be above the target reference point. If the
proxy accurately reflects BMEY for this species, the results indicate that biomass
is not currently constraining NER and that there may be potential for expansion
in the sector.
264 ABARES
Fishery status reports 2019Chapter 12: Shark Gillnet and Shark Hook sectors
School shark is the second most valuable species in the sector, accounting for 10%
of SGSHS GVP in 2017–18, despite being caught under an incidental catch allowance.
The school shark to gummy shark quota restriction implemented in 2011–12
may have reduced gummy shark catch and therefore current GVP (AFMA 2014d).
Efforts to rebuild the school shark stock towards target levels should lead to increases
in NER.
The challenge of reducing marine mammal interactions may affect the degree to
which economic performance can be improved in the short term. Recent closures to
mitigate interactions are likely to have contributed to the observed negative NER for
the GHTS from 2009–10 to 2014–15, and may be related to increased gummy shark
quota latency during this period. In 2015–16 to 2016–17, NER were positive and
linked to productivity growth, indicating that the industry is actively adjusting to
new operating conditions.
12.4 Environmental status
The SESSF was accredited against parts 13 and 13A of the EPBC Act in February
2016. Conditions associated with the accreditation relate to the impact of fishing
on bycatch species, particularly Australian sea lions (Neophoca cinerea), dolphins,
seals and seabirds. Further recommendations associated with the accreditation
relate to requirements for ecological risk assessment, and monitoring of bycatch
and discarding.
A level 2 ecological risk assessment of 329 species resulted in 21 assessed as being
at high risk (16 chondrichthyans and 5 marine mammals; Walker et al. 2007).
A level 3 Sustainability Assessment of Fishing Effects assessment was completed
for all 195 chondrichthyan and teleost species identified in the shark gillnet
fishery, regardless of their level 2 Productivity Susceptibility Analysis (PSA) risk
score. The assessment found seven species (all chondrichthyan) to be at high risk
(Zhou, Fuller & Daley 2012). One species (common sawshark) was removed during
the residual risk analysis (AFMA 2014b). The remaining six species considered to
be at high risk are all sharks: bronze whaler, white shark (Carcharodon carcharias),
whiskery shark, smooth hammerhead shark (Sphyrna zygaena), school shark
and broadnose sevengill shark. A 2010 residual risk assessment of PSA results
for non-teleost and non-chondrichthyan species identified five marine mammal
species as high risk (AFMA 2010). A subsequent residual risk analysis removed two
species (as a result of no interactions being recorded in the fishery) and included
one further species (as a result of higher than expected interactions), resulting in
four marine mammal species considered to be at high risk in the fishery: Australian
fur seal (Arctocephalus pusillus doriferus), Australian sea lion, New Zealand fur seal
(A. forsteri) and common dolphin (Delphinus delphis) (AFMA 2012). The results of
the ecological risk assessments have been consolidated to form a priority list in an
ecological risk assessment strategy for the SESSF (AFMA 2015a). Results from a
revised ecological risk assessment of 233 species across three ecological components
in 2018 for the SGSHS are still to be finalised.
ABARES 265
Fishery status reports 2019Chapter 12: Shark Gillnet and Shark Hook sectors
AFMA publishes quarterly logbook reports of interactions with protected species on
its website. Reports for the GHTS in the 2018 calendar year indicate 418 interactions:
113 with mammals, 111 with seabirds, 183 with sharks, 10 with little penguins—
Eudyptula minor (1 alive; 9 dead) and 1 with a leatherback turtle—Dermochelys
coriacea (alive). The mammal interactions comprised 56 interactions with dolphins
(all dead), 19 with Australian fur seals (1 alive; 18 dead), 2 with sea lions (1 alive;
1 dead), 6 with New Zealand fur seals (all dead) and 30 with seals (unclassified;
3 alive; 26 dead; 1 unknown). In 2018, 120 seabirds (29 alive; 91 dead) were caught,
including albatrosses, cormorants, petrels, prions and shearwaters.
Logbooks reported that 129 shortfin mako sharks—Isurus oxyrinchus (9 alive; 92
dead; 28 in unknown condition), 5 longfin mako sharks—I. paucus (3 alive; 2 dead),
27 porbeagle sharks—Lamna nasus (7 alive, 20 dead), 2 grey nurse sharks—
Carcharias taurus (2 in unknown condition) and 20 white sharks (15 alive; 5 dead)
were caught during 2018. Measures to reduce interactions with Australian sea lions
and dolphins are discussed in Chapter 8.
12.5 References
AFMA 2010, Residual risk assessment of the level 2 ecological risk assessment species
results: report for the gillnet sector of the Gillnet, Hook and Trap Fishery, Australian
Fisheries Management Authority, Canberra.
—— 2011a, SharkRAG species summaries 2010, AFMA, Canberra.
—— 2011b, ‘South East Management Advisory Committee (SEMAC), chair’s
summary, meeting 7, 19 September 2011’, AFMA, Canberra.
—— 2012, Residual risk assessment of the level 2 productivity susceptibility assessment:
report for the shark gillnet method of the Gillnet, Hook and Trap sector, AFMA, Canberra.
—— 2014a, Harvest strategy framework for the Southern and Eastern Scalefish and
Shark Fishery, 2009 amended (February 2014), AFMA, Canberra.
—— 2014b, Residual risk assessment: report for the shark gillnet method of the Gillnet,
Hook and Trap sector, AFMA, Canberra.
—— 2014c, ‘Shark Resource Assessment Group (SharkRAG), meeting record,
15–16 October 2014’, AFMA, Canberra.
—— 2014d, Southern and Eastern Scalefish and Shark Fishery management
arrangements booklet 2014, AFMA, Canberra.
—— 2014e, Species summaries for the Southern and Eastern Scalefish and Shark
Fishery: for stock assessments completed in 2013 in preparation for the 2014–15 fishing
season, AFMA, Canberra.
—— 2015a, Ecological risk management: strategy for the Southern and Eastern
Scalefish and Shark Fishery, AFMA, Canberra.
—— 2015b, School shark Galeorhinus galeus stock rebuilding strategy: revised 2015,
AFMA, Canberra.
—— 2015c, ‘Shark Resource Assessment Group (SharkRAG), meeting minutes,
8 October 2015’, AFMA, Canberra.
266 ABARES
Fishery status reports 2019Chapter 12: Shark Gillnet and Shark Hook sectors
—— 2016, ‘Shark Resource Assessment Group (SharkRAG) out of session
teleconference, meeting minutes, 28 January 2016’, AFMA, Canberra.
—— 2018a, ‘Southern and Eastern Scalefish and Shark Fishery Shark Resource
Assessment Group (SharkRAG), meeting minutes, 29–30 October 2018’, AFMA,
Canberra.
—— 2018b, ‘Southern and Eastern Scalefish and Shark Fishery Shark Resource
Assessment Group (SharkRAG), meeting minutes, 6–7 August 2018’, AFMA, Canberra.
—— 2018c, ‘Southern and Eastern Scalefish and Shark Fishery Shark Resource
Assessment Group (SharkRAG), meeting minutes, 3–4 December 2018’, AFMA,
Canberra.
—— 2019, Total allowable catch recommendations for the Southern and Eastern
Scalefish and Shark Fishery 2019–20 fishing year: paper seeking South East Management
Advisory Committee total allowable catch recommendations, AFMA, Canberra.
Braccini, M & Blay, N 2019, ‘Temperate demersal gillnet and demersal longline
fisheries resource status report 2018’, in DJ Gaughan & K Santoro (eds), Status reports
of the fisheries and aquatic resources of Western Australia 2017/2018, Department of
Primary Industries and Regional Development, Western Australia.
——, Walker, TI & Gason, AD 2009, GHATF shark survey of population abundance and
population size composition for target, byproduct and bycatch species, final report
to AFMA, project R2006/823, Fisheries Research Branch, Department of Primary
Industries, Queenscliff.
Burch, P, Deng, R, Thomson, R & Castillo-Jordán, C 2018, Integrated Scientific
Monitoring Program for the Southern and Eastern Scalefish and Shark Fishery: discards
for 2017, final report to AFMA, 18 December 2018, CSIRO Oceans and Atmosphere,
Hobart.
Castillo-Jordán, C, Althaus, F, Burch, P & Thomson, R 2018, SESSF catches and
discards for TAC purposes using data until 2017, report to AFMA, CSIRO Oceans and
Atmosphere, Hobart.
Conron, S, Hamer, P & Jenkins, G 2016, Western Port fishery assessment 2015,
Recreational Fishing Grants Program research report, Fisheries Victoria,
Department of Economic Development, Jobs, Transport and Resources, Victoria.
Econsearch 2014, Economic indicators for the SA Southern Zone Rock Lobster Fishery
2012/13, report prepared for Primary Industries and Resources South Australia,
Econsearch, Adelaide.
Haddon, M & Sporcic, M 2018, ‘Draft tier 4 assessments for selected SESSF shark
species (data to 2016)’, draft, CSIRO Oceans and Atmosphere, Hobart.
Hernández S, Daley, R, Walker, T, Braccini, M, Varela, A, Francis, MP & Ritchie, PA
2015, ‘Demographic history and the South Pacific dispersal barrier for school shark
(Galeorhinus galeus) inferred by mitochondrial DNA and microsatellite DNA mark’,
Fisheries Research, vol. 167, pp. 132–42.
McAllister, JD, Barnett, A, Lyle, JM & Semmens, JM 2015, ‘Examining the functional
role of current area closures used for the conservation of an overexploited and highly
mobile fishery species’, ICES Journal of Marine Science, vol. 72, no. 8, pp. 2234–44.
ABARES 267
Fishery status reports 2019Chapter 12: Shark Gillnet and Shark Hook sectors
Mobsby, D forthcoming, Australian fisheries economic indicators report 2018: financial
and economic performance of the Southern and Eastern Scalefish and Shark Fishery,
ABARES, Canberra.
Punt, A, & Pribac, F 2001, An assessment of school shark for 2001, SharkFAG document
SharkFAG/01/D03, AFMA, Canberra.
——, Thomson, R & Sporcic, M 2016, Gummy shark assessment update for 2016, using
data to the end of 2015, report presented to the SharkRAG meeting, CSIRO Marine and
Atmospheric Research, Hobart.
Rogers, PJ, Knuckey, I, Hudson, RJ, Lowther, AD & Guida, L 2017, ‘Post-release survival,
movement, and habitat use of school shark Galeorhinus galeus in the Great Australian
Bight, southern Australia’, Fisheries Research, vol. 187, pp. 188–98.
Skirtun, M & Vieira, S 2012, Understanding the drivers of profitability in Commonwealth
fisheries, ABARES technical report 12.4, ABARES, Canberra.
Sporcic, M 2016, CPUE standardizations for selected shark SESSF species (data to 2015):
draft, SharkRAG meeting 1, 13–14 October 2016, CSIRO Marine and Atmospheric
Research, Hobart.
—— & Haddon, M 2018, Statistical CPUE standardizations for shark species in the
SESSF: (data to 2017), SharkRAG meeting 4, 3–4 December 2018, CSIRO Marine and
Atmospheric Research, Hobart.
Sporcic, M & Thomson, R 2015, Tier 4 analyses for elephnt fish and sawshark in the
SESSF: (data to 2014), CSIRO Marine and Atmospheric Research, Hobart.
Thomson, R 2012, Projecting the school shark model into the future: rebuilding
timeframes and auto-longlining in South Australia, CSIRO Marine and Atmospheric
Research, Hobart.
—— & Punt, AE 2009, Stock assessment update for school shark Galeorhinus galeus
based on data to 2008, report presented to the SharkRAG meeting, 17–18 November,
CSIRO Marine and Atmospheric Research, Hobart.
—— & Sporcic, M 2014, Gummy shark assessment update for 2013, using data to the end
of 2012 (draft), report presented to the SharkRAG meeting, 11–12 December 2013,
CSIRO Marine and Atmospheric Research, Hobart.
Vieira, S, Perks, C, Mazur, K, Curtotti, R & Li, M 2010, Impact of the structural
adjustment package on the profitability of Commonwealth fisheries, Australian Bureau
of Agricultural and Resource Economics research report 10.01, ABARE, Canberra.
Walker, T, Stone, T, Battaglene, T & McLoughlin, K 1994, The southern shark
fishery 1994, fisheries assessment report compiled by the Southern Shark Fishery
Assessment Group, AFMA, Canberra.
268 ABARES
Fishery status reports 2019Chapter 12: Shark Gillnet and Shark Hook sectors
——, Dowdney, J, Williams, A, Fuller, M, Webb, H, Bulman, C, Sporcic, M & Wayte, S
2007, Ecological risk assessment for the effects of fishing: report for the shark gillnet
component of the Gillnet, Hook and Trap Sector of the Southern and Eastern Scalefish and
Shark Fishery, report to AFMA, Canberra.
——, Taylor, B, Brown, L & Punt A 2008, ‘Embracing movement and stock structure
for assessment of Galeorhinus galeus harvested off southern Australia’, in MD Camhi,
EK Pikitch & EA Babcock (eds), Sharks of the open ocean: biology fisheries and
conservation, Blackwell Publishing, Oxford, pp. 369–92.
White, WT & Last, PR 2008, ‘Description of two new species of gummy sharks,
genus Mustelus (Carcharhiniformes: Triakidae), from Australian waters’, in PR Last,
WT White & JJ Pogonoski (eds), Descriptions of new Australian chondricthyans,
CSIRO Marine and Atmospheric Research paper 22, CSIRO Marine and Atmospheric
Research, Canberra.
Woodhams, J, Conron, S, Moore, B & Peddemors, V 2018a, ‘Elephantfish
(Callorhinchus milii)’, in FRDC (eds), Status of Australian fish stocks 2018, FRDC,
Canberra, www.fish.gov.au/report/185-Elephantfish-2018, accessed August 2019.
——, Green, C, Lyle, J, Braccini, M, Rogers, P & Peddemors, V 2018b, ‘Gummy shark
(Mustelus antarcticus)’, in FRDC (eds), Status of Australian fish stocks 2018, FRDC,
Canberra, www.fish.gov.au/report/181-Gummy-Shark-2018, accessed August 2019.
——, Braccini, M, Moore, B, Rogers, P & Peddemors, V 2018c, ‘Sawsharks
(Pristiophorus spp.)’, in FRDC (eds), Status of Australian fish stocks 2018, FRDC,
Canberra, www.fish.gov.au/report/157-SAWSHARKS-2018, accessed August 2019.
Zhou, S, Fuller, M & Daley, R 2012, Sustainability assessment of fish species potentially
impacted in the Southern and Eastern Scalefish and Shark Fishery: 2007–2010, CSIRO,
Canberra.
ABARES 269
Fishery status reports 2019You can also read