DENMARK EDUCATION POLICY OUTLOOK - April 2014 - OECD.org
←
→
Page content transcription
If your browser does not render page correctly, please read the page content below
EDUCATION POLICY OUTLOOK
                                                           DENMARK

EDUCATION POLICY OUTLOOK: DENMARK © OECD 2013                         1

                                                               April 2014
EDUCATION POLICY OUTLOOK
This policy profile on education in Denmark is part of the new Education Policy Outlook series,
which will present comparative analysis of education policies and reforms across OECD countries. Building
on the substantial comparative and sectorial policy knowledge base available within the OECD, the series
will result in a biennial publication (first volume in 2014). It will develop a comparative outlook on education
policy by providing: a) analysis of individual countries’ educational context, challenges and policies
(education policy profiles) and of international trends and b) comparative insight on policies and reforms on
selected topics.
Designed for policy makers, analysts and practitioners who seek information and analysis of
education policy taking into account the importance of national context, the country policy profiles will offer
constructive analysis of education policy in a comparative format. Each profile will review the current
context and situation of the country’s education system and examine its challenges and policy responses,
according to six policy levers that support improvement:
Students: How to raise outcomes for all in terms of 1) equity and quality and 2) preparing
students for the future
Institutions: How to raise quality through 3) school improvement and 4) evaluation and
assessment
System: How the system is organised to deliver education policy in terms of 5) governance and
6) funding.
Some country policy profiles will contain spotlight boxes on selected policy issues. They are meant to
draw attention to specific policies that are promising or showing positive results and may be relevant for
other countries.
Special thanks to the Danish Government for their active input during consultations and constructive
feedback on this report.
Authors: This country policy profile was prepared by Beatriz Pont, Diana Toledo Figueroa, Etienne
Albiser, Hyo Jeong Yee, Annette Skalde, Juliana Zapata and Sylvain Fraccola (statistics and design), from
the Education Policy Outlook team, which is part of the Policy Advice and Implementation Division, led by
Richard Yelland. Editorial support was provided by Lynda Hawe and Susan Copeland. This profile builds on
the knowledge and expertise of many project teams across the OECD’s Directorate for Education and
Skills, to whom we are grateful.
Sources: This country profile draws on OECD indicators from the Programme for International
Student Assessment (PISA), the Teaching and Learning International Survey (TALIS), the Survey of Adult
Skills and the annual publication Education at a Glance, and refers to country and thematic studies such as
OECD work on early childhood education and care, teachers, school leadership, evaluation and
assessment for improving school outcomes, equity and quality in education, governing complex education
systems, vocational education and training, and tertiary education.
Most of the figures quoted in the different sections refer to Annex B, which presents a table of the
main indicators for the different sources used throughout the country profile. Hyperlinks to the reference
publications are included throughout the text for ease of reading, and also in the References and further
reading section, which lists both OECD and non-OECD sources.
More information is available from the OECD Directorate for Education and Skills (www.oecd.org/edu)
and its web pages on Education Policy Outlook (www.oecd.org/edu/policyoutlook.htm).
For further information, you are invited to contact the OECD’s Education Policy Outlook Team
(EDUPolicyTeam@oecd.org).
EDUCATION POLICY OUTLOOK: DENMARK © OECD 2013 2
TABLE OF CONTENTS

Highlights ......................................................................................................................................................................... 4
Equity and quality
Education opportunities for all and smooth transitions between levels............................................................................. 6
Preparing students for the future
High enrolment but low completion in vocational education and training ......................................................................... 8
School improvement
Building teacher and school leadership competencies to strengthen schools ................................................................ 10
Evaluation and assessment to improve student outcomes
National evaluation framework still in progress .............................................................................................................. 12
Governance
National strategy and autonomous decision making at local and school level ............................................................... 14
Funding
High public investment at all levels of education ............................................................................................................ 16
Annex A: Structure of Denmark’s education system ...................................................................................................... 18
Annex B: Statistics ......................................................................................................................................................... 19
References and further reading ...................................................................................................................................... 22

Figures

   Figure 1. Performance of adults in literacy, of 15-year-olds in mathematics and impact of ESCS ............................... 5
   Figure 2. Upper secondary and tertiary attainment ...................................................................................................... 5
   Figure 3. Low and top performers and difference between non-immigrant and immigrant students ........................... 7
   Figure 4. Students in education and not in education, by educational attainment and work status .............................. 9
   Figure 5. The learning environment............................................................................................................................ 11
   Figure 6. Student assessment by purpose ................................................................................................................. 13
   Figure 7. Decisions in public lower secondary schools, by level of government ........................................................ 15
   Figure 8. Expenditure on educational institutions as a percentage of GDP ................................................................ 17

Spotlights

   Spotlight 1. Better and more attractive vocationa education and training programmes ............................................... 9
   Spotlight 2. Improving Danish public schools (Folkeskole)......................................................................................... 11
   Spotlight 3. National priorities for education (2011) .................................................................................................... 15

EDUCATION POLICY OUTLOOK: DENMARK © OECD 2013                                                                                                                                   3
HIGHLIGHTS

Denmark’s educational context

      Students: Denmark’s performance on PISA 2012 is higher than average in mathematics and at around the
OECD average in reading and science. PISA results have decreased in mathematics over the years, but
remained unchanged in reading and science. The impact of students’ socio-economic background on
mathematics performance is similar to the OECD average, but immigrant students are at higher risk of poor
performance. The education system has a number of features that promote equity, including a high proportion of
students enrolled in early childhood education, low grade repetition and comprehensive schooling until age 16.
Upper secondary graduation rates are high, as are enrolment rates for vocational education and training (VET),
but dropout from VET is also high. Tertiary education is accessible to all, through policies such as a publicly
funded grant and loan scheme. In the OECD Survey of Adult Skills, adults in Denmark demonstrate below-
average literacy skills and above-average numeracy skills compared to the average across participating countries,
with younger adults scoring around the average. Unemployment rates in Denmark in 2011 were below the OECD
average.
      Institutions: Students and teachers both report positive learning environments. Teachers are trusted
professionals with fewer teaching hours than the OECD average and good salary conditions, but they receive less
feedback and fewer professional development opportunities than the OECD average. At primary and lower
secondary levels, teachers follow a pre-service teacher training programme of four years including a teaching
practicum; at upper secondary level, it is a six-year training programme, also including a teaching practicum.
School principals in Denmark are less active as pedagogical leaders than on average across OECD countries.
There has been progress in recent years to foster a culture of evaluation and assessment, and a national
framework is being developed, guided by national objectives for student achievement. Schools and municipalities
need further support to build their capacity to analyse and use data for improvement.
     System: The Ministry of Education sets national priorities, and most education decisions in primary and
lower secondary schools (Folkeskole) are carried out by the 98 municipalities. Upper secondary schools and post-
secondary educational institutions are self-governing. Denmark invests a substantial amount of public resources
on education and prioritises funding to meet local needs. Spending at all levels of education is above the OECD
average, with a low share of private expenditure on education compared to the OECD average.
Key policy issues
       Denmark’s education performance can be nurtured by setting clear education objectives to guide a
decentralised municipal environment while maintaining equitable practices and supporting performance for low
performers and students with immigrant background. Strengthening the quality of VET to improve completion
rates is also important. Other priorities for Denmark include ensuring that teachers and principals have quality
support, feedback and professional development opportunities and that principals take a more active pedagogical
role. Completing a framework for evaluation and assessment and using the results in schools are also considered
priorities. Building the capacity of municipalities and schools to implement national strategies at the local level and
optimising resources in a decentralised context are key issues.
Recent policy responses
     In 2010, Denmark introduced a mandatory assessment of language development for all three-year-olds to
diagnose possible language problems before children start school.
       Several reforms in process aim to help reduce dropout among VET students, by providing increased
flexibility across the system and upper secondary vocational programmes that allow students to access higher
education. A new policy agreement, Better and more attractive vocational education and training programmes
(VET) (Bedre og mere attraktive erhvervsuddannelser, 2014), aims to provide a more attractive supply of VET
programmes.
     Efforts to improve schools include a major reform of teacher education to develop a bachelor’s programme
based on modules, with greater autonomy for colleges to deliver the programme. In addition, a new reform to be
implemented in 2014 aims to strengthen the performance of Danish schools by modifying the organisation of the
school day, introducing more optional and sports activities and providing more training for teachers and school
leaders.
     To clarify national priorities, in 2011, the government introduced a platform designed to improve educational
outcomes for all Danish students. It sets specific targets for 2020, including achieving upper secondary
completion rates of 95% and tertiary enrolment and completion rates of 60%.

EDUCATION POLICY OUTLOOK: DENMARK © OECD 2013                                                                             4
Denmark achieved above average performance in mathematics in PISA 2012, and the impact of socio-
economic status on attainment (16.5%) is above the OECD average of 14.6% (Figure 1). Reading and science
performance is around the OECD average. Denmark’s performance in reading and science did not change
significantly across years, but mathematics performance decreased between 2003 and 2012. Since 2000, there is
a smaller performance gap between top and low performers compared to most other countries.
Figure 1. Performance of 15-year-olds in mathematics, relationship between student performance and
economic, social and cultural status (ESCS) (PISA 2012) and performance of adults in literacy (PIAAC)
Denmark OECD average Min Max
600 25 295
% of variation explained 285
Score points
550 20
by the ESCS
Score points
275
500 15
265
450 10
255
5 245
400
Overall strength of Mean proficiency
Mean
the relationship in literacy among
performance in
between the ESCS 16-65 year-olds
mathematics
and student
performance
Source: OECD (2014), PISA 2012 Results: What Students Know and Can Do (Volume I, Revised edition, February 2014):
Student Performance in Mathematics, Reading and Science, PISA, OECD Publishing, Paris,
http://dx.doi.org/10.1787/9789264208780-en; OECD (2013), OECD Skills Outlook 2013: First Results from the Survey of Adult
Skills, OECD Publishing, Paris, http://dx.doi.org/10.1787/9789264204256-en.
The proportion of 25-34 year-olds with at least secondary education attainment in Denmark is nearly at
the OECD average (80% compared to the OECD average of 82% in 2011), and tertiary education attainment
reached the OECD average of 39% in 2009 (Figure 2).
Figure 2. Upper secondary and tertiary attainment for 25-34 year-olds, 2011
100
% of attainment (population)
80
60
Denmark
40
OECD average
20
0
At least upper Tertiary education
secondary
Source: OECD (2013), Education at a Glance 2013: OECD Indicators, OECD Publishing, Paris,
http://dx.doi.org/10.1787/eag-2013-en.
EDUCATION POLICY OUTLOOK: DENMARK © OECD 2013 5EQUITY AND QUALITY: EDUCATION OPPORTUNITIES FOR ALL
AND SMOOTH TRANSITIONS BETWEEN LEVELS
Denmark has average indicators in equity. Mathematics performance of 15-year-old students is above the
OECD average in PISA 2012, but has decreased across PISA assessments, while performance in reading and
science has remained unchanged at around the OECD average. There is a smaller-than-average performance
gap between students: the proportions of students performing below proficiency Level 2 (16.8%) and at Level 5 or
above (10%) are both below the OECD average (23% for Level 2 and 12.6% for Level 5 and above) (Figure 3).
The performance gap between boys and girls is slightly larger than the OECD average, with boys scoring 14
points higher than girls in mathematics (compared to the OECD average of 12 points). The impact of students’
socio-economic background on their performance is about average (16.5% compared to the OECD average of
14.8%). Denmark performed around OECD average in problem-solving in PISA 2012. Less 15-year-olds in
Denmark are excellent problem-solvers (8.7%) compared to the OECD average (11.4%).
Fair and inclusive policies in early childhood education and care (ECEC) contribute to a more equitable
education system. Pre-primary education in Denmark includes kindergartens and pre-school classes. Children
have guaranteed access to day care, as local councils must ensure the necessary number of places for children
in their municipality. Almost all 4-year-olds are enrolled in early childhood education (98% in 2011, above the
OECD average of 82%). A one-year pre-school class (for 6-year-olds) aims to ensure a smooth transition from
pre-primary to primary education and prepare children for the educational programme at school.
System-level policies in Denmark promote equity in education. Denmark has comprehensive education
from ages 6-7 until age 16, including one year of pre-school class, nine years of primary and lower secondary
education integrated within a single structure, and a voluntary tenth year. Parents can choose whether their
children receive compulsory education in public primary and lower secondary local schools (Folkeskole), in
private schools, or at home. Most students are enrolled in public schools (in 2011, 86% at the primary level and
73% at lower secondary level). Grade repetition is low, with 4.7% of 15-year-old students repeating at least once,
compared to 12.4% on average in OECD countries in PISA 2012.
Students with an immigrant background in Denmark have lower performance compared to their peers in
other OECD countries, and the mathematics performance gap (after accounting for socio-economic background)
between native students and students with an immigrant background is larger than the OECD average (40 points
compared to the OECD average of 21 points). The proportion of students with an immigrant background (first or
second generation) in Denmark is lower than the OECD average (8.9% compared to 11.2%). Improving their
performance can contribute to raising overall equity and quality of education in Denmark.
The challenge: Continuing to support equitable practices while aiming to raise performance for students
with an immigrant background.
Recent policies and practices
The National Common Objectives for Compulsory Education (2009) define what students are expected to
learn in all subjects and at specific levels throughout their compulsory education.
A mandatory assessment of language development (2010) was introduced for all three-year-olds to
diagnose possible language problems before children start school. If needed, children can receive support
through additional language stimulation in their day-care facility. Children who are not enrolled in an early
childhood education and care programme, but are in need of support can also receive help, and parents are
required by law to accept the offer.
EDUCATION POLICY OUTLOOK: DENMARK © OECD 2013 6Figure 3. Percentage of low and top performers and performance difference between non-immigrant and
immigrant students in mathematics (PISA 2012)
Denmark OECD average Min Max
%
%
40 60 70
60
50 50
30
Score points
40
40 30
20
20 30 10
0
20
-10
10
-20
10
-30
-40
0 0
Difference in mathematics
Top-performing students Low-performing
performance between
(level 5 or above) students (below Level 2)
non-immigrant and
immigrant students
AFTER adjusting for
socio-economic status
Source: OECD (2014), PISA 2012 Results: What Students Know and Can Do (Volume I, Revised edition, February 2014):
Student Performance in Reading, Mathematics and Science, OECD Publishing, Paris,
http://dx.doi.org/10.1787/9789264208780-en.
EDUCATION POLICY OUTLOOK: DENMARK © OECD 2013 7PREPARING STUDENTS FOR THE FUTURE: HIGH ENROLMENT BUT LOW
COMPLETION IN VOCATIONAL EDUCATION AND TRAINING
The capacity of education systems to effectively develop skills and labour market perspectives can play
an important role in the educational decisions of young people. In Denmark, 16-64 year-olds show below-average
literacy skills compared to other countries participating in the Survey of Adult Skills, but above-average numeracy
skills. Younger adults (16-24 year-olds) in Denmark have higher-than-average skills, but lower or similar skills
compared to their peers in other countries. Overall, there is an above-average proportion of workers who are well
matched to their skills levels in relation to their occupation. In Denmark, unemployment rates across all education
levels were below the OECD average in 2011, except for those with tertiary education (5%, slightly above the
OECD average of 4.8%). The share of 15-29 year-olds not in education and not employed (11%) is below the
OECD average of 15.8% (Figure 4), even though it increased in the context of the economic crisis (2008-10).
In Denmark, 80% of 25-34 year-olds have attained at least upper secondary education, compared to the
OECD average of 82% (Figure 2). Most 15-19 year-olds are enrolled in education (87%, above the OECD
average of 85.6%) and 5.5% are neither employed nor in education (compared to the OECD average of 8.3%).
Denmark offers four education programmes at upper secondary level that prepare students for tertiary education.
Two programmes, offered by vocational schools, emphasise technical and commercial vocational preparation,
while the other two, offered by general upper secondary schools, focus on academic options.
Incentives for students to remain in school beyond the end of compulsory education and to graduate from
upper secondary could help reduce the risk of unemployment and other forms of exclusion. More students
combine school with work in Denmark than the OECD average. Similar proportions of students enrol in general
programmes and in vocational education and training programmes (VET), but fewer VET students complete their
studies partly due to difficulties finding a training place in a company. It is important to strengthen the quality of
VET programmes to ensure completion and to improve links to the labour market. VET at upper secondary level
currently combines general and vocational education and training at a vocational college with on-the-job training
(apprenticeship). However, only 52% of VET students in Denmark completed their VET programme in 2012.
Increasing the number of training places, improving quality on-the-job training and promoting the participation of
employers can help ease the transition from school to work.
In Denmark, 39% of 25-34 year-olds have attained tertiary education, as on average across OECD
countries. Tertiary education is free for students and there is a generous student loan system for living expenses.
Higher education lasts for around four years for a professional bachelor’s degree which prepares students for
specific professions, such as nursing, social work or journalism. A longer cycle is provided in universities, which
conduct research and offer research-based education. University graduation rates are higher in Denmark (50%)
than the OECD average (40%). As in other OECD countries, expanding tertiary education implies providing a
sufficiently wide offer of studies to address labour market needs as well as the interests of the student population.
The challenge: Improving quality and completion rates in vocational education and training (VET).
Recent policies and practices
The Danish Parliament passed into law the Reform of the Danish Upper Secondary Academically Orientated
Programes (2003) to enhance the quality of the four general upper secondary education course pathways (Stx,
Hhx, Htx and Hf) and introduce more uniformity between the curricula. The reform restructured upper secondary
academically orientated education into half a year of basic course common to the four pathways, followed by two-
and-a-half years of specialised studies.
A new reform was introduced by the government in 2008-09, to reduce dropout among VET students. The
structure of the system was redefined into 12 main study areas with new plans of action and learning. Under this
new more flexible system, students can choose among programmes with different degrees of work-based
learning and institutions can tailor programmes to students’ individual needs. Since 2010, students can combine a
VET programme with an academic examination at ISCED level 3, to allow VET students to have general access
to educational programmes at tertiary level.
The government has introduced a new policy agreement, Better and more attractive vocational education
and training programmes (Bedre og mere attraktive erhvervsuddannelser, 2014), to reform Danish VET programs
(see Spotlight 1).
Also in 2009, tertiary education was revised to improve standards.
EDUCATION POLICY OUTLOOK: DENMARK © OECD 2013 8Figure 4. Percentage of 15-29 year-olds in education and not in education, by educational attainment and
work status, 2011
In Education In Education and Work Employed NEET
100%
80%
% of 15-29 year-olds
60%
40%
20%
0%
Denmark OECD average Denmark OECD average Denmark OECD average
Below upper secondary Upper secondary and non- Tertiary education
tertiary post-secondary
NEET: Neither Employed, nor in Education and Training
Source: OECD (2013), Education at a Glance 2013: OECD Indicators, OECD Publishing, Paris, http://dx.doi.org/10.1787/eag-
2013-en.
Spotlight 1. Better and more attractive vocational education and training programmes
Launched in 2013, Better and more attractive vocational education and training programmes (Bedre og
mere attraktive erhvervsuddannelser, 2014), is a new policy agreement to reform Danish vocational and training
(VET) programmes, to simplify their structure, provide greater clarity and increase the number of apprenticeships.
It will enter into force in 2015 and aims to improve the quality and attractiveness of VET programmes in Denmark,
with the following objectives to be reached by 2020:
to increase to at least 25% the proportion of young people entering a VET programme directly after
finishing primary and lower secondary education
to increase the share of students completing their VET programme
to provide more professional development to teachers and staff
to offer flexible VET education that caters to students with different levels of abilities
to improve counselling to students before and during VET programmes to ensure successful
transition to the labour market or higher education
to collaborate closely with companies providing training places for apprentices.
EDUCATION POLICY OUTLOOK: DENMARK © OECD 2013 9SCHOOL IMPROVEMENT: BUILDING TEACHER AND SCHOOL
LEADERSHIP COMPETENCIES TO STRENGTHEN SCHOOLS
The key to raising achievement in schools is developing learning environments with the conditions for
school leaders and teachers to succeed. School environments in Denmark are considered positive from various
perspectives. For example, student-teacher relations are especially positive according to both students and
principals (Figure 5). The number of days of instruction in general programmes at primary, lower and upper
secondary level of education is among the highest in OECD countries (200 days compared to the OECD average
of 183-185 days depending on the level of education) and is combined with an above-average number of annual
instruction hours for students in primary and lower secondary.
The role of school leaders has changed over the past decade, with more school autonomy and high
demands for accountability. Nevertheless, according to self-reports in the 2008 OECD Teaching and Learning
International Survey (TALIS), lower secondary school principals in Denmark often lack a clear leadership style.
They are less likely than principals in other countries to use an administrative style of leadership, but are also less
likely to use an instructional style of leadership. Results from the PISA 2012 survey also show that school leaders
are less involved in instructional leadership activities than the average school leader in OECD countries (Figure 5).
To foster student learning, increased autonomy levels need to be supported by capacity-building for better
instructional and administrative leadership.
Teachers are trusted professionals with self-efficacy above the TALIS average, lower-than-average annual
teaching hours (650 compared to the OECD average of 790) and good salary conditions, but less guidance to
help them improve their practice. To become primary and lower secondary teachers in Denmark, candidates must
complete a bachelor’s degree in education and a teaching practicum. Upper secondary teachers must hold a
master's degree in a specific subject area and then complete a one-year in-service teacher-training course.
Teachers’ salaries in Denmark are among the highest in OECD countries at all education levels, although salary
scales appear relatively flat when compared to the OECD average (with some improvements, as outlined in the
section on Funding, p. 16). Teachers work increasingly in teams and benefit from the support of special advisors.
They are generally keen to receive feedback for their professional development, but in fact they receive less
feedback than teachers in many other countries and there does not seem to be a shared understanding of what
counts as excellence in teaching. Also, Danish teachers participate less in professional development activities,
which are generally decided at the school level (75.6%, compared to the TALIS average of 88.5%), and they
spend fewer days on professional development than the TALIS average (9.8 days compared to the TALIS
average of 15.3 days). With a new reform aiming to extend school days in Denmark (see Spotlight 2), it will be
important to ensure adequate support to schools to help teachers succeed in their additional responsibilities.
The challenge: Ensuring that teachers have quality support, feedback and professional development
opportunities and that principals assume a more pedagogical role.
Recent policies and practices
A recruitment campaign was initiated by the Ministry of Education in 2010 to attract more of the best
students to the teaching profession.
A new reform being introduced in Denmark aims to improve the quality of the Folkeskole, modifying aspects
of compulsory education, such as the school day and the curriculum, providing additional support to schools and
raising the stakes for school leaving examinations before post-compulsory education (see Spotlight 2).
A major reform of teacher education in Denmark (2012) has as its guiding principles deregulation,
internationalisation and a strong connection between teacher training and the needs of the Danish public school
system. Starting in 2013, the Bachelor of Education programme will be guided by competency objectives for each
teaching practice, teacher education will be constructed around modules, and the University Colleges
(Professionshøjskoler) will be granted more autonomy in setting programme structures and determining the
content of modules for development of different teacher profiles.
EDUCATION POLICY OUTLOOK: DENMARK © OECD 2013 10Figure 5. The learning environment (PISA 2012)
Denmark Index: OECD average=0
0.7
0.6
0.5
0.4
Index point
0.3
0.2
0.1
0.0
-0.1
-0.2
-0.3
Index of teacher-student Index of classrooms Index of instructional
relations (students' views) conducive to learning leadership
(students' views)
Source: OECD (2013), PISA 2012 Results: What Makes Schools Successful (Volume IV): Resources, Policies and Practices,
PISA, OECD Publishing, Paris, http://dx.doi.org/10.1787/9789264201156-en.
Spotlight 2. Improving Danish public schools (Folkeskole)
A reform is in the process of being introduced in Denmark aiming to raise standards for Danish public
schools, based on an agreement by the different political parties in 2013. Most of the necessary legislation for its
implementation in 2014 has now been passed by the Danish Parliament.
Operative result targets are to have at least 80% of students achieve good national test scores in
mathematics and reading, to gradually increase the number of high performers, to gradually reduce the number of
low performers, and to improve student well-being.
To meet these objectives, the reform has the following aims:
to modify the school day in terms of distribution of learning times by having more subject-divided
lessons and assisted learning, introducing daily physical activity, and opening up schools to their
communities, collaborating with associations for selected activities
to clarify and simplify the Danish Common Objectives for teaching of individual subjects to support
better teaching and learning
to advance provision of elective subjects by one year to year 7 and to make them mandatory, to be
delivered by municipalities
to raise the stakes of the public school leaving examination for entry into post-compulsory education
to deliver additional funding to ensure that teachers have appropriate training and continuous
professional development and to allow schools to have additional pedagogical staff to support
schools and classroom progress
to create a national body of 40 learning consultants to deliver advice to municipalities and schools.
EDUCATION POLICY OUTLOOK: DENMARK © OECD 2013 11EVALUATION AND ASSESSMENT TO IMPROVE STUDENT OUTCOMES:
NATIONAL EVALUATION FRAMEWORK STILL IN PROGRESS
The tradition of autonomy for schools in Denmark meant that in past years limited information was available
on student, school and system performance. In recent years, the government has made it a policy priority to
create a culture of evaluation by developing an evaluation and assessment framework. Two national evaluation
and assessment authorities, the National Agency for Quality and Supervision (2011) and the Danish Evaluation
Institute (1999) are responsible for strengthening the evaluation of quality, teaching and learning, and overseeing
implementation of national tests.
System evaluation is conducted through a national evaluation framework for the education system. It
makes student results public at three specific stages: the grades from year 9; the results of mandatory school-
leaving examinations and, at the system level, the results of national tests introduced in 2010 to measure national
progress. Some shortcomings have been identified in the framework (such as issues related to immigrant
populations) and there is a need to engage stakeholders to achieve consensus on the framework.
Public schools are evaluated externally by municipalities and the National Agency for Quality and
Supervision, while internal school evaluations vary among municipalities and schools. Municipalities will produce
biennial quality reports that include a standard set of indicators, but schools and municipalities have limited
capacity to analyse and use the data. It is therefore essential to strengthen their capacity to design effective
improvement strategies based on these data.
Teacher appraisal is voluntary, and practices such as internal school evaluations are defined locally, in
some cases by the school. There is a tradition of teacher self-appraisal and also some feedback from principals,
although this can vary and is not necessarily linked to professional development activities. According to TALIS, 16%
of lower secondary teachers reported having received feedback from their school principal at least three times per
year (compared to the TALIS average of 17.1%), showing that teachers in Denmark receive less feedback than
their colleagues in many other countries.
Students receive formative assessments to ensure continuous assessment of student learning.
Students take mandatory school-leaving examinations in year 9. National testing on different subjects takes place
in years 2, 3, 4, 6, 7 and 8. Students also receive a mandatory Individual Student Plan (details below). According
to PISA 2012, 84.7% of students are in schools whose principals reported that they use assessment data to
identify aspects of instruction or the curriculum that could be improved (compared to the OECD average of 80%)
(Figure 6).
The challenge: Completing a framework for evaluation and assessment, and using the results in schools.
Recent policies and practices
National tests from years 2 to 8 were implemented in 2010.
Individual Mandatory Student Plans (2006) document student progress against the Common Objectives in
compulsory education. They include a summary of students’ test and evaluation results and can provide the basis
for discussions between students and teachers, as well as with parents. A 2008 evaluation showed that 74% of
teachers use these plans. Apart from Danish and mathematics, student plans will not be mandatory in all subjects
in all years.
A Data Warehouse is being developed to strengthen evaluation and follow up initiatives in the entire
education sector. It also aims to facilitate access to steering and performance data for schools and municipalities.
The current reform to improve Danish public schools (see Spotlight 2) also aims to further strengthen the
evaluation framework by establishing national goals for public schools, improving municipal quality reports and
Individual Student Plans, and producing an annual status account on the national goals.
EDUCATION POLICY OUTLOOK: DENMARK © OECD 2013 12Figure 6. Percentage of students in schools where the principal reported assessments of students in
national modal grade for 15-year-olds (PISA 2012)
Denmark OECD average
100
80
% of students
60
40
20
0
To make decisions To monitor the To make judgements To identify aspects of
about students’ school’s progress from about teachers’ instruction or the
retention or promotion year to year effectiveness curriculum that could
be improved
Source: OECD (2013), PISA 2012 Results: What Makes Schools Successful (Volume IV): Resources, Policies and Practices,
PISA, OECD Publishing, Paris, http://dx.doi.org/10.1787/9789264201156-en.
EDUCATION POLICY OUTLOOK: DENMARK © OECD 2013 13GOVERNANCE: NATIONAL STRATEGY AND AUTONOMOUS
DECISION MAKING AT LOCAL AND SCHOOL LEVEL
The Ministry of Children, Gender Equality, Integration and Social Affairs now steers Early Childhood
Education and Care. The Ministry of Education steers compulsory and post-compulsory education in Denmark.
The Ministry of Higher Education and Science is in charge of higher education, and the Ministry of Culture is
responsible for the arts. Other bodies that help to shape national education policy include:
The National Agency for Quality and Supervision, established in 2011 as a part of the Ministry of
Education, operates at ISCED 1, 2 and 3 levels. It administers national and international assessments,
producing quality support materials and supervising public and private providers.
The School Council is an advisory body with authority to commission official evaluations in primary and
lower secondary public schools (Folkeskole).
The Danish Evaluation Institute conducts both officially commissioned and independent evaluations.
Other education stakeholders include Local Government Denmark, private school organisations, the
Confederation of Danish Employers, the Danish Union of Teachers and associations of school leaders,
parents and students.
Education policy is decentralised and delivered by municipalities. The Ministry of Education establishes
goals and content, and 98 municipalities manage overall quality of their schools, setting local objectives and
conditions and supervising them (a reform in 2007 reduced the number of municipalities from 271 to 98). The high
level of school autonomy means that effectiveness of education policy depends on the capacity of local
governments, school leaders and teachers to implement national strategies at the school level. Denmark has 146
upper secondary education institutions that offer one or more of the four programmes available and 117
institutions that offer VET programmes.
There is much parental engagement, as schools are run by a board of governors of elected parents,
teachers and student representatives. School boards implement education policies within the central and
municipal framework. Private schools are usually governed by parent-elected boards that have more
responsibility to oversee school quality than boards in public schools. Post-compulsory schools have autonomy
to develop educational opportunities and pedagogy. They are self-governing, although they operate under rules
established by the Ministry of Education. Upper secondary schools, social and health programmes and adult
education centres are funded by the state. School boards in self-governing institutions are responsible for
administrative and financial management. At the lower secondary level, 44% of decisions are made by the school,
while 34% are made by the local government and 22% are made by the central or state government (Figure 7).
Universities have a high degree of autonomy and self-governance. The University Act (2003) introduced
boards composed of a majority of external members as the university’s highest authority. In 2007, the government
reduced the number of universities from 12 to 8.
The challenge: Building the capacity of municipalities and schools to implement national strategies at the
local level.
Recent policies and practices
The platform emphasising education, A Denmark that stands together (2011), established the key education
priorities for Denmark, such as strengthening early childhood education and care and reforming primary and lower
secondary schools in collaboration with teachers and parents (see Spotlight 3). Also, as part of the 2013 reform of
Danish public schools (see Spotlight 2), Denmark aims to set clearer and more measurable goals for its education
system that will be followed up by annual status reports.
The government also intends to reform the legislation on primary and lower secondary education.
EDUCATION POLICY OUTLOOK: DENMARK © OECD 2013 14Figure 7. Percentage of decisions taken in public lower secondary schools at each level of government,
2010
100
80
% of decisions taken
School
60
Local
40 Regional or Sub-regional
Central or State
20
0
Denmark OECD average
Source: OECD (2012), Education at a Glance 2012: OECD Indicators, OECD Publishing, Paris, http://dx.doi.org/10.1787/eag-
2012-en.
Spotlight 3. National priorities for education (2011)
In November 2011, the recently appointed Prime Minister released the government platform entitled
A Denmark that stands together. Part of the platform focuses on improving education outcomes by ensuring
better early childhood education and care, reforming primary and lower secondary school in co-operation with
teachers and parents, increasing education enrolment and completion rates, and reducing the dropout rate.
The objectives include:
to increase the number of young people completing a vocational education and training programme
to reform education and training to increase growth and the labour supply
to launch an economic programme that includes funding for improvements in education
to invest in research.
Specific targets include:
95% of a cohort should achieve an upper secondary education by 2020
60% of a cohort should achieve a tertiary education by 2020
25% of a cohort should achieve a long tertiary education by 2020.
EDUCATION POLICY OUTLOOK: DENMARK © OECD 2013 15FUNDING: HIGH PUBLIC INVESTMENT AT ALL LEVELS OF EDUCATION
Denmark’s investment in educational institutions is above the OECD average, with low shares of private
expenditure. Denmark spent 8% of its GDP on educational institutions in 2010, compared to the OECD average
of 6.3% (Figure 8). Between 2005 and 2010, Denmark increased spending by 0.6 percentage points, above the
OECD average of 0.4 percentage points. The largest proportion of expenditure on educational institutions is from
public sources (94.5% in 2010) as in most other OECD countries, and the share of private funding (5.5%) is
among the lowest among OECD countries (OECD average of 16.4%).
Annual expenditure per student from primary to tertiary education (USD 12 848 in 2010) was above the
OECD average (USD 9 313). Since 2005, the annual expenditure per student has continued to increase slightly:
by 2% at primary, secondary and post-secondary non-tertiary levels (compared to an average increase of 17%
across the OECD) and by the same rate of 2% at tertiary level (compared to an average increase of 8% across
the OECD), as expenditure increased more than enrolments (the number of students increased by 5% and 8%
respectively). Since 2000, the average primary class size has remained stable (fewer than 20 students per
classroom), while teachers’ salaries (statutory salaries for teachers with 15 years of experience and minimum
training) have increased by 24%.
Denmark provides funds to both public and private schools depending on the number of students, aiming for
both types of schools to have similar funding (taking into consideration that private schools also receive parents’
fees). Municipalities are responsible for a much larger share of spending on education than is common in most
other OECD countries. Most students attend public schools, although a higher proportion of primary and lower
secondary students are enrolled in private schools than the OECD average (14% at primary level and 26% at
lower secondary level). Early childhood education and care institutions are financed by local authorities through
subsidies received from the central government. Parents pay a contribution for operating costs (with a discount for
a siblings) and the local council must grant financial aid to eligible parents. Public schools are funded by
municipalities, and it is up to each municipality to determine the funding and level of service provided to schools.
Some of the taxes collected by municipalities are redistributed through a sophisticated scheme of equalisation
between high-income and low-income municipalities. Private schools also receive significant levels of government
funding, supporting the tradition of offering private alternatives for schooling. Upper secondary schools are
autonomous and funded by the central government based on the principle that money follows the student (also
known as a taximeter system), a financing system based on per-capita grants to institutions, where grants to
schools depend on the number of students enrolled. The amount of the grant differs depending on student activity.
For self-governing institutions, grants are also based on specific criteria and are funded by the state depending on
the number of students enrolled.
Higher education institutions are partly financed by the Ministry of Higher Education and Science, based on
the taximeter system (funding based on the number of credits obtained by students each year, multiplied by a
taximeter rate specified by law for the different programmes), and by other income-generating activities. Most
expenditure on tertiary education is funded from public sources, with only 5% coming from private sources
(compared to the 2010 OECD average of 31.6%). In Denmark, student financial aid is developed to benefit a
large proportion of students, who can benefit from a generous grant and a loan scheme. Scholarships and grants
to households amount to 23.9% of public expenditure for tertiary education, above the OECD average of 11.4%.
More than half of students (53%) in tertiary-type A education, students of Danish nationality and first degree
programmes benefit from scholarships/grants.
The challenge: Optimising resources in a decentralised context.
Recent policies and practices
As part of the reform of Danish public schools (2013), the Danish Government also allocates around
EUR 134 million for professional development of pedagogical staff in schools and about EUR 8 million for
professional development of school leaders.
EDUCATION POLICY OUTLOOK: DENMARK © OECD 2013 16Figure 8. Expenditure on educational institutions as a percentage of GDP, by level of education, 2011
8
Expenditure as % of GDP 7 Tertiary
6
Upper secondary and post-
5 secondary non-tertiary
4 Primary and lower secondary
3
2 Pre-primary
1
Education combined (incl.
0 undistributed programmes)
Denmark OECD average
Source: OECD (2013), Education at a Glance 2013: OECD Indicators, OECD Publishing, Paris, http://dx.doi.org/10.1787/eag-
2013-en.
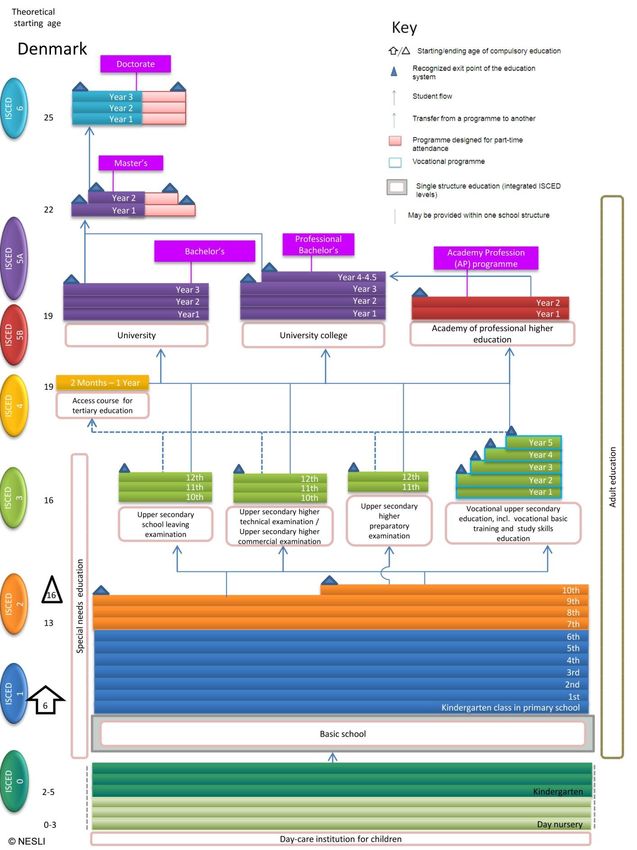
EDUCATION POLICY OUTLOOK: DENMARK © OECD 2013 17ANNEX A: STRUCTURE OF DENMARK'S EDUCATION SYSTEM EDUCATION POLICY OUTLOOK: DENMARK © OECD 2013 18
ANNEX B: STATISTICS
                                                                                      Average     Min   Max
  #                        List of key indicators 1,2,3                     Denmark
                                                                                      or total   OECD   OECD
                                              Background information
 Political context
     Public expenditure on education as a percentage
 1                                                                        8.8%       5.8%      3.8%    8.8%
     of GDP, 2010 (EAG 2013)
 Economy
     GDP per capita, 2010, in equivalent USD converted using PPPs
 2                                                                      40 600                15 195 84 672
     (EAG 2013)
 3 GDP growth 2011 (OECD National Accounts)                              -0.4%       1.5%     -6.4%    5.6%
 Society
 4 Population density, inhab/km 2, 2010 (OECD Statistics)                128.7        138        2.9    492
     Population aged less than 15 as a percentage of total population,
 5                                                                      18.1%       17.3%      13%    28.1%
     2010 (OECD Factbook 2011)
     Foreign-born population as a percentage of total population, 2009
 6                                                                        7.5%      14.1%      0.8%   36.9%
     (OECD Factbook 2011)
                                                Education outcomes
 7 Mean performance in mathematics (PISA 2012)                             500        494       413     554
     Annualised change in mathematics performance across PISA
 8                                                                         -1.8       -0.1      -3.3    4.2
     assessments (PISA 2012) 4
     Annualised change in reading performance across PISA
 9                               4                                          0.1        0.0      -2.8    4.1
     assessments (PISA 2012)
     Annualised change in science performance across PISA
 10                                                                         0.4        1.0      -3.1    6.4
     assessments (PISA 2012) 4
     Enrolment rates of 3-4 year-olds in early childhood education and
 11                                                                     94.1%       74.4%     11.6%    98%
     primary education, 2011 (EAG 2013)
     % of 25-64 year-olds whose highest level of attainment is lower
 12                                                                       23%        25%        7%     68%
     secondary education or below, 2011 (EAG 2013)
     % of 25-34 year-olds whose highest level of attainment is at least
 13                                                                       80%        82%       43%     98%
     upper secondary education, 2011 (EAG 2013)
     % of 25-34 year-olds whose highest level of attainment is tertiary
 14                                                                       39%        39%       19%     64%
     education, 2011 (EAG 2013)
     % of 25-64 year-olds whose highest level of attainment is
 15 vocational upper-secondary or post-secondary non-tertiary           42.5%       33.5%      8.4%   73.9%
     education, 2011 (EAG 2013)
     Unemployment rates of 25-64 year-olds by educational attainment, 2011 (EAG 2013)
     Below upper secondary                                                8.9%      12.6%      2.7%   39.3%
 16
     Upper secondary and post-secondary non-tertiary                       6%        7.3%      2.2%   19.2%
     Tertiary education                                                    5%        4.8%      1.5%   12.8%
                                            Students: Raising outcomes
 Policy lever 1: Equity and quality
 17 First age of selection in the education system (PISA 2012)              16         14        10     16
     Students performing at the highest or lowest levels in mathematics (%), (PISA 2012).
 18 Students performing below Level 2                                   16.8%        23%       9.1%   54.7%
     Students performing at Level 5 or above                              10%       12.6%      0.6%   30.9%
     Variance in mathematics performance b etween schools and within schools as a percentage of the OECD
     average variance in mathematics performance (PISA 2012)
 19
     Between schools percentage of variance                               13%        37%        6%     65%
     Within schools percentage of variance                                66%        63%       34%     90%

      % of students reporting that they have repeated at least a grade in
 20                                                                          4.7%      12.4%     0%     36.1%
      primary, lower secondary or upper secondary schools (PISA 2012)

EDUCATION POLICY OUTLOOK: DENMARK © OECD 2013                                                                   19
average Min Max
# List of key indicators Denmark
or total OECD OECD
Percentage of variance in mathematics performance in PISA test
21 16.5% 14.8% 7.4% 24.6%
explained by ESCS (PISA 2012) 4
Score difference in mathematics performance in PISA between
22 non-immigrant and immigrant students AFTER adjusting for socio- 40 21 -29.0 66.0
economic status (PISA 2012) 4
Score differences between boys and girls in mathematics (PISA
23 4 14 11 -6 25
2012)
Policy lever 2: Preparing students for the future
Adjusted mean proficiency in literacy among adults on a scale of 500 (Survey of Adult Skills, 2012)
24 Among 16-65 year-olds (adjusted) 270.1 270.7 249.4 293.6
Among 16-24 year-olds (adjusted) 275.4 278.0 260.0 297.0
Upper secondary graduation rates in % by programme of orientation, 2011 (EAG 2013)
25 General programmes 60% 50% 18% 82%
Pre-vocational/ vocational programmes 46% 47% 4% 99%
Average annual growth rate of upper secondary graduation
26 0.5% 0.6% -1% 3.6%
between 1995-2011 (EAG 2013)
First-time graduation rates (2011) and average annual growth tertiary education graduation (1995-2011)
Graduation rate tertiary-type A (general programme) 50% 40% 21% 60%
27 Graduation rate tertiary-type B (technical programme) 11% 11% 0% 29%
Average annual growth ratetertiary-type A 4.1% 4% -1% 11%
Average annual growth rate tertiary-type B 2.2% 0% -20% 14%
% of 15-29 years-old not in education, employment or training,
28 11% 15.8% 6.9% 34.6%
2011 (EAG 2013)
Institutions: Improving schools
Policy lever 3: School improvement
Mean index of teacher-student relations based on students’
29 0.15 0.00 -0.42 0.47
reports (PISA 2012)
Mean index of disciplinary climate based on students' reports
30 -0.01 0.00 -0.33 0.67
(PISA 2012)
% of teachers below the age of 40 by education level, 2011 (EAG 2013)
Primary education m 41% 15% 60%
31
Lower secondary education 38.9% 39% 11% 56%
Upper secondary education m 34% 7% 47%
Number of teaching hours per year in public institutions per education level, 2011 (EAG 2013)
In primary education 650 790 589 1 120
32
In lower secondary education 650 709 415 1 120
In upper secondary education 369 664 369 1 120
Ratio of teachers’ salaries to earnings for full-time, full-year adult workers with tertiary education, 2011
(EAG 2013)
33 In primary education 0.91 0.82 0.44 1.34
In lower secondary education 0.91 0.85 0.44 1.34
In upper secondary education 1.10 0.89 0.44 1.40
Growth rate of teachers’ salaries between 2000 and 2011 in lower
34 24% 16% -9% 103%
secondary education, (EAG 2013)
% of lower secondary education teachers reporting impact of
35 appraisal/feedback on their knowledge or understanding of their 10.9% 33.9% 10.9% 69.1%
main subject field(s) (TALIS 2008)
% of teachers who wanted to participate in more development than
36 47.6% 55% 31% 85%
they did in the previous 18 months, 2007-08 (TALIS 2008)
EDUCATION POLICY OUTLOOK: DENMARK © OECD 2013 20average Min Max
# List of key indicators Denmark
or total OECD OECD
Policy lever 4: Evaluation and assessment to improve student outcomes
% of students whose school’ principals reported that assessments are used for the following purposes
(PISA 2012)
To make decisions about students’ retention or promotion 10.3% 76.5% 1.5% 98.2%
37 To monitor the school’s progress from year to year 56.8% 81.2% 48% 100%
To make judgements about teachers’ effectiveness 27.1% 50.4% 14% 88.2%
To identify aspects of instruction or the curriculum that could be
84.7% 80.3% 49.4% 99.4%
improved
% of lower secondary education teachers reporting appraisal/feedback on their work with this
frequency, 2007-08 (TALIS 2008)
38 Once every two years or less 32.3% 35.8% 13.8% 65.6%
At least once per year 62% 52.2% 27.6% 68.6%
Monthly or more than once per month 5.8% 12% 3.3% 29.8%
Systems: Organising the system
Policy lever 5: Governance
% of decisions taken at each level of government in public lower secondary education, 2010 (EAG 2012)
Central or state government 22% 36% 0% 87%
39 Regional or sub-regional government m 6% 0% 36%
Local government 34% 17% 4% 100%
School government 44% 41% 5% 86%
Policy lever 6: Funding
Annual expenditure per student by educational institutions, for all services, in equivalent USD converted
using PPPs for GDP, 2010 (EAG 2013)
40 Pre-primary education 9 454 6 762 2 280 20 958
Primary education 10 935 7 974 1 860 21 240
Secondary education 11 747 9 014 2 470 17 633
Tertiary education 18 977 13 528 6 501 25 576
Relative proportions of public and private expenditure on educational institutions, 2010 (EAG 2013)
Public sources 94.5% 83.6% 57.9% 97.6%
All private sources 5.5% 16.4% 2.4% 42.1%
41 Index of change in expenditure on educational institutions, public
125 136 100 195
sources, (constant prices, 2000=100)
Index of change in expenditure on educational institutions, all
174 211 104 790
private sources, (constant prices, 2000=100)
Notes
1. The average, total, minimums and maximums refer to OECD countries except in TALIS and the Survey of Adult Skills, w here
they refer to participating countries.
2. "m": included w hen data is not available.
3. "NP": included if the country is not participating in the study.
4. Statistically significant values of the indicator are show n in bold.
EDUCATION POLICY OUTLOOK: DENMARK © OECD 2013 21REFERENCES AND FURTHER READING
Danish Evaluation Institute (EVA), http://english.eva.dk/.
Danish Government (2011), A Denmark that stands together, http://www.stm.dk/_p_13566.html.
European Commission (2013), Denmark: Overview, Eurypedia: European Encyclopedia on National Education
Systems: https://webgate.ec.europa.eu/fpfis/mwikis/eurydice/index.php/Denmark:Overview
Ministry of Education, www.eng.uvm.dk.
Ministry of Higher Education and Science, http://fivu.dk/en.
Ministry of Education (2013), “Agreement between the Danish Government (the Social Democrats, the Social- Liberal
Party and the Socialist People’s Party), the Liberal Party of Denmark and the Danish People’s Party on an
improvement of standards in the Danish public school (primary and lower secondary education)”. Document
retrieved 25 March 2014 from:
http://eng.uvm.dk/~/media/UVM/Filer/English/PDF/131007%20folkeskolereformaftale_ENG_RED.ashx.
OECD Directorate for Education and Skills, www.oecd.org/edu.
OECD (2004), Reviews of National Policies for Education: Denmark 2004: Lessons from PISA 2000, OECD Publishing,
Paris, http://dx.doi.org/10.1787/9789264017948-en.
OECD (2005), Reviews of National Policies for Education: University Education in Denmark 2005, OECD Publishing,
Paris, http://dx.doi.org/10.1787/9789264009745-en.
OECD (2009), Creating Effective Teaching and Learning Environments: First Results from TALIS, OECD Publishing,
Paris, http://dx.doi.org/10.1787/9789264068780-en.
OECD (2011), Starting Strong III: A Quality Toolbox for Early Childhood Education and Care, OECD Publishing, Paris,
http://dx.doi.org/10.1787/9789264123564-en.
OECD (2011), Education at a Glance 2011: OECD Indicators, OECD Publishing, Paris, http://dx.doi.org/10.1787/eag-
2011-en.
OECD (2012), Education at a Glance 2012: OECD Indicators, OECD Publishing, Paris, http://dx.doi.org/10.1787/eag-
2012-en.
OECD (2012), Equity and Quality in Education: Supporting Disadvantaged Students and Schools, OECD Publishing,
Paris, http://dx.doi.org/10.1787/9789264130852-en.
OECD (2013), Education at a Glance 2013: OECD Indicators, OECD Publishing, Paris, http://dx.doi.org/10.1787/eag-
2013-en.
OECD (2013), OECD Skills Outlook 2013: First Results from the Survey of Adult Skills, OECD Publishing, Paris,
http://dx.doi.org/10.1787/9789264204256-en.
OECD (2013), PISA 2012 Results: Excellence through Equity (Volume II): Giving Every Student the Chance to
Succeed, PISA, OECD Publishing, http://dx.doi.org/10.1787/9789264201132-en.
OECD (2013), PISA 2012 Results: What Makes Schools Successful (Volume IV): Resources, Policies and Practices,
PISA, OECD Publishing, http://dx.doi.org/10.1787/9789264201156-en.
OECD (2014), PISA 2012 Results: What Students Know and Can Do (Volume I, Revised edition, February 2014):
Student Performance in Mathematics, Reading and Science, PISA, OECD Publishing, Paris,
http://dx.doi.org/10.1787/9789264208780-en
Shewbridge, C., et al. (2011), OECD Reviews of Evaluation and Assessment in Education: Denmark 2011, OECD
Reviews of Evaluation and Assessment in Education, OECD Publishing, Paris,
http://dx.doi.org/10.1787/9789264116597-en.
EDUCATION POLICY OUTLOOK: DENMARK © OECD 2013 22You can also read