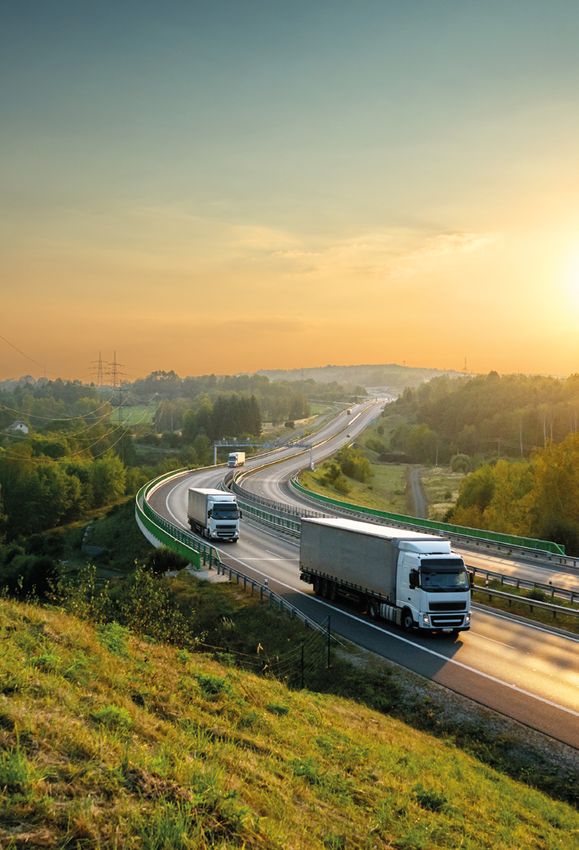
Trucking into a Greener Future - European Climate Foundation
←
→
Page content transcription
If your browser does not render page correctly, please read the page content below
Trucking into a Greener Future

We are grateful to the following
    organisations for contributing
    their expertise and insight:

    DB Schenker

    European Federation for
    Transport and Environment

    Geodis

    Michelin

    Siemens

    Smart Freight Centre

    Tesla

    Volvo

2
Acknowledgements

Analytical Team                                                          Disclaimer

Jon Stenning, Associate Director,                                        The stakeholders who contributed to this study shared the
Cambridge Econometrics                                                   aim of establishing a constructive and transparent exchange
                                                                         of views on the technical, economic and environmental issues
Jamie Pirie, Senior Economist,                                           associated with the development of low-carbon technologies
Cambridge Econometrics                                                   for vans and Heavy Goods Vehicles (HGVs). The objective was
                                                                         to evaluate the boundaries within which vehicle technologies
Richard Lewney, Chairman,                                                can contribute to mitigating carbon emissions from trucks in
Cambridge Econometrics                                                   Europe. Each stakeholder contributed their knowledge and
                                                                         vision of these issues. The information and conclusions in
Celine Cluzel, Director,                                                 this report represent these contributions, but should not be
Element Energy                                                           treated as binding on the organisations involved.

Felipe Rodríguez,
International Council on Clean Transportation

Rachel Muncrief,
International Council on Clean Transportation

Oscar Delgado,
International Council on Clean Transportation

Project coordination

Abrial Gilbert-d’Halluin, Senior Associate
European Climate Foundation

Pete Harrison, Transport Director,
European Climate Foundation

This is a summary of the Cambridge Econometrics report
Trucking into a Greener Future: The Economic Impact of
Decarbonising Goods Vehicles in Europe, which can be
downloaded here.

Suggested reference: Gilbert-d’Halluin A; Harrison P, Trucking into a greener future, 2018.

                                                                                                                                        3
Executive Summary

    The transition towards efficient and zero emission           products of 1bn barrels of oil equivalent. The rapid
    Heavy Goods Vehicles (HGVs) with an increasing level         and continued decline in cost and weight of batteries
    of electrification will reduce capital outflow from the      will also enable a much faster transition to zero-emission
    European economy. In terms of efficiency, advances in        freight transport than was thought possible until
    diesel engines, lighter construction materials and           recently. The Zero Emissions Vehicle scenarios in this
    more efficient tyres, will significantly reduce European     study can save much higher quantities of oil: around
    spending on oil, of which about 89% is imported from         11bn barrels of oil equivalent cumulatively by 2050.
    overseas. The gradual introduction of electric and
    hydrogen-fuelled propulsion systems will reduce energy       Altogether, these factors are likely to boost the
    import costs further. And while these technology             European economy. The analysis presented in this
    changes will increase the upfront capital costs for          report shows that switching to low-carbon trucks in
    hauliers, this will quickly be offset via lower spending     Europe would lead to a consistent increase in GDP
    on diesel, reducing the overall cost of road freight         over 2030 and 2050. This transition could help to
    services. Even for advanced systems such as Battery          create over 120,000 net new jobs by 2030, depending
    Electric Vehicles (BEVs) and Fuel-Cell Electric Vehicles     on the balance achieved between various powertrain
    (FCEVs), the Total Cost of Ownership (TCO) can be very       technologies, and the degree to which they are
    competitive compared to diesel vehicles over 5 years.        imported or produced in Europe.

    The transport sector has become Europe’s biggest             However, there are many challenges to be overcome
    source of CO2 at 27%, eclipsing the power sector. Air        before these benefits can be realized. Hauliers will
    pollution caused by nitrogen oxides and particulate          see a shift in costs away from fuel and towards capital
    matters is a deadly problem. The transition to clean         assets, which might create financing challenges. The
    mobility requires a systemic approach and this transition    analysis also brings to light a significant need for
    will not be successful without important changes to the      spending on new energy infrastructure - a cumulative
    technologies used to power vehicles. Zero Emissions          sum of between €80bn and €140bn by 2050, depending
    Vehicles (ZEVs) as well as zero emission infrastructure      on the pathway followed. There will also be a change
    contribute to tackle climate change, air pollution and       in the skills needed for manufacturing zero emission
    energy security issues.                                      trucks and infrastructures, as well as the energy needed
                                                                 to power them. This highlights the need to invest in
    At present Europe imports 89% of its crude oil, the          training or re-training in the fuels and auto sectors.
    vast majority of which is used for transport fuel.
    Reducing this capital outflow will allow Europe to           European policymakers should start working on
    reconcile the fight against climate change with the          forward-looking policies to help de-risk investments by
    creation of new economic opportunities. By increasing        hauliers and energy suppliers to support a successful
    the share of domestic energy, particularly electricity       transition to the technologies of the future.
    and hydrogen produced from renewable energy
    sources, Europe’s energy trade balance will be improved,     These policies could take the form of a direct stimulus
    also limiting exposure to the price volatility of crude      to infrastructure provision or a stimulus to vehicle uptake,
    oil. If enacted at a global level in both the light-duty     which would have the knock-on effect of creating
    and heavy-duty sectors, the transition to low-carbon         demand for charging infrastructure (for example, via
    vehicles would help reduce the price of crude oil, further   subsidies, road toll exemptions, tighter CO2 standards
    strengthening the economies of oil-importing countries1.     and public procurement policies). It could also support
                                                                 pilot projects on fleet scale, showing that zero
    By 2030, using more efficient diesel trucks, combined        emission solutions (vehicles and infrastructure) for
    with the gradual integration of new electric and             HDVs can be profitable.
    hydrogen vehicles and infrastructure, would lead to a
    cumulative reduction in imported oil and petroleum

4
Introduction

The Paris Agreement seeks to hold average global              This expert panel met on several occasions during
temperatures to well below 2 degrees Celsius, largely         2017-2018 to advise an analytical team, which was
through cutting the use of fossil fuels. The European         tasked with answering the following key questions:
Commission’s “Strategy on Low Emissions Mobility”
                                                              • What are plausible deployment scenarios for clean
foresees a fundamental shift away from petroleum
                                                              technologies for trucks, and to what extent can they
towards greener energy sources, and the EU institutions
                                                              contribute to meeting the EU’s climate goals?
are currently debating a proposal for CO2 standards for
trucks2. It is clear that change is coming fast and efforts   • What is the range of possible impacts on hauliers
should cover all types of road freight, ranging from          from changes to vehicle purchasing costs and overall
long-distance goods transportation with heavy-duty            vehicle running costs?
trucks to parcel delivery in cities with vans. This study
focuses primarily on reducing the carbon content of           • How much would the EU need to invest in charging
fuel for heavy duty trucking with consideration of fuel       infrastructure for the agreed technology scenarios?
efficiency technologies that can be fitted onto trucks.
                                                              • What is the likely range of overall impacts on the
                                                              European economy and on society?
It is inevitable that much of this change will be achieved
via the adoption of new vehicle technologies. For
                                                              It is also worth noting four potential impacts that this
Europe, with many national economies heavily
                                                              study has NOT attempted to quantify:
invested in automotive production, such goals will
have profound and far-reaching consequences. With             • It has not tried to measure the impact on the
this in mind, the European Climate Foundation (ECF)           competitiveness of the EU truck manufacturing industry,
convened a project to examine the main social,                either from outpacing or from lagging behind the
environmental and economic impacts of a technology-           global transition to clean mobility.
led transition to low-carbon trucks.
                                                              • It has not tried to measure changes to the number
                                                              of trucks that might result from potential changes in
While this study focuses on vehicle and infractructure
                                                              consumption.
technologies, we acknowledge that the transition to
low-carbon mobility will also require many other              • While the study does provide calculations of the net
solutions. To help inform the assumptions and review          impact on the economy as a whole, it does not provide
the emerging evidence, the ECF convened an expert             a detailed analysis of the changes in employment
panel comprised of individuals from industry and              within the automotive sector itself.
civil society. From industry were experts from Volvo,
Tesla, Siemens, DB Schenker, Geodis and Michelin,             • It has not tried to measure the effect of autonomous
and from civil society were experts from the Smart            freight transport. The technology is in early phase but it
Freight Centre, European Climate Foundation and the           has a very disruptive potential thanks to high utilization
European Federation for Transport & Environment.              rates of trucks and a radical shift in operations. The
                                                              integration of zero emission technologies to autonomous
                                                              trucks is an important area for further analysis.

                                                              As such, the main result of this study is an overview of
                                                              a structural change to the road freight sector whereby
                                                              there is an increase in efficiency, a change in drive-train
                                                              technologies and energy infrastructure for trucks, and
                                                              a shift from imported oil to domestically produced
                                                              electricity and hydrogen.

                                                                                                                            5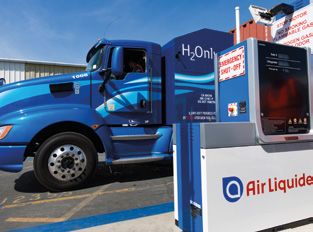
Methodology

    The modelling approach used in this project is described            The panel also advised on the most relevant input
    in detail in the technical report, and is summarised in             data on mobility, vehicles, energy, infrastructure and
    Figure 2. An expert panel was convened to help                      economy. These are described in later chapters. The
    construct a series of plausible technology deployment               agreed datasets were then fed into a stock model,
    scenarios, considering historic evidence of diffusion               which determined changes to Europe’s overall stock
    rates for low-carbon technologies, as well as the range             of capital assets and energy consumption per drive-
    of existing projections for future technology diffusion.            train technology on an annual basis under each of the
                                                                        scenarios. Finally, the outputs from the stock model
    These scenarios do not attempt to be forecasts, but                 were fed into the macro-economic model E3ME.
    instead they represent “what if?” scenarios that are
    designed to achieve long-term climate policy                        The E3ME model embodies two key strengths relevant
    objectives. Such changes need to be driven by                       to this project. The model’s integrated treatment of
    standards and economic instruments at least until the               the economy, the energy system and the environment
    total cost of new technologies reaches parity with                  enables it to capture two-way linkages and feedbacks
    existing technologies. Some low-carbon technologies                 between these components. Its high level of
    are already cost-competitive but the challenge they                 disaggregation enables relatively detailed analysis
    face is one of deployment.                                          of sectoral effects. E3ME delivered outputs in terms
                                                                        of changes to household budgets, the energy trade
    The deployment of technologies which impact upon                    balance, consumption, GDP, employment, CO2, NOx
    new vehicle efficiency is based upon the payback                    and particulates.
    period of each technology. The analysis examined
    their deployment across four categories: Vans, Light
    Heavy Goods: (3.5 to 7.5 tonnes); Medium Heavy
    Goods Vehicles (7.5 to 16t); Heavy Heavy Goods
    Vehicles (>16t).

                   DATA INPUTS                             EXPERT PANEL                              STOCK MODEL
                                                                                                  Calculates the stock of capital
                Data on volume of energy                                                          assets & energy consumption
             needed to provide mobility service                                                   per sector on an annual basis

                Data on cost & efficiency of
               energy-converting technology

                                                                                                 SIMULATION MODEL

                    Data on price of oil,                                                                     E3ME
                     gas and electricity

                                                             Reviews:
                                                                                                 MODEL OUTPUTS
                   Economic projections
                                                             • Data
                                                                                               • Employment impact across sectors
                                                             • Scenarios                       • Impacts on household budgets
                                                             • Assumptions                     • Changes to consumption, GDP

                            €                                                                  • Changes to energy trade balance
                                                                                               • Changes to CO2 ,NOX, particulates

6         Figure 1. An overview of the modelling approach used.
Technology Deployment and Scenarios

There is a wide range of uncertainty about future deployment of low-
and zero-emissions technologies, which will be impacted by changes
to technology costs, energy costs, the level of taxes and incentives, and
consumer preferences. The project therefore considered various scenarios for
the deployment of the main technology options that are being considered:

• Increasingly efficient Internal Combustion Engine trucks    • Battery electric trucks (BEVs), similar to Tesla’s Semi-
(ICEs), similar to an very fuel efficient Volvo FH 420.       truck or Volvo’s medium heavy duty FL and FE lines.

• Fuel-cell electric trucks (FCEVs), similar to the Semi-     • Electric Road Systems (ERS) consist of infrastructure
truck recently launched by Toyota.                            (e.g. catenary) which supplies electrical energy to
                                                              trucks while they move. The trucks maintain their
                                                              operational flexibility thanks to the ability to connect
                                                              and disconnect while moving and by being able to
                                                              operate outside of the infrastructure. This is possible
                                                              either with a hybrid drive train (PHEV-ERS) or by having
                                                              a sufficient battery (BEV-ERS).
                                                                                                                           7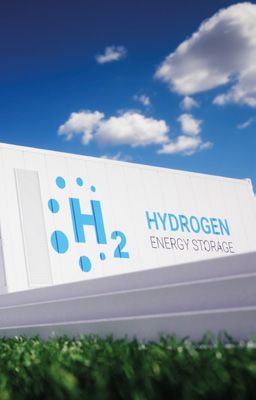
The main goal of this analysis was not to predict the role and share of each technology,
    but to explore the potential impacts on the European economy. By 2050, it is likely the
    technology mix in the overall fleet will include a set of technologies options suitable for
    various uses. In this study, four comparable scenarios were designed in which each of the
    four technologies is dominant in order to more clearly show the difference between the
    impacts of each technology pathway.

    In seeking to determine plausible deployment rates, the expert panel drew on past
    evidence of technology deployment rates in the auto sector, showing that previous
    engine technology improvements have taken around 10-15 years from first deployment
    to full mass-market penetration. The Zero-Emission Vehicles deployment scenarios are
    summarized in Figure 2.

                             SALES SHARES OF NEW HEAVY
                             GOODS VEHICLES IN EUROPE

8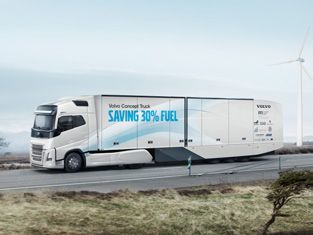
Key: ICE PHEV BEV PHEV-ERS FCEV BEV-ERS
2015 100 %
TECH BEV
2020 97 %
Advances in battery packs and
2025 5% 4% 90 % other electric components can
already enable shorter distance
2030 12 % 4% 81 %
urban commercial duty vehicles
2035 30 % 63 % to become plug-in electric,
similar to cars. In this scenario,
2040 55 % 4% 38 %
BEVs emerge as the dominant
2045 70 % 6% 22 % technology in the MHGV and
HHGV segment.
2050 80 % 8% 10 %
0% 10 % 20 % 30 % 40 % 50 % 60 % 70 % 80 % 90 % 100 %
Figure 2a.
Evolution of new vehicles sales by technology type until 2050 in the TECH BEV scenario.
2015 100 %
2020 5% 95 % TECH FCEV
Hydrogen fuel cell technology
2025 5% 93 %
might be especially key for
2030 12 % 4% 81 % longer-distance duty cycles. It
can also be a potential solution
2035 30 % 63 %
to applications like suburban
2040 55 % 4% 38 % delivery trucks, drayage trucks,
and shuttle buses where flexibility
2045 70 % 6% 22 %
and long range is needed.
2050 80 % 8% 10 %
0% 10 % 20 % 30 % 40 % 50 % 60 % 70 % 80 % 90 % 100 %
Figure 2b.
Evolution of new vehicles sales by technology type until 2050 in the TECH FCEV scenario.
2015 100 %
2020 97 %
TECH ERS
2025 5% 4% 90 %
Battery electric vehicles with
2030 9% 4% 81 % overhead catenary or in-road
charging can enable electric
2035 20 % 10 % 5% 63 %
zero-emission goods transport
2040 30 % 25 % 6% 38 % on and around heavily traveled
freight corridors.
2045 25 % 45 % 8% 22 %
2050 10 % 70 % 10 % 10 %
0% 10 % 20 % 30 % 40 % 50 % 60 % 70 % 80 % 90 % 100 %
Figure 2c.
Evolution of new vehicles sales by technology type until 2050 in the TECH ERS scenario.
9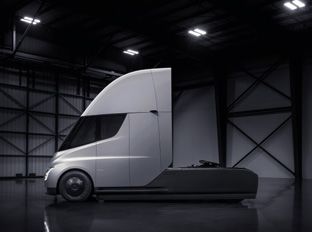
The deployment of low-carbon technologies will lead                             This analysis indicates that BEV trucks will be cost
                                           to an increase in the upfront capital cost of trucks, as                        competitive with diesel trucks, on a Total Cost of
                                           summarized in Figure 3. The upfront cost of buying a                            Ownership (TCO) basis, before 2030, if battery costs
                                           diesel truck will increase by 2030, as more technologies                        continue to fall as anticipated. FCEV trucks will remain
                                           are deployed to meet EU CO2 targets. All four of the                            more expensive than battery-electric systems to 2050,
                                           electrified technologies considered have considerably                           but may find applications in specific (long distance)
                                           higher purchasing costs. Initially, there is a significant                      use cases. Vehicles using ERS systems have the lowest
                                           difference between the upfront costs of different                               TCO for routes where such systems are available. Thus
                                           powertrains, but this difference will be reduced by                             a system where ERS is installed on the busiest corridors
                                           2050 as scale economies reduce the cost of new                                  and used by BEVs that have sufficient range to go to
                                           technologies, and technologies improve, leading to a                            and from the ERS network would offer the lowest TCO.
                                           convergence of capital costs.
                                                                                                                           However, other factors also affect vehicle purchasing
                                           However, it is insufficient to merely consider the                              decisions. For example, each technology option has
                                           capital costs of trucks in future, as haulage companies                         different challenges with infrastructure deployment. In
                                           also consider the other costs of ownership, such as                             addition, the haulage sector contains a large number
                                           fuel costs. This changes the picture considerably, as                           of very small operators that have constrained access
                                           shown in Figure 4, which shows the 5-year total cost of                         to finance, which means that the increase in upfront
                                           ownership for new heavy trucks in 2030 and 2050. All                            costs could prove to be a barrier. This highlights the
                                           scenarios assume costs based on mature technologies.                            importance of forward-looking policies to help drive
                                                                                                                           technology deployment.

                                                    180

                                                    160                                 55%                  56%
                                                                                                     47%                                                 47%
                                                                                                                                               41%                   43%
     Manufacturing costs in thousands € (2015)

                                                    140
                                                                                                                           26%       22%
                                                    120                        16%                                                                                               17%

                                                    100

                                                     80

                                                     60

                                                     40

                                                     20

                                                      0
                                                            2015               2030      2030        2030    2030          2030       2050     2050       2050       2050        2050
                                                            ICE                ICE       BEV        PHEV-    FCEV          BEV-       ICE      BEV       PHEV-       FCEV        BEV-
                                                                                                     ERS                   ERS                            ERS                    ERS

                                                                   Tractor (excl Powertrain) + Trailer      International Combustion Engine       Additional system requirements
                                                                   Electric motor                           Battery pack                          Fuel efficiency technologies
                                                                   Fuel cell                                H2 compressed tank                X% Cost premium relative to 2015 ICE

                                                 Figure 3. Upfront capital cost of various Heavy Heavy Good Vehicle (HHGV) types in 2030
                                                           and 2050 compared to a 2015 Internal Combustion Engine (ICE) technology.

10
BEVs have a very competitive running cost, which FCEVs might look the most costly among the ZEV
leads to a competitive TCO over 5 years. However, the options on a TCO basis, but from the perspective of a
challenges are the higher vehicle purchase price; the haulier the upfront purchase costs are similar to those
need for policymakers to develop EU-wide charging of other ZEV technology options. The challenges for
standards; the need for a major investment in rapid this pathway are the relatively expensive hydrogen,
charging infrastructure; and the increased load on the compared to electricity, and the need for a large
electricity grid at certain times of the day and in certain upfront investment in hydrogen refueling infrastructure.
locations.
BEVs or PHEVs are at least as cheap to run using ERS
systems, with the lowest 5-year TCO of all. Also this
pathway faces the challenge of investment in ERS
infrastructure, which will require substantial public-
sector intervention for deployment. The additional
load on the electricity system is unlikely to vary much
throughout the day, which might help minimize the
challenge of grid integration.
350
1%
300 -11%
-15% -16%
250
TCO in thousands € (2015)
-39% -37%
200
-44% -45%
-49%
-51%
150
100
50
0
2015 2030 2030 2030 2030 2030 2050 2050 2050 2050 2050
ICE ICE BEV PHEV- FCEV BEV- ICE BEV PHEV- FCEV BEV-
ERS ERS ERS ERS
Depreciation Infrastructure Fuel costs X% TCO relative to 2015 ICE
Figure 4. Total Cost of Operating a Heavy Heavy Good Vehicle over 5 years of
various powertrains in 2030 and 2050 compared to a 2015 ICE truck.
11Infrastructure Investment
In order to determine the economic impact of the Firstly, this analysis shows that the infrastructure costs
transition to low-carbon trucks, it is also important are relatively similar for all technology scenarios. TECH
to account for investments in charging and fueling FCEV and TECH BEV have the highest infrastructure
infrastructure. This chart shows the calculated cost reflecting the higher costs of establishing a
cumulative investment in charging infrastructure network of hydrogen refueling stations relative to the
to service the energy demand of the ZEVs in each deployment of ERS for an equivalent rollout of ZEVs.
scenario. For BEVs, this represents the cost of both Secondly, it is clear that the investment requirements
depot chargers and rapid chargers. For the ERS, this are substantial, but manageable, and will all require
represents the cost of the ERS infrastructure, such as sustained and extensive infrastructure investments
catenary, substations and grid connections. In this by government and industry. To give a point of
scenario, Electric Road Systems are deployed across comparison, these costs are around half the size of the
the core TEN-T network. For FCEVs, this represents infrastructure investment required for a fleet of zero-
the costs of hydrogen refueling stations. emissions cars3.
TOTAL CUMULATIVE INVESTMENT IN INFRASTRUCTURE
160
140
120
100
Billion € (2015)
80
60
40
20
0
2018 2022 2026 2030 2034 2038 2042 2046 2050
TECH_BEV TECH_FCEV TECH ERS
Figure 5. Total cumulative investment needs in infrastructure in each scenario.
1213
Economic Impacts

     While there is uncertainty about many of the factors                                         The second major economic impact is an efficiency
     within this transition, we have tried to capture this                                        gain throughout the road transport system. The
     uncertainty within the range of assumptions used for                                         vehicle fleet becomes increasingly efficient, due to
     the macro-economic modelling. This has allowed us to                                         improved diesel engines, more hybrids, and because
     identify the main changes that would occur within the                                        electric motors are inherently more efficient in their
     European economy during the transition to low-carbon                                         own right. This occurs both as a result of existing climate
     road freight.                                                                                policies (e.g. the proposed EU CO2 standards), and
                                                                                                  anticipated policies to meet future climate goals. More
     Firstly, there is increased investment in capital assets.                                    efficient use of energy leads to lower costs for logistics
     The shift towards efficient diesel trucks, vehicles using                                    companies, which is then distributed to the rest of the
     electric road systems, BEVs and FCEVs increases                                              economy via a reduction in the cost of retail products.
     the investment in automotive technology and on
     average generates additional value for Europe. This                                          The third main economic impact is the shift away from
     is especially the case if European companies can                                             petroleum, which is imported from outside Europe,
     establish a competitive position in the manufacturing                                        towards electricity and hydrogen, which are largely
     of battery cells. Already, some initiatives have                                             produced domestically, meaning that Europe starts to
     been taken to lay the foundations for battery cell                                           capture a greater share of the value from energy used
     manufacturing in Europe (LG Chem in Poland,                                                  in mobility. Figure 6 shows the cumulative saving on oil
     Northvolt in Sweden). While these trucks are more                                            and petroleum imports in each of the core scenarios
     expensive for hauliers to purchase, this is quickly offset                                   compared to a scenario in which trucks are unchanged
     by savings on fuel spending.                                                                 from today (REF).

                                                                     TECH_ICE   TECH_BEV               TECH_FCEV               TECH_ERS
                                                              0.0
           Cumulative oil saving from REF from 2015 (bboe)

                                                              -2.0

                                                              -6.0

                                                              -4.0

                                                              -8.0

                                                             -10.0

                                                             -12.0
                                                                                           2030      2050

        Figure 6. Impact of the ZEV scenarios on EU oil imports in 2030 and 2050, compared to 2015.

14
By 2030, the lower demand for petrol and diesel Improving the efficiency of diesel engines (TECH ICE)
from vans and HGVs in the Zero-emission vehicle leads to a small increase in GDP, which levels off as
technology (ZEV) scenarios leads to a total reduction technologies reach the limits of their potential and
in imported oil and petroleum of 1bn barrels of oil as oil import reductions stabilize. Only the transition
equivalent. By 2050, a much greater saving in oil to ZEV technologies leads to a consistent increase in
imports is achieved, saving around 11bn barrels of GDP over the period studied. By 2050, European GDP
oil equivalent cumulatively. In comparison, the final is around €52bn - €58bn higher in all ZEV scenarios
energy consumption of petroleum products across the than in the reference case.
EU28 was 1.98bn barrels of oil equivalent in 20154.
This study did not look at questions about the
Using the macro-economic model E3ME, we have future location of production of batteries for trucks.
measured the net economic impact of this transition, Sensitivities that explored the difference in GDP
again compared to a reference case in which trucks outcomes when only half of domestic demand was
remain unchanged from today (REF) (Figure 7). This met through domestic production, and a case where
chart shows that all scenarios lead to a mild increase all battery cells are imported from outside of Europe
in GDP, which results from a reduction in spending were conducted in the Fuelling Europe’s Future report
on petroleum and an increase in spending on on light-duty vehicles5.
technologies and electricity and hydrogen that are
produced in Europe. Figure 7 shows a combined positive impact of
decarbonizing the trucking sector on GDP of around
0.23% by 2050 in all scenarios compared to Business
as Usual.
0.25
0.20
Difference from REF (%)
0.15
0.10
0.05
0
2018 2022 2026 2030 2034 2038 2042 2046 2050
TECH ICE TECH BEV TECH FCEV TECH ERS
Figure 7. Impact of the Zero Emission Vehicles scenarios on EU GDP.
15Jobs Impacts
It is also important to consider the impact of this transition on employment. The
impact reflects the changes in value added between sectors described above, but
it also needs to take account of variations in employment intensity between sectors.
These employment intensities are taken from Eurostat data and are shown in Figure
8. At the low end of the range is the extraction and refining of petroleum, which
creates 4-6 jobs per million euros of value added. At the high end of the range is the
construction sector, creating 27 jobs per million euros of value added.
27
24 24
21
19
6
4
Oil and gas Petroleum Manufacture of Economy Services Construction Manufacturing
extraction refining Motor Vehicles
Figure 8. EU job intensities for selected sectors, jobs per million euros of value added.
There is an underlying trend towards increasing automation of the auto industry,
which reduces the number of jobs, regardless of the low-carbon transition. There are
also nuances between different vehicle types. Building BEVs is expected to be less
labour-intensive than building the diesel vehicles they will replace. Our modelling
accounts for this by taking the (lower) labour-intensity of manufacturing electrical
equipment and applying it to parts of the automotive value chain within the model.
In contrast, constructing hybrids, PHEVs and FCEVs is expected to be more labour
intensive than building traditional combustion trucks. The net employment impact
for the automotive sector from this transition therefore depends on the balance
achieved between these various powertrain technologies, and the degree to which
they are imported or produced in Europe.
16As investment is increased in new value chains such The shift in spending from petroleum to other areas
as for electrical equipment and construction, this of the economy leads to a overall macro-economic
also leads to increased employment in these sectors, improvement, and the consequent spending of
depending on the employment intensity in each higher incomes explains the increase in service sector
sector. employment across the overall economy.
Analysis in this project shows revenues are reduced Figure 9 shows the impact on employment by sector in
in the oil and gas sectors, but these have low zero emission vehicles scenarios. The largest change in
employment intensity so job losses are relatively jobs is in services. This is because households benefit
small and they are spread over several decades. In from lower costs of goods due to more efficient
the automotive sector, due to the greater complexity logistics chains, and the money they save is redirected
of more fuel-efficient diesel vehicles within the fleet to other areas of the economy, dominated by services.
mix, there are more jobs until 2030. After 2030, This effect is stronger than the boost to the electrical
however, jobs in automotive start to decrease as the equipment sector arising from the change in the motor
transition to ZEVs begins and production shifts from vehicles supply chain. In total, employment is around
the traditional motor vehicles sector to the electrical 120,000 higher in each ZEV scenarios in 2030 than in
equipment sector. At the same time, the deployment the reference case.
of infrastructure leads to more jobs in the electrical
equipment and construction sectors.
50
40
Additional jobs compared with REF (000s)
30
20
10
0
2018 2022 2026 2030
-10
Electrical equipment Motor vehicles Services
Manufactured fuels Electricity & hydrogen Other manufacturing
Construction
Figure 9. The employment impact per sector in Europe of the transition to low-carbon road freight (thousands) until 2030.
17Environmental Benefits
Figure 10 shows the impact of a growing share of low-carbon vehicles in new
sales on the tailpipe CO2 performance of the average new truck sold. Expected
improvements in the efficiency of diesel engines (TECH ICE) would bring about
significant reductions in the next 5-10 years, amounting to a 30% fall in CO2 per
kilometre driven by the late 2020s, but the assumed rate of technological advance
tails off thereafter. In the other scenarios, the emissions levels of the average HGV
drops sharply as ZEVs take up a larger share of new sales.
900
800 0%
700
Average new HGV gCO2/km
% difference relative to REF
-20%
600
500
-40%
400
-60%
300
200
-80%
100
0 -100%
2018 2022 2026 2030 2034 2038 2042 2046 2050
TECH REF TECH ICE TECH BEV TECH FCEV TECH ERS
Figure 10. Impact of the ZEV scenarios on EU CO2 emissions from the average new HGV in each scenario.
For each heavy goods vehicle introduced on to the market, equipped either with energy
efficiency systems, an electric engine or a fuel cell, average emissions are decreasing.
In the case of electric or fuel cell vehicles, the reduction will come from the expected
changes in the way energy is produced and the increased importance of renewable and
carbon-free energy sources.
18Reductions in emissions from internal combustion engines are mainly driven by
stricter standards in the EU.
400
350
300
250
MT CO2
200
150
100
50
0
2018 2022 2026 2030 2034 2038 2042 2046 2050
TECH REF TECH ICE TECH BEV TECH FCEV TECH ERS
Figure 11. Impact of the ZEV scenarios on EU CO2 emissions from the overall HGV fleet in each scenario.
Figure 11 shows the tailpipe CO2 emissions from the entire stock of road freight
vehicles in each scenario. In the REF case, an assumed increase in the demand for
road freight services drives an increase in CO2 emissions, given the assumption of
no further improvement in engine efficiency. In the other scenarios, emissions from
the HGV fleet fall in the period to 2030 reflecting the diffusion of more efficient
new vehicles through the stock. However, beyond 2030, the deployment of
advanced powertrains is required to deliver continued emissions reductions in the
face of growing demand for road freight services (shown by the fact that emissions
start to rise again in TECH-ICE) .
Whereas the more efficient potential diesel technologies can reduce carbon
emissions by about 40%, electric-drive technologies powered by renewable
sources can achieve over an 80% reduction in emissions6.
19Opportunities and Policy
Barriers to Overcome
All low-carbon scenarios have barriers but also bring For BEVs and FCEVs this means the availability of
formidable opportunities to accelerate the transition recharging / refueling sites with sufficient frequency
to a prosperous low-carbon society. and scale to support demand. In the early stages
of uptake, when the scale of demand is uncertain,
The low-carbon transition in road freight offers the risks to private sector operators to develop the
the prospect of large reductions in CO2 emissions infrastructure will be high. Without public intervention,
even as more freight is moved across Europe’s road the result could be a self-reinforcing cycle of limited
system. It can be achieved with efficiency gains and roll-out of infrastructure and limited uptake of ZEVs.
cost reductions for hauliers and net benefits for the For ERS the challenge is to establish multiple shuttle
European economy in terms of value added and jobs. applications across Europe in order to act where
But even as technological improvements reduce the production volumes increase, as well as to link up with
purchase cost of advanced powertrains and allow industrial clusters.
hauliers to take advantage of lower running costs,
there is a clear role for public policy to address • A third challenge is presented by the large number
potential obstacles to uptake. Zero emission vehicles of small operators in the haulage sector. These
and infrastructure can prove themselves to fullfil the operators work on tight margins and have constrained
operational requirements of the trucking companies, access to finance. Even if adoption of advanced
and do so economically. Opportunities for deployment powertrains offers the prospect of substantially lower
of low-carbon trucks in Europe will start to emerge running costs, the higher upfront cost of vehicle
when a switch is made to new technologies, if a purchase could be a significant barrier in the early
supportive policy environment can be put in place. stages of the transition when perceived risks are high.
• A first challenge is the promotion of common This highlights the importance of forward-looking
standards, notably in charging technologies, and policies to help de-risk investments by hauliers and
including harmonization between trucks and coaches. leasing companies, which would help drive technology
deployment. Examples could include fiscal incentives
• The second challenge is promoting coordinated roll- such as reduced sales tax.
out of the charging and refueling infrastructure. Clearly
hauliers need to be confident that they will be able to The low-carbon transition in road freight transport,
run vehicles over a wide geographical network across whether it comes from improved diesel engine
national boundaries. Energy supply companies also efficiency or uptake of advanced powertrains, will
need to be confident that operating the infrastructure obviously have an impact on government fuel tax
for zero emission trucking can be profitable. revenues. This will be mitigated slightly by the small
boost to incomes and spending and the associated tax
take coming from greater efficiency and substitution of
European production of ZEVs, their components and
fuels for imported petroleum.
20Figure 12 shows annual government tax revenues in the biggest source of emissions. It therefore seems
2050 in the REF and TECH_BEV scenarios. The figure unlikely that taxes will be set in such a way that
shows that fuel duty revenues are €23bn lower in 2050 significantly impedes the deployment of clean vehicle
in the TECH_BEV case. However, the figure also shows technologies. Road charging, tailored to reflect
that fuel duties form only a small part of the Member the carbon-intensity of vehicles, or a bonus-malus
State government tax base (estimated at 1.4% in 2050 approach could be potential solutions to address this
in the REF case). Changes will take place relatively issue without creating economic distortions. For the
slowly in line with the steady deployment of advanced purposes of this economic analysis, the approach is
powertrains into new sales. Hence, the lost revenues not important provided it is done in an equitable and
can be recouped through gradual changes to other revenue neutral manner.
taxes, which is the approach taken in the analysis
underpinning Figure 12. By introducing appropriate provisions or a stimulus
to vehicle uptake (for example, via subsidies, road
As government revenues from the taxation of diesel toll exemptions, tighter CO2 standards and public
and gasoline are reduced, it seems plausible that procurement policies) government would contribute
treasuries might seek to tax other energy sources for to overcome some of the main challenges of the
mobility, most notably electricity and hydrogen. On transition to zero emission trucks in Europe.
the other hand, the European Union has ambitious
CO2 reduction goals and transport has become
MEMBER STATE GOVERNMENTS' TAX REVENUES IN 2050
16000
14000
12000 4636 4644
10000
Billion € (2015)
8000
5225 5231
6000
209 186
4000
4321 4331
2000
0
REF TECH_BEV
VAT Revenue Fuel Duty Revenue Income Tax Revenue Social Security Revenue
Figure 12. Loss of fuel duty revenue is manageable.
21Conclusion
This project has explored the economic impact of the transition to low-carbon
vehicles, while using a mid-range set of cost assumptions and acknowledging
the inherent uncertainties. It has found that the transition from petroleum-
based energy sources to renewably sourced energy will strengthen Europe’s
economy, with mild increases to both net GDP and net employment. However,
there will be signicant transition challenges along the way. Electricity and gas
(for sustainable hydrogen) grids will need to be modernized as part of sectoral
integration, and a determined multi-sectoral effort is needed to deploy sufficient
charging infrastructure. Efforts must be made to ensure workers who are currently
producing legacy technologies are retrained for quality jobs in producing the
technologies of the future.
References
1. Oil Market Futures, Cambridge Econometrics, International Council on Clean Transportation, Pöyry Management Consulting, 2014.
2. European Commission legislative proposal setting CO2 emission standards for heavy-duty vehicles in the EU.
3. Harrison P, Fuelling Europe’s Future: How the transition from oil strengthens the economy, 2018.
4. Eurostat data.
5. Harrison P, Fuelling Europe’s Future: How the transition from oil strengthens the economy, 2018.
6. M. Moultak, N. Lutsey, D. Hall, White paper, Transitioning to zer-emission heavy-duty vehicles, ICCT, September 2017.
2223
Contact

European Climate Foundation
Rue de la Science 23, 1040 Brussels
T +32 2 894 9302
transport@europeanclimate.org
www.europeanclimate.org
You can also read