Design and Development of an Innovative Barrier Layer to Mitigate Crossover in Vanadium Redox Flow Batteries - IOPscience
←
→
Page content transcription
If your browser does not render page correctly, please read the page content below
Journal of The Electrochemical
Society

OPEN ACCESS

Design and Development of an Innovative Barrier Layer to Mitigate
Crossover in Vanadium Redox Flow Batteries
To cite this article: Marco Cecchetti et al 2020 J. Electrochem. Soc. 167 130535

View the article online for updates and enhancements.

                               This content was downloaded from IP address 46.4.80.155 on 24/10/2020 at 16:04
Journal of The Electrochemical Society, 2020 167 130535

                           Design and Development of an Innovative Barrier Layer to
                           Mitigate Crossover in Vanadium Redox Flow Batteries
                           Marco Cecchetti,1 Thomas Allen Ebaugh,2 Haoran Yu,2 Leonard Bonville,2
                           Chiara Gambaro,3 Laura Meda,3 Radenka Maric,2,* Andrea Casalegno,1 and
                           Matteo Zago1,*,z
                           1
                               Department of Energy, Politecnico di Milano, 20156 Milano, Italy
                           2
                               Center for Clean Energy Engineering, University of Connecticut, Storrs, Connecticut 06269, United States of America
                           3
                               Eni DR&D Renewable Energy and Environmental R&D Center, 28100, Novara, Italy

              Capacity loss induced by the undesired transport of vanadium ions across the ion-exchange membrane (i.e. crossover) is one of the
              most critical issues associated with vanadium redox flow batteries. This work reports on the manufacturing and testing of an
              innovative barrier layer to mitigate crossover. The barrier layer conceptual design is described in detail in the patent application
              WO 2019/197917. The barrier was deposited directly onto Nafion® 212 using the Reactive Spray Deposition Technology, in which
              carbon-rich particles (∼4–10 nm in diameter) formed in the flame were deposited simultaneously with a mixture of 1100EW
              Nafion® and Vulcan® XC-72R (∼40 nm diameter) that was sprayed from air-assisted secondary nozzles. During cycles at fixed
              capacity, the presence of the barrier layer significantly reduced battery self-discharge; the average variation of battery state of
              charge compared to a reference cell with Nafion® 115 was reduced from 21% to 7%. Moreover, battery energy efficiency was
              increased by nearly 5%, indicating that the barrier layer does not significantly hinder proton transport. During cycles at
              50 mA cm−2 with fixed cut-off voltages, the barrier layer exhibited stable operation, maintaining a coulombic efficiency around
              99.4%. Additionally, the use of the barrier layer projects to a 30% reduction of stack-specific cost.
              © 2020 The Author(s). Published on behalf of The Electrochemical Society by IOP Publishing Limited. This is an open access
              article distributed under the terms of the Creative Commons Attribution Non-Commercial No Derivatives 4.0 License (CC BY-
              NC-ND, http://creativecommons.org/licenses/by-nc-nd/4.0/), which permits non-commercial reuse, distribution, and reproduction
              in any medium, provided the original work is not changed in any way and is properly cited. For permission for commercial reuse,
              please email: permissions@ioppublishing.org. [DOI: 10.1149/1945-7111/abbbbb]

              Manuscript submitted July 16, 2020; revised manuscript received September 10, 2020. Published October 7, 2020.

    The vanadium redox flow battery (VRFB) has received signifi-                     especially at high operating current density. Thus, depending on the
cant attention in last few years as a viable energy storage technology             nominal operating conditions, the choice of a suitable membrane for
that exploits redox reactions of four different vanadium species                   VRFB application involves a trade-off between low vanadium-ion
(V2+, V3+, VO2+ and VO+      2 ) to convert electrical energy into and             permeability and high proton conductivity. Moreover, good stability
from chemical energy. The VRFB is a promising technology for                       in a highly corrosive environment and low fabrication costs are
energy storage because of its independent scalability of capacity and              necessary for product development.
power, high flexibility, high efficiency, and long cycle life.1–4 The                    Nafion® membranes are widely used in VRFBs due to their high
advantages of using VRFBs over other redox flow batteries are                       proton conductivity and good mechanical and chemical stability.
largely due to the use of vanadium redox couples in both half-cells.               However, Nafion® membranes are quite permeable to vanadium
Other redox flow batteries have different elemental species in each                 ions. This usually necessitates the adoption of thicker Nafion®
half-cell, which can cause irreversible cross-contamination between                membranes to limit capacity loss, which leads to increased ohmic
the half-cells. Furthermore, VRFB systems can achieve high energy                  loss and system costs.13 Sulfonated poly(ether ether ketone)
efficiencies up to 90%. Although VRFB systems are already                           (SPEEK) and sulfonated polyimide (SPI) membranes are alternative
commercialized, and the number of installations is continuously                    cation exchange membranes (CEMs) that are promising because of
increasing, VRFB performance is still hindered by some technolo-                   their reduced vanadium-ion permeability; however, their low proton
gical issues, among which is the capacity loss induced by the                      conductivity and poor stability hinder their usefulness with respect to
undesired transport of vanadium ions across the ion-exchange                       Nafion®.14 Anion exchange membranes (AEMs) are interesting
membrane.5–10                                                                      alternatives, but poor chemical stability and low conductivity limit
    The electrolyte solutions in VRFBs consist of vanadium ions                    their application in VRFBs.14,15 Amphoteric ion exchange mem-
dissolved in sulfuric acid. These solutions, called the anolyte and the            branes (AIEMs) combine the functional groups of both CEMs and
catholyte, flow from external tanks to the electrodes of the cells.                 AEMs, resulting in both low vanadium-ion permeability and good
During normal discharge VO+     2 is reduced to VO
                                                     2+
                                                        at the positive            conductivity. However, the complex preparation of these membranes
                   2+                    3+
electrode, and V is oxidized to V at the negative electrode.                       results in high costs.14,16
During charge, the reverse reactions occur. When vanadium ions                         In the literature, significant effort has been dedicated to the
cross the membrane, the consumption of VO+      2 and V
                                                        2+
                                                           occurs with             modification of membranes in order to improve vanadium/proton
no current exchange between the electrodes, leading to both                        selectivity.17–26 Yu et al.17 incorporated graphene oxide nanosheets
electrolyte imbalance and capacity loss. In the literature,11,12 it has            into recast Nafion® membranes, obtaining a significant decrease in
been demonstrated that crossover negatively affects battery perfor-                vanadium-ion permeability. Similarly, Su et al.19 proposed a
mance. Pugach et al.11 developed a new methodology to analyse                      graphene oxide/Nafion® composite membrane with orientated GO
VRFB losses in a commercial scale VRFB. They quantified the                         nanosheets. Vanadium-ion crossover in these composite membranes
effect of cross-over on both voltage losses and capacity decay,                    was reduced by two orders of magnitude, but the membrane
revealing that during discharge at 40 mA cm−2, cross-over accounts                 resistance increased by an unacceptable 60%. Zhang et al.18 reduced
for one third of voltage losses. Trovò et al.12 performed a detailed               membrane pore size with silica, obtaining higher coulombic effi-
quantification of losses occurring in a kW-class system, highlighting               ciency and similar voltage efficiency when compared to the original
that proton conductivity is more important than species permeability,              membrane. Kim et al.20 developed a sandwich-like structured
                                                                                   membrane with a central layered silicate layer by a solution-casting
                                                                                   and hot-pressing method. The silicate layer reduced the cross-over
  *Electrochemical Society Member.                                                 rate, but the cell voltage efficiency at 40 mA cm−2 was reduced by
  z
    E-mail: matteo.zago@polimi.it                                                  5% compared to a Nafion® 117 standard.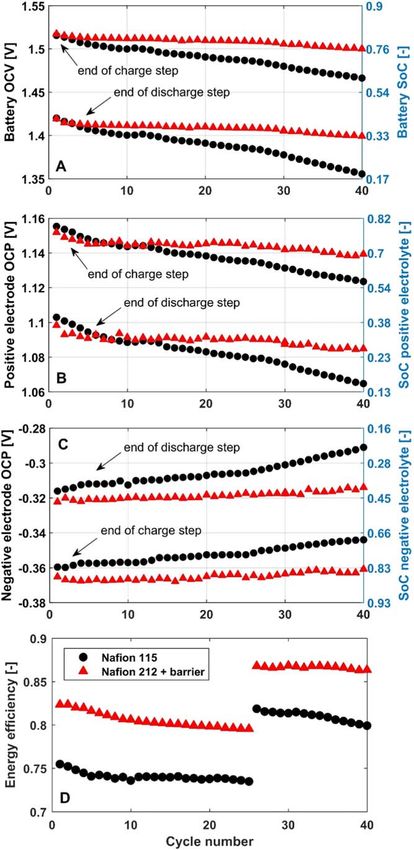
Journal of The Electrochemical Society, 2020 167 130535

    In this work, we pursued a different approach, in which an                       samples were gold-coated to limit the effects of charging. Images
additional selective layer, described in the patent application WO                   were taken using high-voltage of 5 kV, spot-size 2.5, 10 mm
2019/197917, was deposited directly onto a commercial cation                         working distance, and 3 microseconds dwell time.
exchange membrane. The selective layer, termed as a barrier, is a                       Cross-sectional samples of the barrier layer were cut transverse to
porous component in which pore size, tortuous path, thickness, and                   the plane of the membrane by potting in Spurr’s resin and cutting at
composition are designed to improve vanadium/proton selectivity.                     room temperature using a Lecia UCT ultramicrotome equipped with
Since the selectivity towards vanadium ions is mainly provided by                    an ultra 45° Diatome™ diamond knife. In this work, a 150 nm thick
the barrier, thinner membranes can be employed in the battery,                       cross-section mounted on a 50-mesh copper TEM grid was imaged.
implying system-cost reduction. Moreover, the barrier is manufac-                    Images were taken with a Talos TEM in both brightfield (BF) and
tured with Reactive Spray Deposition Technology (RSDT), which is                     high angle annular darkfield (HAADF) imaging modes.
a process characterized by fast deposition time, low cost, and
suitability to scale-up to the industrial scalea, implying additional                    Electrochemical characterization.— Cell hardware.—The cell
cost savings.                                                                        active area was 25 cm2. An interdigitated graphite distributor was
    The work is organized as follows. Experimental section firstly                    used at both the positive and the negative electrodes. The reference
describes barrier layer manufacturing by RSDT and ex situ                            membrane without the barrier layer was Nafion® 115 (thickness 127
characterization by means of scanning electron microscopy (SEM)                      μm), while the barrier layer was coupled with Nafion® 212
and transmission electron microscopy (TEM); then electrochemical                     (thickness 50 μm). Both positive and negative electrodes were
characterization in single-cell tests is presented. Subsequently, the                Sigracet® 39AA (nominal thickness of ∼290 μm, compressed to 230
experimental results are discussed and the proof of concept of the                   μm33). A pulse dampener was inserted in the hydraulic circuit to
barrier layer to mitigate electrolyte imbalance is demonstrated.                     dampen flow oscillations produced by the peristaltic pump (Watson-
Finally, relevant conclusions are given.                                             Marlow 323Du with a 314Dw 4 roller head pump).34,35
                                                                                         In order to monitor electrolyte state of charge (SoC) during cell
                                                                                     open circuit operation, a through-plate hydrogen reference electrode
                                 Experimental
                                                                                     was applied close to the cell inlet main channel of both the positive
    Barrier manufacturing by RSDT.—Barriers were deposited                           and the negative electrodes. A schematic of the experimental setup is
directly onto membrane samples at the University of Connecticut                      shown in Fig. 2. The local reference electrode measurement setup
using RSDT. The RSDT is a unique flame-based synthesis process                        has been extensively described in Refs. 36, 37. It consists of a
that is capable of depositing a wide range of materials directly onto a              Nafion® tube salt bridge (diameter 0.64 mm) that directly connects
variety     of    substrates,     especially   for    electrochemical                the surface of VRFB working electrode with a 5 M sulfuric acid
applications.27–32 For barrier fabrication, carbon-rich particles ∼4-                electrolyte solution, in which a Gaskatel HydroFlex® reversible
–10 nm in diameter were formed in the RSDT flame and were                             hydrogen electrode (RHE) is immersed.
deposited directly onto the membrane simultaneously with a mixture                       Positive and negative electrolytes were aqueous solutions of 1 M
of 1100EW Nafion® and Vulcan® XC-72R (∼40 nm diameter) that                           vanadium ions and 5 M sulfuric acid (Fischer Chemicals), prepared
was sprayed from air-assisted secondary nozzles (Nordson P/N:                        starting from vanadium (IV) sulfate oxide hydrate (Alfa Aesar)
7021604) as shown in Fig. 1.                                                         according to the procedure described in Ref. 38. In order to avoid air
    The flame was sprayed from the RSDT nozzle, which was fed                         infiltration, the bottles containing the electrolyte were pressurized
with a liquid solution of xylene (Fisher P/N: X5-20) and propane                     with N2.
(Airgas P/N: PR CP350DPS) as the fuel and ultra-zero grade air                           A potentiostat (Autolab PGSTAT 30® with 10 A booster module
(Airgas P/N: AI UZ300) as the oxidant. The flame was anchored at                      and SCAN250 module, DC potential accuracy ±0.2% f.s., DC
the RSDT nozzle by pilot flames fed with premixed oxygen (Airgas                      current accuracy ±0.5% f.s.) was used to perform cycling and
P/N: OX UHP 300) and methane (Airgas P/N: ME UHP300). As                             measure cell impedance at 50 frequencies distributed logarithmically
seen in Fig. 1, the flame was enclosed in the “primary shroud,”                       between 100 kHz and 1 Hz.
which limited the amount of ambient air entrained. This was
essential for maintaining the correct stoichiometry for the formation                    Experimental tests.—Two different types of charge-discharge
of the carbon-rich particles in the flame. The flame was cooled by an                  cycles were performed.36 In both cycle types, after each charge and
annulus of compressed air from a component called the “air                           discharge step, the cell was kept at open circuit for 90 s in order to
quench.” The air quench cooled the carbon-rich particles in the                      acquire both cell open-circuit voltage (OCV) and electrode open
flame, which prevented the oxidation of the particles and limited                     circuit potentials (OCP)b for the evaluation of battery SoC and the
particle growth before the particles reached the membrane.                           SoC of each electrolyte. These quantities were then used to detect
Additionally, the air quench cooled the gases in the flame suffi-                      and monitor electrolyte imbalance. The correlation between elec-
ciently such that the membrane was not exposed to too high a                         trode open circuit potentials and the corresponding SoC was derived
temperature during the barrier fabrication. Immediately downstream                   experimentally in a previous publication by the authors,36 in which
from the air quench, the methanol-based mixture of Nafion® and                        the shape of the obtained curves is consistent with Nernst’s law. In
Vulcan® (Nafion®-to-Vulcan® weight ratio of 2:1) was injected into                    particular, the negative electrode OCP at SoC 100% and 0% are
the gas stream from the secondary nozzles in the “quench shroud.”                    −0.433 V vs RHE and −0.174 V vs RHE, respectively; while for the
The carbon-rich particles from the flame mixed with the Nafion® and                    positive electrode, OCPs equal to 1.282 V vs RHE and 0.981 V vs
Vulcan® in the quench shroud. The air from the air quench directed                   RHE correspond to a SoC of 100% and 0%.
this mixture onto the membrane. After the above-mentioned barrier                        The first type of cycling test consisted of 40 cycles, in which the
manufacturing, the membranes were implemented in VRFB tests                          same capacity was imposed during charge and discharge: in this
without further processing.                                                          way, a variation of battery and electrolytes SoC can be caused only
                                                                                     by vanadium cross-over. The charging step was performed with a
   SEM and TEM analysis of barrier layer.—Plan-view images of                        current density of 40 mA cm−2 for 3750 s (charged capacity 1.04
the barrier layer were taken with SEM. SEM images are secondary                      Ah). The low value of the current density was set to permit the
electron images taken using a FEI Quanta FEG scanning electron                       utilization of nearly 40% of the ideal battery capacity and to avoid
microscope with an ETD detector in high vacuum mode. SEM                             the occurrence of side reactions. The discharge step was performed
  a
                                                                                     with a current density of 100 mA cm−2 in the first 25 cycles
      University of Connecticut is currently working on a project with the U.S.
                                                                                       b
      Department of Energy, in which catalyst-coated membranes for proton exchange         In open circuit, since the reaction overpotentials are null, the measured OCP vs
      membrane water electrolyzers with a planform of 711 cm2 are fabricated using         RHE at the positive and negative electrodes corresponds to the relative electrolyte
      RSDT.                                                                                potential (i.e., SoC).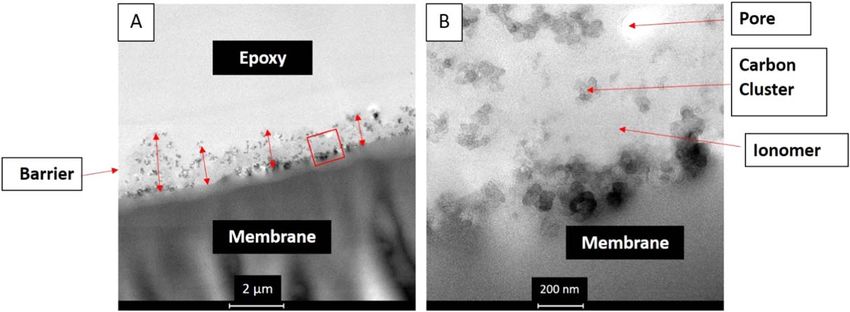
Journal of The Electrochemical Society, 2020 167 130535

Figure 1. Diagram of the RSDT process used for depositing the barrier directly onto the membrane. Not to scale.

                                                                               (discharge step duration 1500 s, discharged capacity 1.04 Ah), while
                                                                               the remaining 15 cycles were performed with a current density of
                                                                               50 mA cm−2 (discharge step duration 3000 s, discharged capacity
                                                                               1.04 Ah). The discharge current density was decreased after 25
                                                                               cycles to tackle the continuous increase of positive and negative
                                                                               electrode overpotentials induced by electrolyte imbalance. The
                                                                               electrolyte volume during this series of cycles was 100 ml.
                                                                                   The second type of cycling test was used to evaluate barrier
                                                                               stability over time and consisted of 250 cycles at constant current
                                                                               (50 mA cm−2), in which upper and lower voltage limits were 1.65 V
                                                                               and 1 V, respectively. In this type of test, voltage losses increase
                                                                               with cycling due to a combined effect of electrodes degradation and
                                                                               electrolyte imbalance induced by crossover,27 resulting in the
                                                                               reduction of capacity with cycling. For this reason, at the end of
                                                                               the 250th cycle, electrodes were substituted with new ones to
                                                                               decouple the degradation effect and evaluate the impact of electro-
                                                                               lyte imbalance on battery performance. The electrolyte volume
                                                                               during this series of cycles was 50 ml.
                                                                                   Impedance spectra were measured to determine high frequency
                                                                               resistance (HFR).

                                                                                                      Results and Discussion
                                                                                   Ex- situ characterizations.—Figure 3 shows plan-view SEM
                                                                               images of the barrier layer at two different magnifications. Both
                                                                               images are centered at the same point. The web-like structures are
                                                                               likely a result of the relatively high Nafion® content in the mixture
                                                                               sprayed from the secondary nozzles, which has been reported by Yu
                                                                               et al. when spraying similar mixtures for electrodes for proton
                                                                               exchange membrane fuel cells.27
                                                                                   Figures 4 and 5 show TEM images of a cross-section of the
                                                                               barrier layer prepared by a microtome as described the experimental
                                                                               section. Figure 4a shows the entire thickness of the barrier layer in
                                                                               BF. There is a variation in the thickness throughout the image with
Figure 2. Schematic representation of the experimental set-up.                 an average thickness of approximately 2 μm. This is consistent with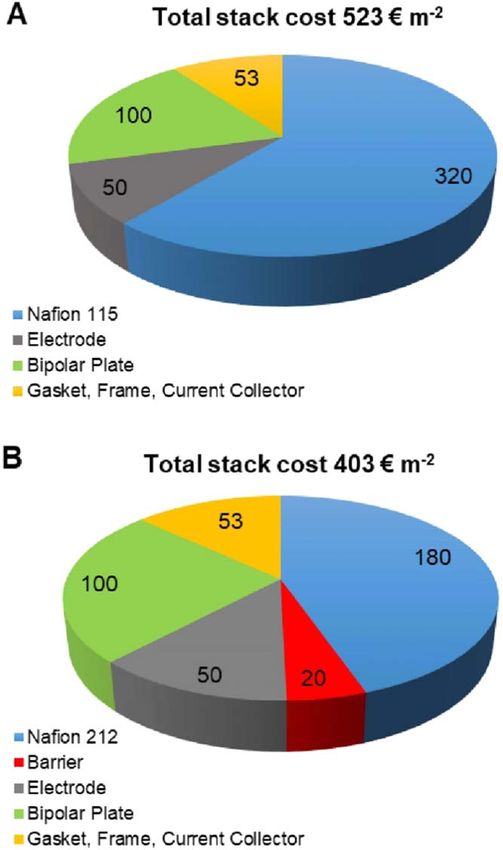
Journal of The Electrochemical Society, 2020 167 130535

Figure 3. Representative plan-view secondary-electron SEM images of the barrier layer at different magnifications taken using a FEI Quanta FEG instrument.
Both images are centred at the same point.

Figure 4. Bright Field TEM images of the barrier layer cross-section prepared by microtome taken using a Talos TEM: (a) low magnification showing the entire
thickness of the barrier layer, which is indicated by red arrows at multiple locations along the sample; (b) higher magnification image of the barrier at a location
approximated by the red box in Fig. 4a.

the cross-sectional thicknesses of many other barrier samples made                  the images in Fig. 4. In Fig. 5, the carbon features appear as bright
to the same specifications and measured by SEM. The darker spots                     spots. In Fig. 5a, the barrier is roughly 2 μm thick toward the middle
in the barrier layer in Fig. 4a are clusters of carbon particles.                   of the image with two large bubbles filled with void space on either
Figure 4b shows a higher magnification BF image of the selected                      side. These bubbles can be associated with the surface roughness
area in Fig. 4a. Clusters of individual carbon particles can be seen.               seen in the SEM images in Fig. 3. HAADF images at higher
The carbon particles in most of these clusters are roughly the size of              magnification are taken at the 2 μm-thick portion of the barrier layer.
the Vulcan® particles (∼40 nm). The grey background in Fig. 4b is                   In Figs. 5c and 5d, it can be seen that there are carbon features of two
the Nafion® ionomer. The lighter spot toward the top-right of Fig. 4b                distinct sizes. The larger carbon clusters in Fig. 5c are roughly the
surrounded by the grey ionomer is a closed pore approximately                       same size as the carbon clusters in Fig. 4b. In Fig. 5d, individual
100 nm in diameter in the barrier layer. This pore is not intended to               carbon particles roughly 40 nm in diameter can be seen in the larger
influence vanadium/proton selectivity; it is an artifact of the barrier              clusters; these 40 nm particles are predominantly Vulcan®. In
layer fabrication process. Pores that would influence vanadium/                      Figs. 5c–5d, the smaller carbon features approximately 10 nm in
proton selectivity are ∼5 nm in diameter and are not resolved in                    diameter consist of carbon-rich particles from the flame; Vulcan®
these TEM images. This 100 nm pore is open in the direction parallel                does not contain 10 nm particles. The carbon-rich particles from the
to the plane of the membrane, which is likely the result of the fact                flame are more evident in Figs. 5c–5d than in Fig. 4b because
that the thickness of the cross-sectional sample cut by microtome                   HAADF images have stronger contrast than bright-field images. The
(see experimental section) is on the same order of magnitude as the                 unique barrier layer morphology achieved by the mixture of Vulcan®
diameter of the pore. The pore is likely roughly spherical with a                   and carbon-rich particles from the flame creates a tortuous path for
diameter of approximately 100 nm with this cross-section bisecting                  the transport of ions through the membrane, which improves
the pore. Even so, Fig. 4b shows that the pore is closed in the                     vanadium/proton selectivity. The effectiveness of the barrier layer
direction orthogonal to the plane of the membrane, which is the                     for VRFBs is demonstrated in the next section.
direction of interest for blocking vanadium crossover.
    Figure 5 shows a series of HAADF images at increasing                               Electrochemical characterization.—The barrier layer has been
magnification clockwise from top-left at a different location from                   tested at the positive and the negative sides of the cell in separate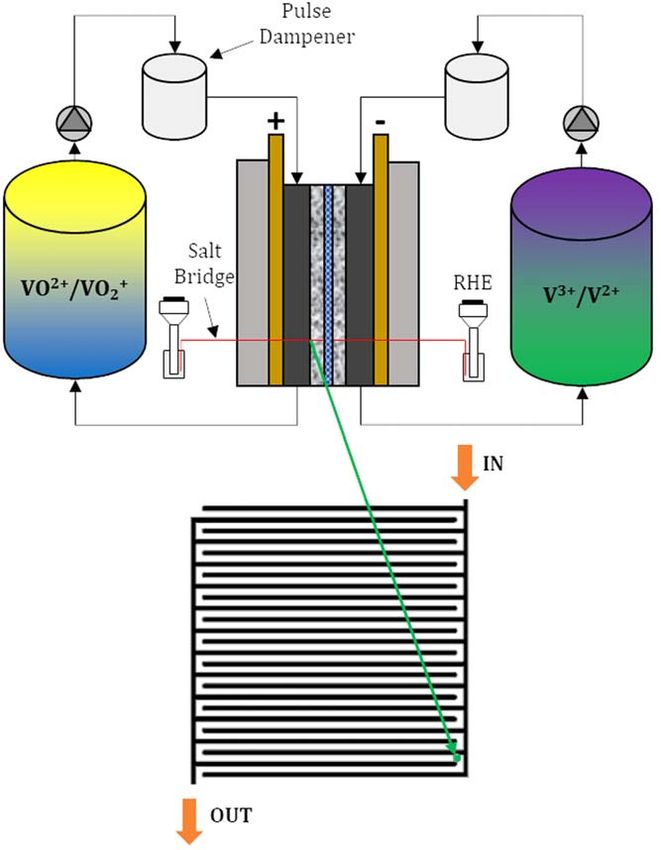
Journal of The Electrochemical Society, 2020 167 130535

Figure 5. HAADF TEM images of the barrier layer cross-section prepared by microtome taken on a Talos TEM. Magnification increases clockwise from top-left
with red boxes indicating locations of progressively higher magnifications.

tests. Figure 6 reports the results of the reference VRFB, which                               with the barrier layer. Considering the electrolyte imbalance in the
contains Nafion® 115, and a VRFB with the barrier at the negative                               investigated operating conditions, the positive electrolyte undergoes
side during the first type of cycle with the same capacity during the                           higher variation of SoC (Fig. 6b) compared to the negative
charge and discharge steps. The results of the VRFB with the barrier                           electrolyte (Fig. 6c). The presence of the barrier layer is effective
layer at the positive side have been omitted for the sake of figure                             for both electrolytes; the average variation of positive electrolyte
readability; they are analogous to those with the barrier at the                               SoC is reduced from 24% to 9%, while the average variation of
negative side.                                                                                 negative electrolyte SoC is reduced from 16% to 5%.
    Figure 6a shows the battery SoC during a typical cycle. It is                                 The presence of the barrier layer limits electrolyte imbalance
worth noting that although the membrane consisting of the barrier                              without a significant impact on membrane HFR, which slightly
layer and Nafion® 212 is thinner than Nafion®115, the former                                     increases from 425 mΩ cm2 to 450 mΩ cm2. Despite the slightly
produces a significant reduction of battery self-discharge. This                                higher HFR, the battery with the barrier layer has energy efficiency
suggests that the barrier layer has significantly lower vanadium-ion                            ∼5% higher than the reference battery with Nafion® 115, as depicted
permeability than bare Nafion® membranes. In particular, the                                    in Fig. 6dd. Thus, in the investigated operating conditions, battery
average variationc of battery SoC between the beginning and the                                voltage losses are more affected by cross-over than by ohmic losses
end of the test is 21% for the baseline cell and only 7% for the cell
                                                                                                 d
                                                                                                     The efficiency gap at cycle 25 is due to the change in current density during the
                                                                                                     discharge step, which was reduced from 100 mA cm−2 to 50 mA cm−2.
  c
      The average variation of battery SoC is evaluated as the average of following: the             Considering the adopted cell configuration and operating conditions, 100 mA cm−2
      difference between the battery SoC at the end of the 1st and 40th charge steps, and            is considered a relatively high operating current, since the resulting energy
      the difference between the battery SoC at the end of the 1st and 40th discharge steps.         efficiency without the barrier is already lower than 80%.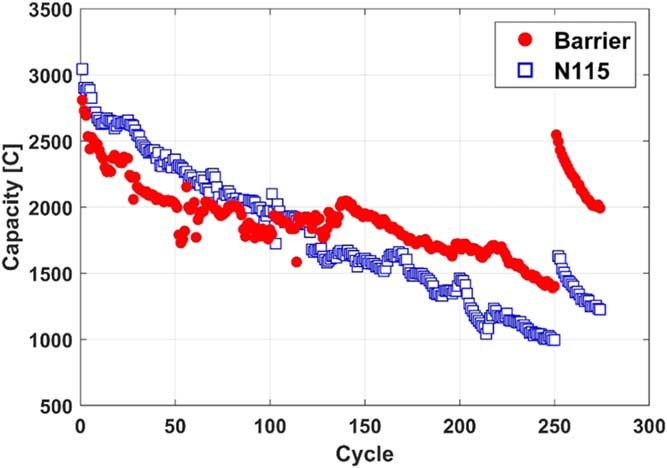
Journal of The Electrochemical Society, 2020 167 130535

                                                                                   Figure 7. Evolution of discharged capacity during cycles with fixed cut-off
                                                                                   voltages.

Figure 6. A typical charge/discharge cycle showing: (a) battery SoC; (b)
positive electrolyte SoC; (c) negative electrolyte SoC; (d) energy efficiency.

through the membrane.11 The HFR associated to the barrier itself is
estimatede to be around 200 mΩ cm2, which results in a 1% energy
efficiency lossf. This confirms that the impact of the barrier layer on
battery voltage losses is minor.
    Finally, barrier stability was evaluated during 250 cycles at
50 mA cm−2 with fixed cut-off voltages. Figure 7 reports the
discharged capacity with both the barrier and Nafion® 115. The
battery with the barrier initially exchanged a lower capacity (2809 C)
because in this operating condition its energy efficiency (82% at 1st
cycle) was slightly lower compared to the battery with Nafion® 115
(84% at 1st cycle). However, the coulombic efficiency of the VRFB                   Figure 8. Stack cost breakdown: (a) VRFB with Nafion® 115; (b) VRFB
                                                                                   with Nafion® 212 and barrier.
with the barrier was higher and stable during cycling: the mean
coulombic efficiency with the barrier was 99.4%, while with Nafion®                  115 it was around 98.5%. This behavior resulted in a lower capacity
   e                                               2                               loss with cycling for the VRFB with the barrier: at the 250th cycle
       Calculated as the difference between 450 mΩ cm and the HFR of bare Nafion®
       212.                                                                        the capacity lossg was 50% and 67% for VRFB with the barrier and
   f
       The efficiency loss was referred to the first cycle.                            g
                                                                                         Calculated with respect to the value at the 1st cycle.
Journal of The Electrochemical Society, 2020 167 130535
Nafion® 115, respectively. As reported in Ref. 27, the capacity loss ORCID
occurring in this type of cycling test results from the complex
Marco Cecchetti https://orcid.org/0000-0002-5605-9920
interplay between electrode degradation and electrolyte imbalance
Matteo Zago https://orcid.org/0000-0002-0542-1459
due to crossover. Thus, in order to highlight the effect of electrolyte
imbalance on battery performance after 250 cycles, new electrodes References
were used at the 251st cycle. After the substitution of the electrodes,
the exchanged capacity of the battery with the barrier was restored to 1. P. Alotto, M. Guarnieri, and F. Moro, “Redox flow batteries for the storage of
renewable energy: a review.” Renew. Sustain. Energy Rev., 29, 325-335 (2014).
2550 C (91% of its original value), while in the case of the battery 2. G. L. Soloveichik, “Flow batteries: current status and trends.” Chem. Rev., 115,
with Nafion® 115, the capacity was restored to 1650 C (54% of its 11533 (2015).
original value). This result confirmed that the developed barrier was 3. A. Parasuraman, T. M. Lim, C. Menictas, and M. Skyllas-Kazacos, “Review of
stable with cycling and was able to significantly reduce the capacity material research and development for vanadium redox flow battery applications.”
Electrochim. Acta, 101, 27 (2013).
loss of the battery due to crossover. 4. A. Z. Weber, M. M. Mench, J. P. Meyers, P. N. Ross, J. T. Gostick, and Q. Liu,
“Redox flow batteries: a review.” J. Appl. Electrochem., 41, 1137 (2011).
Preliminary cost analysis.—Figure 8 reports the stack cost 5. X. G. Yang, Q. Ye, P. Cheng, and T. S. Zhao, “Effects of the electric field on ion
breakdown of a VRFB with Nafion® 115 (Fig. 8a) as the membrane crossover in vanadium redox flow batteries.” Appl. Energy, 145, 306 (2015).
6. Y. Zhang, L. Liu, J. Xi, Z. Wu, and X. Qiu, “The benefits and limitations of
and a VRFB with the barrier layer deposited on Nafion® 212 electrolyte mixing in vanadium flow batteries.” Appl. Energy, 204, 373 (2017).
(Fig. 8b) as the membrane. The cost of Nafion® 115 and Nafion® 212 7. Y. Lei, B. W. Zhang, Z. H. Zhang, B. F. Bai, and T. S. Zhao, “An improved model
are assumed to be respectively 80% and 45%39 of the cost of of ion selective adsorption in membrane and its application in vanadium redox flow
Nafion® 117, which is estimated to be 400 € m−2.40,41 The barrier batteries.” Appl. Energy, 215, 591 (2018).
8. R. M. Darling, A. Z. Weber, M. C. Tucker, and M. L. Perry, “The influence of
layer has a manufacturing cost of approximately 20 € m−2. The cost electric field on crossover in redox-flow batteries.” J. Electrochem. Soc., 163,
of barrier layer manufacture assumes that 75% of the fabricated A5014 (2015).
material is collected on the membrane, and is estimated based on raw 9. T. Lagarteira, P. Pacheco, C. Almeida, A. Bentien, R. Monteiro, and A. Mendes,
materials costs (Vulcan®, Nafion®, solvents, and gases) and elec- “In-Situ measurement of vanadium crossover for the vanadium redox flow battery.”
J. Electrochem. Soc., 166, A4067 (2019).
trical power input. The costs associated with electrodes, current 10. J. T. Vardner, J. E. Soc, J. T. Vardner, J. S. Edziah, and A. C. West, “Measurement
collectors, and bipolar plates have been taken from Minke et al.,42 of VO 2+ transference number in nafion with varying concentrations of sulfuric
while costs of frame and gaskets are estimated from Viswanathan et acid measurement of VO2+ transference number in nafion with varying concentra-
al.43 It is worth noting that the membrane represents a significant tions of sulfuric acid.” J. Electrochem. Soc., 166, A848 (2019).
11. M. Pugach, V. Vyshinsky, and A. Bischi, “Energy efficiency analysis for a kilo-watt
share of the specific stack cost, as already shown in the class vanadium redox flow battery system.” Appl. Energy, 253, 113533 (2019).
literature.42–45 This share of the cost can be reduced by employing 12. A. Trovò, F. Picano, and M. Guarnieri, “Comparison of energy losses in a 9 kW
a thinner membrane. Specifically, the total estimated cost of VRFB vanadium redox flow battery.” J. Power Sources, 440, 227144 (2019).
stacks using the barrier layer with Nafion® 212 is reduced by nearly 13. B. Jiang, L. Wu, L. Yu, X. Qiu, and J. Xi, “A comparative study of Nafion series
membranes for vanadium redox flow batteries.” J. Memb. Sci., 510, 18 (2016).
30% compared to the Nafion® 115 standard. 14. Y. Shi, C. Eze, B. Xiong, W. He, H. Zhang, T. M. Lim, A. Ukil, and J. Zhao,
“Recent development of membrane for vanadium redox flow battery applications: a
Conclusions review.” Appl. Energy, 238, 202 (2019).
15. L. Zeng, T. S. Zhao, L. Wei, H. R. Jiang, and M. C. Wu, “Anion exchange
This work reports on the manufacturing and testing of an membranes for aqueous acid-based redox flow batteries: current status and
innovative barrier layer to mitigate vanadium-ion crossover in challenges.” Appl. Energy., 233–234, 622 (2019).
VRFBs. The concept of the barrier layer is described in the patent 16. J. Dai, Y. Dong, P. Gao, J. Ren, C. Yu, H. Hu, Y. Zhu, and X. Teng, “A sandwiched
bipolar membrane for all vanadium redox flow battery with high coulombic
application WO 2019/197917. The barrier layer was deposited efficiency.” Polymer (Guildf)., 140, 233 (2018).
directly onto Nafion® 212 using the Reactive Spray Deposition 17. L. Yu, F. Lin, L. Xu, and J. Xi, “A recast Nafion/graphene oxide composite
Technology process. The barrier layer has an average thickness of membrane for advanced vanadium redox flow batteries.” RSC Adv., 6, 3756 (2016).
approximately 2 μm and is composed of ionomer and carbon clusters 18. H. Zhang, H. Zhang, X. Li, Z. Mai, and W. Wei, “Silica modified nanofiltration
membranes with improved selectivity for redox flow battery application.” Energy
of two distinct sizes. Larger carbon clusters are predominantly made Environ. Sci., 5, 6299 (2012).
of Vulcan® particles, while the smaller ones, approximately 10 nm in 19. L. Su, D. Zhang, S. Peng, X. Wu, Y. Luo, and G. He, “Orientated graphene oxide/
diameter, consist of carbon-rich particles from the RSDT flame. Nafion ultra-thin layer coated composite membranes for vanadium redox flow
During cycles at fixed capacity, the presence of the barrier layer battery.” Int. J. Hydrogen Energy, 42, 21806 (2017).
20. J. Kim, J. D. Jeon, and S. Y. Kwak, “Nafion-based composite membrane with a
significantly reduced battery self-discharge induced by crossover; permselective layered silicate layer for vanadium redox flow battery.” Electrochem.
the average variation of battery SoC between beginning-of-test and Commun., 38, 68 (2014).
end-of-test was 7% with barrier layer, while without the barrier layer 21. C. Wu, S. Lu, J. Zhang, and Y. Xiang, “Inducing microstructural changes in Nafion
it was 21%. This is further confirmed by the variation of SoC of both by incorporating graphitic carbon nitride to enhance the vanadium-blocking effect.”
Phys. Chem. Chem. Phys., 20, 7694 (2018).
the positive and negative electrolytes. Moreover, the barrier layer 22. S. S. Sha’rani, E. Abouzari-Lotf, M. M. Nasef, A. Ahmad, T. M. Ting, and R.
does not significantly hinder proton transport, resulting in ∼5% R. Ali, “Improving the redox flow battery performance of low-cost thin polyelec-
higher battery energy efficiency than the standard cell with Nafion® trolyte membranes by layer-by-Layer Surface assembly.” J. Power Sources, 413,
115. During cycles at 50 mA cm−2 with fixed cut-off voltages, the 182 (2019).
23. W. Dai, Y. Shen, Z. Li, L. Yu, J. Xi, and X. Qiu, “SPEEK/Graphene oxide
barrier layer exhibited stable operation, maintaining a coulombic nanocomposite membranes with superior cyclability for highly efficient vanadium
efficiency of nearly 99.4%. Additionally, the adoption of the barrier redox flow battery.” J. Mater. Chem. A., 2, 12423 (2014).
layer projects to a 30% reduction of stack specific cost compared to 24. C. Jia, Y. Cheng, X. Ling, G. Wei, J. Liu, and C. Yan, “Sulfonated poly(Ether Ether
the Nafion® 115 standard. Ketone)/functionalized carbon nanotube composite membrane for vanadium redox
flow battery applications.” Electrochim. Acta, 153, 44 (2015).
The optimization of the barrier layer composition, along with the 25. J. Xi, Z. Wu, X. Teng, Y. Zhao, L. Chen, and X. Qiu, “Self-assembled
analysis of different and thinner support compared to Nafion® 212, polyelectrolyte multilayer modified Nafion membrane with suppressed vanadium
will be performed in future work. ion crossover for vanadium redox flow batteries.” J. Mater. Chem., 18, 1232 (2008).
26. X. Wei, Z. Nie, Q. Luo, B. Li, B. Chen, K. Simmons, V. Sprenkle, and W. Wang,
“Nanoporous polytetrafl uoroethylene/silica composite separator as a high-perfor-
Acknowledgments mance all-vanadium redox flow battery membrane.” Adv. Energy Mater., 3, 1215
(2013).
This work was funded by ENI S.p.A. in the framework of the 27. H. Yu, J. M. Roller, W. E. Mustain, and R. Maric, “Influence of the ionomer/carbon
research project entitled: “Batterie a flusso al vanadio innovative” ratio for low-Pt loading catalyst layer prepared by reactive spray deposition
(OdL 4310296114 of 06/09/2018). technology.” J. Power Sources, 283, 84 (2015).Journal of The Electrochemical Society, 2020 167 130535
28. H. Yu, A. Baricci, A. Bisello, A. Casalegno, L. Guetaz, L. Bonville, and R. Maric, 37. M. Cecchetti, M. Messaggi, A. Donazzi, A. Facibeni, V. Russo, C. S. Casari, A.
“Strategies to mitigate Pt dissolution in low Pt loading proton exchange membrane L. Bassi, A. Casalegno, and M. Zago, “Electrochimica Acta A combined
fuel cell: I. A gradient Pt particle size design.” Electrochim. Acta, 247, 1155 morphological and electrochemical characterization of carbon electrodes in
(2017). vanadium redox flow batteries: insights into positive and negative electrode
29. H. Yu, A. Baricci, A. Casalegno, L. Guetaz, L. Bonville, and R. Maric, “Strategies performance.” Electrochim. Acta, 329, 135143 (2020).
to mitigate Pt dissolution in low Pt loading proton exchange membrane fuel cell: II. 38. D. S. Aaron, Q. Liu, Z. Tang, G. M. Grim, A. B. Papandrew, A. Turhan, T.
A gradient Pt loading design.” Electrochim. Acta, 247, 1169 (2017). A. Zawodzinski, and M. M. Mench, “Dramatic performance gains in vanadium
30. H. Yu, E. S. Davydova, U. Ash, H. A. Miller, L. Bonville, D. R. Dekel, and redox flow batteries through modified cell architecture.” J. Power Sources, 206, 450
R. Maric, “Palladium-ceria nanocatalyst for hydrogen oxidation in alkaline media: (2012).
optimization of the Pd–CeO 2 interface.” Nano Energy., 57, 820 (2019). 39. A. Crawford, V. Viswanathan, D. Stephenson, W. Wang, E. Thomsen, D. Reed,
31. R. Jain, Y. Lei, and R. Maric, “Ultra-low NO2 detection by gamma WO3 B. Li, P. Balducci, M. Kintner-meyer, and V. Sprenkle, “Comparative analysis for
synthesized by reactive spray deposition technology.” Sensors Actuators, B various redox flow batteries chemistries using a cost performance model.” J. Power
Chem., 236, 163 (2016). Sources, 293, 388 (2015).
32. R. Maric, J. Roller, and R. Neagu, “Flame-based technologies and reactive spray 40. C. Minke and T. Turek, “Materials, system designs and modelling approaches in
deposition technology for lowerature solid oxide fuel cells: technical and economic techno-economic assessment of all-vanadium redox flow batteries—a review.”
aspects.” J. Therm. Spray Technol., 20, 696 (2011). J. Power Sources, 376, 66 (2018).
33. P. C. Ghimire, A. Bhattarai, R. Schweiss, G. G. Scherer, N. Wai, and Q. Yan, “A 41. M. Skyllas-Kazacos, “Performance improvements and cost considerations of the
comprehensive study of electrode compression effects in all vanadium redox flow vanadium redox flow battery.” ECS Trans., 89, 29 (2020).
batteries including locally resolved measurements.” Appl. Energy, 230, 974 (2018). 42. C. Minke and M. A. Dorantes Ledesma, “Impact of cell design and maintenance
34. A. M. Pezeshki, R. L. Sacci, F. M. Delnick, D. S. Aaron, and M. M. Mench, strategy on life cycle costs of vanadium redox flow batteries.” J. Energy Storage.,
“Elucidating effects of cell architecture, electrode material, and solution composi- 21, 571 (2019).
tion on overpotentials in redox flow batteries.” Electrochim. Acta, 229, 261 (2017). 43. V. Viswanathan et al., “Cost and performance model for redox flow batteries.”
35. M. Zago and A. Casalegno, “Physically-based impedance modeling of the negative J. Power Sources, 247, 1040 (2014).
electrode in All-Vanadium Redox flow batteries: insight into mass transport issues.” 44. S. Kim et al., “1 kW/1 kWh advanced vanadium redox flow battery utilizing mixed
Electrochim. Acta, 248, 505 (2017). acid electrolytes.” J. Power Sources, 237, 300 (2013).
36. M. Cecchetti, A. Casalegno, and M. Zago, “Local potential measurement through 45. C. Minke, U. Kunz, and T. Turek, “Techno-economic assessment of novel
reference electrodes in vanadium redox flow batteries: evaluation of overpotentials vanadium redox flow batteries with large-area cells.” J. Power Sources, 361, 105
and electrolytes imbalance.” J. Power Sources, 400, 218 (2018). (2017).You can also read