Auctions for Renewable Support in the United Kingdom: Instruments and lessons learnt
←
→
Page content transcription
If your browser does not render page correctly, please read the page content below
Report D4.1-UK, April 2016

Auctions for Renewable
Support in the United Kingdom:
Instruments and lessons learnt

About the project

Auctions for Renewable Energy Support: Effective use and efficient implementation options (AURES)

This project helps assessing the applicability of different auction types to renewable support under different market
conditions. It also explores which auction types and design specifications suit particular requirements and policy
goals in European countries. By establishing best practices and a knowledge sharing network, we contribute to
informed policy decision-making and to the success of auction implementations across Europe.

Target-oriented analysis: Through analysis of empirical experiences, experiments and simulation, we will create a
flexible policy support tool that supports policy makers in deciding on the applicability of auction types and certain
design specifications for their specific situation.

Capacity building activities: We undertake specific implementation cases to derive best practices and trigger
knowledge sharing amongst Member States. We strive to create a strong network with workshops, webinars,
bilateral meetings, newsletters, a website that will serve as capacity building platform for both policy makers and
market participants (including project developers, auctioneers, etc.). Wherever required, we can set up specific
bilateral and multilateral meetings on specific auction issues and facilitate cooperation and knowledge sharing.
Additionally, we offer sparring on specific implementation options, drawing from insights gained during the first
phases of the project (empirical analysis of previous auctions in Europe and the world), conceptual and theoretical
analysis on the applicability of specific designs in certain market conditions and for certain policy goals issues and
facilitate cooperation and knowledge sharing. Additionally, we offer sparring on specific implementation options,
drawing from insights gained during the first phases of the project (empirical analysis of previous auctions in
Europe and the world), conceptual and theoretical analysis on the applicability of specific designs in certain market
conditions and for certain policy goals.

Project consortium: eight renowned public institutions and private firms from five European countries and
combines some of the leading energy policy experts in Europe, with an impressive track record of successful
research and coordination projects.
This report deals with the CfD auction, which was introduced to allocated contracts to
renewable electricity projects in the UK in 2014.
The report contributes to the first and second of three tasks in work package 4 of the
AURES project:

T4.1    Providing a characterisation of the different auctions
T4.2    Making an assessment of auctions and case-specific lessons learnt
T4.3    Interpreting and summarising the general lessons learnt and resulting and thereby
outline specific recommendations

For further information please contact: Oscar W Fitch-Roy (o.fitch-roy@exeter.ac.uk) or
Bridget Woodman (b.woodman@exeter.ac.uk)

Report D4.1-UK, April 2016
Auctions for Renewable Support in the United Kingdom: Instruments and
Lessons Learnt
Authors: Oscar W Fitch-Roy and Bridget Woodman (University of Exeter)
Reviewed by:
Sonja Förster (Ecofys)
Project deliverable:
WP4 - Empirical aspects of auctions for RES-E: Learning from real experiences.
Task 4.1 Characteristics of auctions

                                                                                            3
Table of contents
1. Characteristics of auctions in the United Kingdom....................................................................................... 5
Design elements for the assessment of auction schemes for RES-E ........................................................... 11
2. Evaluation criteria for the assessment of auction schemes for RES-E ...................................................... 18
Actor variety and social acceptability ............................................................................................................. 18
Policy effectiveness (effectiveness of auctions) ............................................................................................ 18
Static efficiency or cost effectiveness (including transaction and administrative costs) ................................ 19
Dynamic efficiency ......................................................................................................................................... 21
Compatibility with market principles and integration ...................................................................................... 22
Distributional effects & minimisation of support costs .................................................................................... 22
3. Lessons learnt: key best practices and pitfalls identified ........................................................................... 23
References ........................................................................................................................................................ 24
Figures
Figure 1: UK installed renewable electricity capacity (MW)(Source: Digest of UK Energy Statistics) ................ 5
Figure 2: Roles and responsibilities for CfD auction administration .................................................................... 7
Figure 3: Functioning of the CfD ........................................................................................................................ 10
Figure 4: CfD auction decision tree (DECC, 2014a) ......................................................................................... 13
Figure 5: Illustrative Auction Results ................................................................................................................. 14
Figure 6: Budget versus total spend .................................................................................................................. 18
Figure 7: Pot 1 auction results and ceiling prices of winning technologies ....................................................... 20
Figure 8: Pot 2 auction results and ceiling prices of winning technologies ....................................................... 21
Figure 9: Capacity allocation by technology across both technology groups.................................................... 21
Figure 10: Capacity allocated by technology and delivery year ........................................................................ 22
Figure 11 Geographical distribution of CfDs ..................................................................................................... 22
Tables
Table 1: CfD auction results (Source: DECC, 2015b) ......................................................................................... 8
Table 2: CfD 1 allocation round auction timeline ................................................................................................. 9
Table 3: CfD budget allocation 2015/16-2020/21 (£bn) (Source: DECC, 2014c) ..........Fejl! Bogmærke er ikke
defineret.
Table 4: Budget available for the first CfD auction (Davey, 2014; 2015) .......................................................... 10
Table 5: Administrative strike prices (ceiling prices) by technology type and year (2011/12 prices) (Source:
DECC, 2013b) ................................................................................................................................................... 15
4Table 6: Auction outturn prices (National Audit Office, 2014; DECC, 2015a) ................................................... 19
1. Characteristics of auctions in the United Kingdom
Table 1. Characterisation of auctions
Characteristics Description
Country The UK has a population of ca. 64 million and in 2014 its final energy consumption was
characteristics 143 Mtoe. Electricity made up 18.5% of the UK’s final energy consumption
(26Mtoe/339TWh).
The UK enjoys a location on the windy Atlantic fringe of Europe and has excellent
renewable energy resources. Under EU Directive 2009/28/EC, the UK is bound to meet
15% of energy consumption across all sectors from renewable sources by 2020 which
translates to approximately 30% in the electricity sector (DECC, 2009).
In 2014, renewables accounted for just under 20% of electricity generation, and overall
renewables supplied 7.8% of final energy consumption (DECC, 2015c). On the basis of
current performance, the UK may not meet its EU commitments – recent leaked emails
from the Department of Energy and Climate Change projected that the UK might miss its
1
target by around 3.5% .
The UK currently has 4GW of interconnection capacity with France, the Republic of
Ireland, Northern Ireland and the Netherlands. More are planned in the future, possibly
to Belgium, Norway, France and Denmark, meaning that the UK could become
increasingly integrated into the wider European electricity network.
12.000,0
10.000,0
8.000,0
6.000,0
4.000,0
2.000,0
-
1990 1995 2000 2005 2010
Onshore wind Offshore wind Wave and tidal
PV Small hydro Large hydro
Landfill gas Sewage sludge digestion Energy from waste
Animal biomass Plant biomass Anaerobic digestion
1
http://www.theecologist.org/_download/398070/amber-rudd-letters-ecologist.pdf
5Characteristics Description
Figure 1: UK installed renewable electricity capacity (MW)(Source: Digest of UK Energy Statistics)
Market The UK has liberalised electricity generation and retail markets. However, despite some
characteristics recent trends increases in independent electricity supply, electricity generation and
supply in the UK remain dominated by six vertically integrated firms often referred to as
the Big Six. Together, the Big Six account for more than 90% of domestic electricity
supply and own approximately 70% of the UK’s generation capacity. They also dominate
non-domestic electricity supply (Ofgem, 2015).
Renewable electricity has been supported since 1990. The Non Fossil Fuel Obligation
(auction) ran from 1990 – 1998. This was replaced by the Renewables Obligation (RO)
(quota) in 2002. Large scale solar (>5MW) have been excluded from RO support since
April 2015. Onshore wind will be excluded from April 2016. The RO will expire for all
other technologies in 2017. Its replacement - the Contracts for Difference scheme - is an
auction mechanism, and the first round of bidding took place in late 2014, with the
results announced in February 2015.
Name of auction Contracts for Different (CfDs), part of a wider Electricity Market Reform package.
scheme
Objectives The objectives of the CfD auction are closely linked to the Electricity Market Reform
(EMR) process started by the UK Government in 2009 and which aimed to deliver the
three familiar objectives of ensuring security of supply, decarbonising the electricity
system and doing so at least cost to consumers.
The original policy objectives of the CfD auctions were primarily to introduce competition
within technology groups as a means of limiting producer surplus. There is an intention
to move towards technology neutrality in the future (unspecified date) (DECC, 2011).
Contracting Several bodies are involved in the administration and functioning of the CfD auctions.
authority The main government department in charge of the auction design and ultimate
responsibility for the auctions is the Department for Energy and Climate Change
(DECC).
Although the CfD contracts are funded entirely through a levy on consumers’ bills rather
than taxation, the Treasury has control over the budgetary implications of the auctions
through a tool known as the Levy Control Framework (LCF).
The running of the auctions (accepting bids, declaring awards etc.) along with other
elements related to the Energy Act 2013 is carried out by the electricity market reform
(EMR) Delivery Body, a position currently held by the TSO of Great Britain, National
Grid.
6Characteristics Description
Finally, the contracting counterparty is a newly formed statutory Government-owned
corporation known as the Low-Carbon Contracts Company (LCCC).
Sets annual budget caps
through the HM Treasury
LCF
Designs auctions,
instructs auction delivery
body to proceed - holds DECC
budgetary responsibility
Auctioneer - adminsters National Grid (EMR
allocation process
delivery body)
Acts as contract counter Low-Carbon Contracts
party for CfD
Company
Figure 2: Roles and responsibilities for CfD auction administration
Main features The CfD auctions are multi-unit, sealed-bid, uniform price auctions.
The system employs technology-specific ceiling prices known as ‘administrative strike
prices’ intended to represent similar investor returns to the previous support mechanism,
the Renewables Obligation (DECC, 2013a). It also allows for technology capacity
minima and maxima to be set.
Auctioned volumes are determined by strict budgetary constraints with some notable
features arising from the way the budgets are apportioned. Budgets are capped year-by-
year rather than the spending implications of the auction – in addition to meeting the
overall affordability criterion, a winning bid must not breach the budget cap for any of the
years for which a cap has been set.
Budgets for the first auction were divided into two ‘pots’, one for established
technologies, the other for less established technologies, effectively creating two
simultaneous auction processes.
The first pot, for established technologies, included onshore wind and solar, energy from
waste with CHP, hydro (5 - 50 MW), landfill gas and sewage gas. It consisted of £50m
(€64m) for projects commissioning from 2015/16, and an additional £15m (€19m) (i.e.
£65m (€83m) in total) for projects commissioning from 2016/17 onwards.
The second pot, for less established technologies, included offshore wind, biomass
7Characteristics Description
CHP, wave, tidal stream, advanced conversion technologies, anaerobic digestion and
geothermal. It consisted of £155m for projects commissioning from 2016/17 onwards,
and an additional £105m (i.e. £260m in total) for projects commissioning from 2017/18
onwards.
There is also a notional third pot, for biomass conversion. However, no budget was
allocated to this for the first auction, although it may be in future rounds
2
The results of the first allocation round are presented in Table 1 .
Table 1: CfD auction results (Source: DECC, 2015b)
Project Developer Technolog MW Strike Delivery Year
Name y Price
£(€)
BHEG BH EnergyGap Advanced 26 114.39 2018-2019
Walsall (Walsall) Ltd Conversion (146)
Technologie
s
Energy Energy Works (Hull) Advanced 25 119.89 2017-2018
Works (Hull) Limited Conversion (154)
Technologie
s
Enviroparks Enviroparks Advanced 11 119.89 2017-2018
Hirwaun Operations Ltd Conversion (154)
Generation Technologie
Site s
Wren Power Gent Fairhead & Co. Energy from 49.75 80 2018-2019
and Pulp Ltd Waste with (103)
CHP
K3 CHP Wheelabrator Energy from 45 80 2018-2019
Facility Technologies Waste with (103)
CHP
EA 1 ScottishPower Offshore 714 119.89 2017-20181
Renewables (UK) Wind (154)
Neart na Mainstream Offshore 448 114.39 2018-2019
Gaoithe Renewable Power Wind (146)
Dorenell Infinergy Onshore 177 82.5 2018-2019
Wind Farm Wind (106)
Kype Muir Banks Renewables Onshore 104 82.5 2018-2019
Wind Farm Wind (106)
Clocaenog RWE Innogy UK Onshore 96 82.5 2018-2019
Forest Wind Limited Wind (106)
Farm
Middle Muir Banks Renewables Onshore 60 82.5 2018-2019
Wind Farm Wind (106)
Brenig Wind Brenig Wind Limited Onshore 45 79.23 2016-2017
Farm – Wind (102)
Brenig Wind
Year of The first allocation process was launched in October 2014 with awards announced in
introduction February 2015.
2
https://www.gov.uk/government/uploads/system/uploads/attachment_data/file/407059/Contracts_for_Difference_-_Auction_Results_-_Official_Statistics.pdf
8Characteristics Description
Technology In addition to differentiating between mature and immature technologies (i.e. the
focus and established and less-established pots), the mechanism has separate budgetary
differentiation constraints for the two groups. This gives the ability to set a minimum capacity volume
for a particular technology, although the overall ceiling price still applies. It is also
possible to set a maximum level of capacity for a technology.
Lead time before There is a lengthy pre-qualification process. The actual allocation process for CfDs is
auction begun by the publication of an Allocation Round Notice by the Secretary of State (SoS)
for Energy. The start of the allocation round must be at least 10 working days after the
Notice is published. The allocation round closes a further 10 working days after that.
Bidders have one week between the auction notice and the submission deadline.
However, there are several stages to the process that occur over the preceding months
including a prequalification process which determines whether a project is eligible for the
auction process.
The timeline for the first allocation round is shown in Table 2.
Table 2: CfD 1 allocation round auction timeline
Milestone Date
Allocation Round Notice 29 Aug 14
DECC published final budget notice 2 Oct 14
Allocation round commenced 14 Oct 14
Application closing date 28 Oct 14
Eligibility Results Day 13 Nov 14
Deadline for applicants to raise a review of non-qualification By 20 Nov 14
Auction notice 28 Jan 15
Sealed bids submission closing date By 4 Feb 15
CfD notifications sent to Low Carbon Contracts Company 26 Feb 15
LCCC sends contracts to successful applicants By 12 Mar 15
Applicants sign and return CfDs By 27 Mar 15
Min. /max. size of The auctions are for projects with a capacity >5MW.
project
What is Auction winners are awarded a contract for difference (CfD), a financial instrument which
auctioned? guarantees additional revenue to those from selling power into the wholesale power
market. Addition payments per MWh are calculated as the difference between the
contract or ‘strike price’ and a measure of the wholesale market price known as the
‘reference price’ (Figure 4). The level of the contract strike price is determined in the
9Characteristics Description
auction. In instances where the wholesale power price is higher than the strike price, the
contract requires that the generator makes payments to the contract counterparty.
Price/MWh
Time
Electricity market revenues CfD topup
CfD payback Electricity price/reference price
Generation cost (Strike Price)
Figure 3: Functioning of the CfD
Budgetary CfDs are one of a series of mechanisms constrained by a Treasury limit known as the
expenditures per Levy Control Framework (LCF). The LCF is intended to restrict the aggregate amount of
auction and per money that suppliers can levy from consumers for low carbon electricity and the
year Capacity Mechanism. CfDs are contained within this overall LCF.
The budget available for the auction is announced by the SoS for Energy and Climate
Change in a budget notice ahead of the auction but not ahead of the call for applications.
The budget notice sets out the overall size of the budget per year and the breakdown by
technology group as well as the technologies in each group. Importantly, the budgets are
for total spending in each year, rather than for spending on projects which start
generating in a particular year.
The actual budget allocated to the different technology pots is show in Table 4.
Table 3: Budget available for the first CfD auction (Davey, 2014; 2015)
Budget £million (€) Delivery Year
2015/16 2016/17 2017/18 2018/19 2019/20 2020/21
Pot 1 (established) 50 (64) 65 (83) 65 (83) 65 (83) 65 (83) 65 (83)
Pot 2 (less - 155 (199) 260 (334) 260 (334) 260 (334) 260 (334)
established)
Total 50 (64) 230 (295) 325 (417) 325 (417) 325 (417) 325 (417)
All the budgets are calculated on the basis of 2011/12 prices. The budgets will be
inflated by a CPI factor of 1.0195.
10Characteristics Description
Frequency of The first auction process took place between October 2014 and February 2015. Initially it
auctions was expected that there would be a subsequent round in October 2015 but this has not
been announced, and there is no indication of when it might take place
Volume of the The volume of the tender is decided by the budget in each of the pots.
tender
Auction design See Table 2
elements
Design elements for the assessment of auction schemes for RES-E
Table 2. Design elements for the assessment of auction schemes
Design elements
Single- or Multiple
multiple-item
auctions
Auction procedure Sealed bid procedure.
The SoS can set a minimum budget reservation (either in MW or ££s) for specific
technologies, or groups of technologies. In the first allocation round there was a
minimum of 10MW for wave and tidal stream technologies.
The SoS can also set a maximum budget reservation (either in MW or ££s for specific
technologies or groups of technologies. No maxima were set in the first allocation
round.
Applicants can submit flexible bids into the auction process. The flexibility applies to
the capacity, price and/or delivery date of a project.
3
The auction process is complex and involves several steps :
1. If applications do not exceed the applicable budget pot, applicants will be
offered a CfD at the prevailing Administrative Strike Price (unconstrained
allocation)
3
DECC (2014, contract for Difference: Final Allocation Framework for the October 2014 Allocation Round, October,
https://www.gov.uk/government/uploads/system/uploads/attachment_data/file/404405/Contract_for_Difference_Final_Allocation_Framework_for_the_October_2014_Allo
cation_Round.pdf
11Design elements
2. An auction is triggered if applications exceed the available budget pot, or if the
capacity of technologies subject to the maximum limit is exceeded.
3. If an auction is necessary, the Delivery Body notifies the applications inviting
sealed bids. Applicants have 5 working days to submit a bid stating the strike
price that they are willing to accept for the project and the delivery year for the
project 9ie the Target Commissioning Date)
4. If the SoS has stated a minimum capacity for any technology, bids for that
technology are ranked by bid price and accepted up to the minimum capacity.
Any projects that are not accepted at this stage are considered with the other
projects in that technology’s relevant pot the highest price up to the minimum
sets the price for all projects subject to that minimum in each delivery year;
5. For each pot all bids excluding those accepted as part of the minimum are
ranked by price;
6. Starting from the lowest price bid, the budget impact of the bids (in addition to
the bids accepted under a minimum) is assessed for each bid in ascending
price order for all years for which budget constraint has been announced;
7. If the budget for any year is exceeded, the project’s alternative ‘flexible’
configurations are tested against the budget. If the budget cannot be made to
work with the alternatives, the project is rejected. Bids which exceed a capacity
maximum, if it is set, are also rejected;
8. The process is continued until there are no more projects or no more budget in
any year;
9. The award prices are the marginal prices within each year up to the
technology’s ceiling price or the marginal price within a capacity minimum.
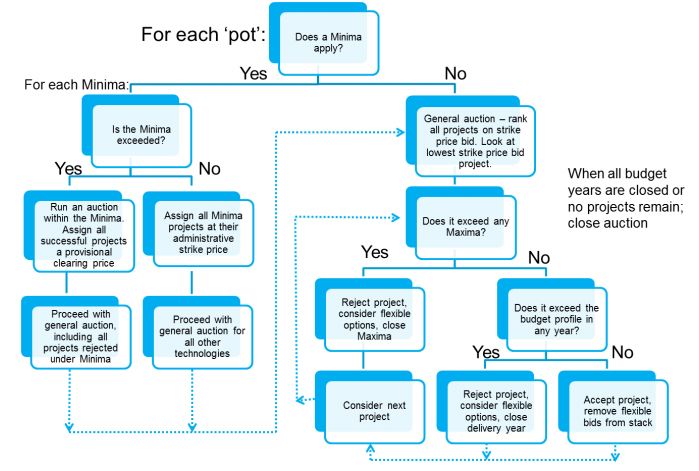
The figure below shows the decision tree outlines how awards and prices emerge from
the process:
12Design elements
Figure 4: CfD auction decision tree (DECC, 2014a)
4
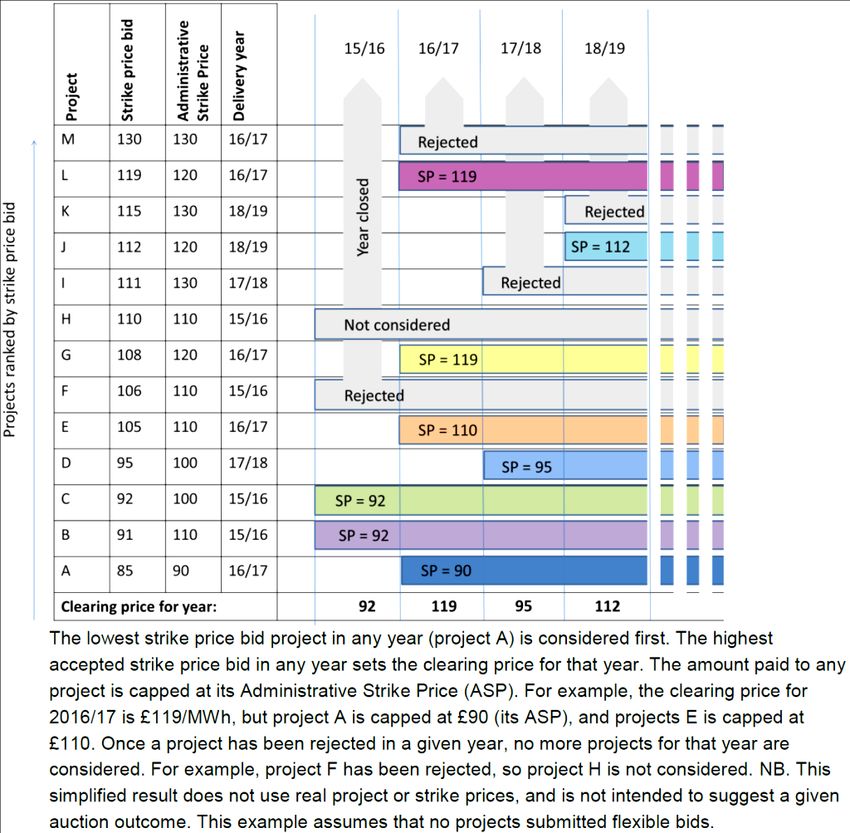
Figure 5 shows how this might work in practice :
4
DECC (2014), CFD Auction Guidance, September, https://www.gov.uk/government/uploads/system/uploads/attachment_data/file/358132/Auction_guidance_Final.pdf
13Design elements
Figure 5: Illustrative Auction Results
Pricing rules Pay-as-clear (uniform pricing within each year) with a separate price determined for
technologies for which a minimum volume has been set, unless the general clearing
price for that year is higher than the clearing price for the protected technology.
If there is a minimum capacity set for a technology, a number of projects of the
technology to which it applies - up to the minimum capacity - is given a reserved price
(the price at which the auction would have cleared if the protected technology were the
only entrant). The budget impact of the protected technology is calculated alongside
the other technologies. If the general clearing price is higher than the price for the
protected technology, the protected technology receives the general price. If a
technology has been assigned a maximum in the pre-auction framework, the first
project to breach the capacity of the maximum is rejected as are all subsequent bids
from that technology.
Ceiling price Prices for the auctions are capped at a price known as the ‘administrative strike price’.
This price is based on estimates of technology and finance costs. In the event that the
14Design elements
clearing price for a particular delivery year is higher than the ceiling price in that year
for technology, the ceiling price is awarded as the contract price.
The ceiling prices reduce over the period for which contracts are offered to reflect
expected reductions to the cost of renewable electricity production.
Table 4: Administrative strike prices (ceiling prices) by technology type and year (2011/12 prices)
(Source: DECC, 2013b)
Ceiling price, £/MWh (€/MWh) 2014/15 2015/16 2016/17 2017/18 2018/19
Pot 1 (established)
Onshore Wind (>5 MW) 95 (122) 95 (122) 95 (122) 90 (115) 90 (115)
Solar Photo-Voltaic (>5MW) 120 (154) 120 (154) 115 (148) 110 (141) 100 (128)
Energy from Waste (with CHP) 80 (103) 80 (103) 80 (103) 80 (103) 80 (103)
Hydro (>5 MW and 5MW)
15Design elements
Dedicated Biomass (with CHP) 125 (160) 125 (160) 125 (160) 125 (160) 125 (160)
Geothermal (with or without CHP) 145 (186) 145 (186) 145 (186) 140 (180) 140 (180)
Pot 3
Biomass Conversion 105 (135) 105 (135) 105 (135) 105 (135) 105 (135)
5
Qualification A fixed-length period or ‘target commissioning window’ is set by the Government
criteria within which contracts will come into force. Applicants state the Target Commissioning
Date (TCD) and the start of the commissioning window in the application process.
There are several qualification criteria against which projects are measured:
all spatial planning requirements are met and permits issued to allow the
project to go ahead;
a connection agreement must be held;
the project must be shown to not be in receipt of funds from other RES policies
(the Renewable Heat Incentive, the Renewables Obligation and the Capacity
market scheme) (DECC, 2014c)
if the installed capacity is to be more than 300MW a ‘supply chain plan’ which
details how the project will promote competition, innovation and skills in the
6
supply chain must be submitted and approved (DECC, 2014c) ;
In addition, phased offshore wind have supplementary requirements for eligibility:
There can be up to 3 phases of the project
Taken together, these 3 phases must not exceed 1500MW
Installed capacity of the first phase must be at least 25% of the total project
capacity
The first phase must have a Target Commissioning Date no later than 31 March 2019.
The final phase must have a TCD no later than 2 years after the TCD of the first phase
Penalties There are two scenarios in which applicants/developers can be penalised:
5
one year for all technologies except solar PV (3 months) and landfill gas (6 months) (DECC, 2014c)
6
Also: (HM Government, 2014)
16Design elements
1. Being offered a CfD and refusing to sign it
2. Signing a CfD and failing to deliver the project, or alternatively failing to meet
various milestones during the construction phase of the project.
The primary penalty is the exclusion of any project on the same physical location from
future auctions for a period of thirteen months from the date at which a contract is
offered or, if already signed, terminated (DECC, 2015d).
Monitoring of DECC is ultimately responsible for monitoring realisation progress of the contracted
realisation projects, informed by the EMR Delivery Body.
progress
Exceptions from The CfD option is intended to apply to larger low-carbon projects (generally >5MW)
requirements for with a targeted feed-in programme available for smaller scale projects.
small
plants/developers
?
Support auctioned In principle, two model contracts are offered to bidders: an intermittent CfD applying to
low and zero marginal cost technologies such as solar and wind and a baseload CfD.
applying to dispatchable plant such as fuelled renewables and hydro generators. The
baseload CfD could also be auctioned to nuclear operators but nuclear generators
were not included in the contracts available in the first auction which was reserved
7
entirely for renewables (DECC, 2014e) .
Bidders may also indicate their willingness to be ‘flexible’ by suggesting an alternative
project capacity and/or delivery date to enable the auctioneer to adjust the stack to
meet the budget constraint in each year. If a flexible bid is accepted, all other
combinations offered from the same project are removed from the selection process.
The bidder may indicate up to ten flexible bids with no more than three in each delivery
year, and all at different prices (DECC, 2014c; Oxera, 2014).
Transferability of With 10 days’ notice, a generator may transfer the rights and responsibilities of the CfD
support right to another party through sale or to a lender as part of a financial arrangement (DECC,
2014d).
7
A CfD for the Hinkley Point C nuclear project has been agreed separately with EDF. The strike price for this was set administratively at £92.50/MWh rather than through
a competitive process.
172. Evaluation criteria for the assessment of auction
schemes for RES-E
Actor variety and social acceptability
A wide range of actors, from large utilities to small independent developers, were able to participate and no
participant won more than a single contract. Within the current political discourse about renewable energy in
the UK, the government is likely to view low out-turn cost (static efficiency) as the most reliable indicator of
social acceptability.
Policy effectiveness (effectiveness of auctions)
As a budget allocation system, the CfD auction of 2014/15 had limited success. Though it failed to allot large
sums of budget in the first four years for which a budget was set, the auction managed to allocate substantial
amounts in later years (Figure 6). It is notable that the total spending commitment for the first delivery year is
actually slightly negative. This is because successful bids were lower than the reference wholesale power
price assumption for that year, meaning that the two-way CfD, in which the generator must pay back any
revenues above their strike price, would be forecast to be revenue-positive for the government-owned
counterparty (LCCC).
£350.000.000
£300.000.000
£250.000.000
£200.000.000
£150.000.000
£100.000.000
£50.000.000
£-
2015/16 2016/17 2017/18 2018/19 2019/20 2020/21
-£50.000.000
Budget Total Spend
Figure 6: Budget versus total spend
The failure to allocate much of the pot 1 budget in 2015, 2016 and 2017 may be attributed to the external
policy environment. Large-scale (>5MW) solar projects were prevented from accessing the major alternative
policy, the RO from April 2015, because solar was ‘deploying faster than could be afforded’ (DECC, 2014f,
p.12). At the time of the auction, wind appeared to be eligible for the RO until the end of March 2017 (Ofgem,
2014a), although that date now seems likely to move forward to 2016 (Rudd, 2015)).
18Since the budget profile was more-or-less flat from 2017 to 20121 and each project’s cost is counted every
year, later years of the allocation were likely to fill up first, depending on the random date order in which the
price stack was constructed. Put another way, the first delivery year could only be filled up with projects
wishing to start on that date, while later years would have to account for projects starting in earlier years.
Static efficiency or cost effectiveness (including transaction and administrative
costs)
The average contract prices achieved in the first auction round appear to be competitive when compared with
the administrative strike prices or cost estimates, as well as the Final Investment Decision (FIDeR) contracts
awarded to several offshore wind farms earlier in 2014.
160
140
120
Price (£/MWh)
100
80
60
40
20
0
ACT EfW CHP Offshore wind Onshore wind Solar PV
Average FIDeR price
average ASP in delivery years with contracts signed
average auction clearing price
Table 5: Auction outturn prices (National Audit Office, 2014; DECC, 2015a)
One notable feature of the auction outcome was the very low pot 1 (established technologies) clearing price
for the first delivery year. The only projects awarded contracts in that year were two solar farms offered
contracts at £50/MWh. The developers of these projects have since declined to sign the offered contract with
one stating that £50 was never a feasible price at which to build a project (Business Green, 2015). The pay-
as-clear pricing rule may have contributed to the perception by some bidders that a very low bid was the only
way to win a contract. Also, the very small penalties (which, since another auction will not be held within 13
months of the first auction have turned out to be zero) contributed to bidders placing very low bids.
19£140,00
£120,00
Ceiling price (£/MWh)
£100,00
£80,00
£60,00
£40,00
£20,00
£-
2014 2015 2016 2017 2018 2019
Clearing price pot 1 (established technologies)
Ceiling price - onshore Wind (>5 MW)
Ceiling price - solar Photo-Voltaic (>5MW)
Ceiling price - energy from Waste (with CHP)
Figure 7: Pot 1 auction results and ceiling prices of winning technologies
While projects knowingly placed bids that were not commercially viable, there was an expectation that at least
one project would place a bid in their delivery year which would clear the auction at a viable price. A
calculation that the downside of bidding a commercial price and missing out on a contract by a small margin
was seen to be greater than receiving a contract at too low a price and rejecting it. The fact that solar was
excluded from any other policy revenue stream in the run up to the auction may have also been a factor in this
8
strategy, as did the relatively small non-delivery penalty of exclusion from CfD auctions for 13 months . Since
data concerning unsuccessful bids are unavailable, it is not possible to know whether other bidders pursued a
similar strategy but the decision to run the auctions as pay-as-clear, taken late in the design process (DECC,
2014b), may have contributed to this kind of ‘over optimistic’ bidding behaviour.
Pot 2, for less established technologies, appeared to offer a result more in line with expectation, with the
clearing price being significantly lower than the ceiling price in both years for which contracts were allocated
but within the range understood to be viable.
8
In fact it looks likely that the bidders would not face any penalty since the second auction has been delayed
20£180,00
£160,00
£140,00
Ceiling price (£/MWh)
£120,00
£100,00
£80,00
£60,00
£40,00
£20,00
£-
2014 2015 2016 2017 2018 2019
Clearing price pot 2 (less established technolgies)
Ceiling price - offshore Wind
Ceiling price - advanced Conversion Technologies (with or without CHP)
Figure 8: Pot 2 auction results and ceiling prices of winning technologies
Dynamic efficiency
The ability of the CfD auction system to promote continued reduction in energy costs from the targeted
technologies is mixed. On one hand there was a very strong weighting of the auction design in favour of
immature technology. The size of ‘pot 2’ – the budget portion reserved for ‘less established technologies’ –
was nearly three times the size of the mature technology ‘pot 1’. Similarly the ability of the system to impose
minimum contributions for particular technologies has the potential to support innovation in less mature
sectors.
1.400
1.200
1.000
800
600
400
200
0
Advanced
Energy
Conversion Offshore Onshore
from Waste Solar PV
Technologi Wind Wind
with CHP
es
Capacity 62,00 94,75 1162,00 748,55 71,55
Figure 9: Capacity allocation by technology across both technology groups
21The impact of the decision to make three quarters of the funds available to the less-established technology
group is illustrated clearly by the fact that more than half of the capacity contracted by the first auction was
offshore wind.
Another decision which had a significant impact on the outcomes was to include both wind and solar in the
same technology group. Competition between the technologies meant that onshore wind - which is currently
accepted to be cheaper than solar in the UK - was awarded the vast majority of the capacity in pot 1.
1400
Winning capacity (MW)
1200
1000
800
600
400
200
0
2015-2016 2016-2017 2017-2018 2018-2019
Delivery year
Advanced Conversion Technologies Energy from Waste with CHP
Offshore Wind Onshore Wind
Solar PV
Figure 10: Capacity allocated by technology and delivery year
Compatibility with market principles and integration
Creating a framework which maintains or increases the exposure of renewable generators to the wholesale
power markets was a principle of the EMR programme (DECC, 2011). The nature of the contract appears to
have achieved that aim.
Distributional effects & minimisation of support costs
The combination of low contract prices and strictly managed budgets mean the overall support costs are
tightly controlled. The costs incurred by the contract counterparty are funded by a levy on all licenced
electricity suppliers.
223. Lessons learnt: key best practices and pitfalls
identified
Only one CfD round has taken place to date, and the projects awarded contracts are still under
construction. It is therefore too early to make definitive statements about the effectiveness of the
mechanism in the UK. However, there are some points worth raising as possible future lessons:
While the high level design of the auction process is reasonably straightforward, allocation of the
contracts is complex compared to auctions in other countries
Pay-as-clear encouraged bidders to keep away from the margin with some very low bids
Separate clearing prices for each year mean that there was always a risk that a low bid would be the
marginal bid
In the first two years this was magnified by the split of the RO phase out – two years earlier for solar
than wind
Few solar projects appear to have even bid. This may be due to solar developers choosing to finish
RO projects before their cut off, focusing on the non-CfD sub 5MW projects to avoid the cost/risk of
an auction,
The complex auction design favoured big or sophisticated players able to navigate the quite complex
process
While the ASP is an administrative process, the split between pots was very much a political decision
taken by the SoS. The budget split was very favourable to offshore wind (as a political priority)
Since the budget is announced per auction through the budget notice there is no long term signal
about future prices in any future auctions. It is clear that there was strategic bidding from at least one
solar developer who was subsequently unable to sign a CfD contract. However, the penalty for failing
to do so (exclusion from any future auctions within 13 months) is insignificant given that there have
been no other bidding rounds announced
23References
Business Green (2015) Solar farms shelved following government contract controversy. [online]. Available
from: http://www.businessgreen.com/bg/news/2402973/solar-farms-shelved-following-government-contract-
controversy [Accessed September 16, 2015].
Davey, E. (2014) Budget Notice for CFD Allocation Round 1.
Davey, E. (2015) Budget Revision Notice for CFD allocation round 1.
DECC (2015a) CFD Auction Allocation Round One - a breakdown of the outcome by technology, year and
clearing price.
DECC (2014a) CFD Auction Guidance.
DECC (2014b) CfD Expert Group : Auction Design Workshop.
DECC (2013a) Consultation on changes to financial support for solar PV.
DECC (2014c) Contract for Difference : Final Allocation Framework for the October 2014 Allocation Round.
DECC (2014d) Contract for Difference Standard Terms and Conditions.
DECC (2015b) Contracts for Difference (CFD) Allocation Round One Outcome.
DECC (2013b) Electricity Market Reform Delivery Plan.
DECC (2015c) Energy trends and prices statistical release: 25 June 2015. GOV.UK. [online]. Available from:
https://www.gov.uk/government/news/energy-trends-and-prices-statistical-release-25-june-2015 [Accessed
February 25, 2016].
DECC (2009) National Renewable Energy Action Plan for the United Kingdom Article 4 of the Renewable
Energy Directive.
DECC (2015d) Non-Delivery Disincentive for Contracts for Difference.
DECC (2011) Planning our electric future: a White Paper for secure, affordable and low ‑ carbon electricity.
DECC (2014e) THE CONTRACTS FOR DIFFERENCE (STANDARD TERMS) REGULATIONS 2014.
HM Government (2014) The Contracts for Difference (Allocation) Regulations 2014. UK.
National Audit Office (2014) Early contracts for renewable electricity.
Ofgem (2015) Retail Energy Markets in 2015.
Oxera (2014) CfD auctions, bidding strategies, and insights from auction theory.
24You can also read