Housing and Health: energy poverty - John Riley, Director Ian Watson, Principal Consultant
←
→
Page content transcription
If your browser does not render page correctly, please read the page content below

Housing and Health: energy
poverty
John Riley, Director rileyjm@bre.co.uk
Ian Watson, Principal Consultant watsoni@bre.co.uk

Part of the BRE Trust
About BRE

All profits from the BRE Group are
used by the BRE Trust to fund new
research and education programmes
that will help to meet its goal of
‘building a better world together’

                                     In 2011/12 BRE Trust expenditure
                                     on research was £3.17 million,
                                     compared with £2.93 million the
                                     previous year. These funds support
                                     the three key elements of the
                                     Trust's activities: research,
                                     publications and five university
                                     centres of excellence
Coverage of this presentation
1. English Housing Survey

2. Fuel poverty

3. Tackling fuel poverty

4. The costs and benefits of dealing with poor housing in England

5. BRE tools using this methodology - HHCC and HIA

6. Liverpool case study
English Housing Survey
The English Housing Survey

– Why we collect housing data
– The EHS and the English housing
  stock
– Monitoring the energy efficiency
– Monitoring fuel poverty
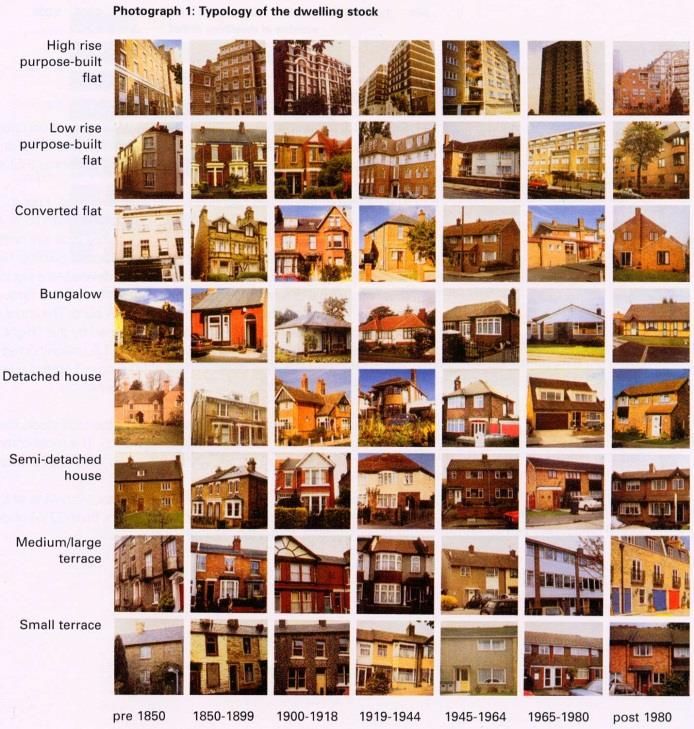
The English housing stock

Why we collect the energy data

 Key indicators
 – Energy efficiency –
     • SAP / BREDEM/ RdSAP / EPCs
  – Fuel Poverty
  – CO2 / energy use

  Other data
– Stock condition, repair costs and EE improvement costs
– Age, type, tenure, size, storeys, material, construction
– Household characteristics – income and composition
– Amenities and services
– Health, safety and security
– Property value, equity and local environment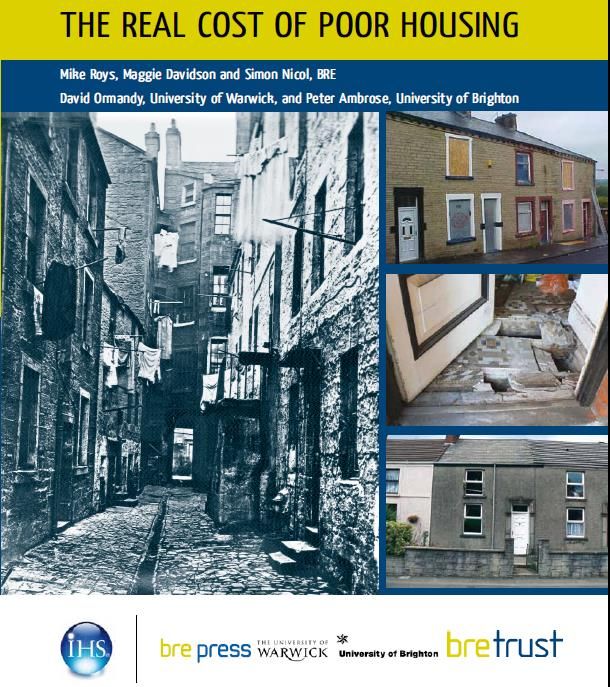
UK Carbon Emissions
   Domestic,            Agriculture etc.
                                         Public
     27%                      1%
    (UK wide)
                                          4%
                                                             Emissions from the use of
                                                  Business
 Lighting, appliances
     and cooking
                                                   ~39%
                                                             electricity and heating fuels
         27%
                                                             by households account for
                                                             27% of the UK’s total,
                                                             making 148.5 MtCO2

                                                         • 73% of household emissions
     Space and
                                                           arise from space and water
    water heating                                          heating, and 27% from
        73%
                                                           lighting, appliances and
                                                           cooking
                                    Transport
                                      29%
       Source: www.occ.gov.uk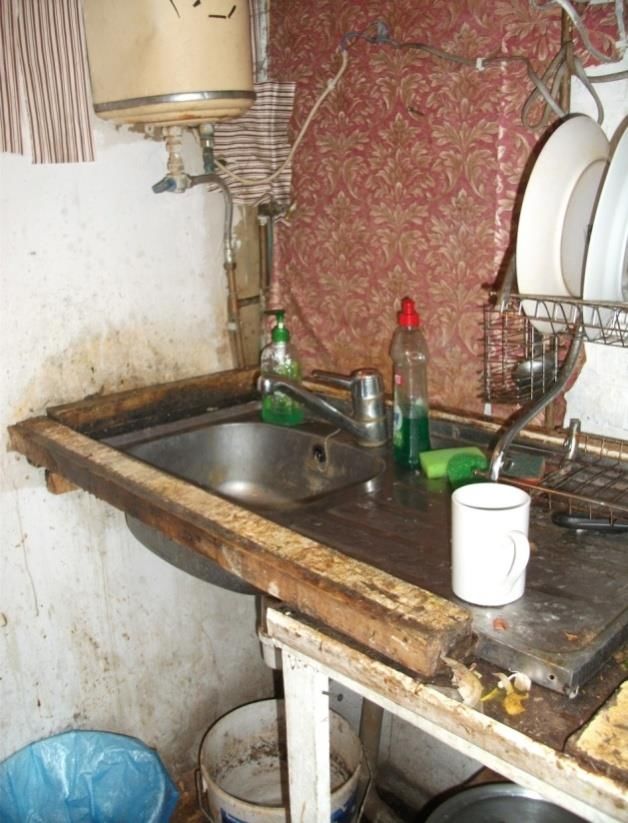
The English Housing Survey (EHS)

– Longest running national housing survey (since 1967)
– Owned by DCLG, delivered by BRE, NatCen and MMBL
– BRE provides: methodology; survey tools; training;
  complex data modelling and analysis; reporting; policy
  support to Government.
– NatCen provides 13,300 household interviews pa.
– MMBL provide 6,200 physical inspections pa.

– Key results published annually (DCLG web site)
– Dataset used within and outside government.
– BRE provides similar support to Scottish, Welsh and
  Northern Ireland surveys.

– Purpose: EHS provides the Government with information
  for the development of housing policies directed at the
  repair, improvement, and energy efficiency of the housing
  stock of all tenures.
The English housing stock

– 22 million homes
– 52 million people
– 50%+ of homes over 50 years old, 22%
  over 100 years old
– 100,000 new homes provided each year,
  just 20,000 demolished.
– Homes will have to last 1,000 years at
  current rates of clearance.
– 99.9% are around from one year to the
  next

   WE ARE STUCK WITH THE HOUSING STOCK WE HAVE GOT
         SO WE HAD BETTER MAKE THE BEST OF IT!
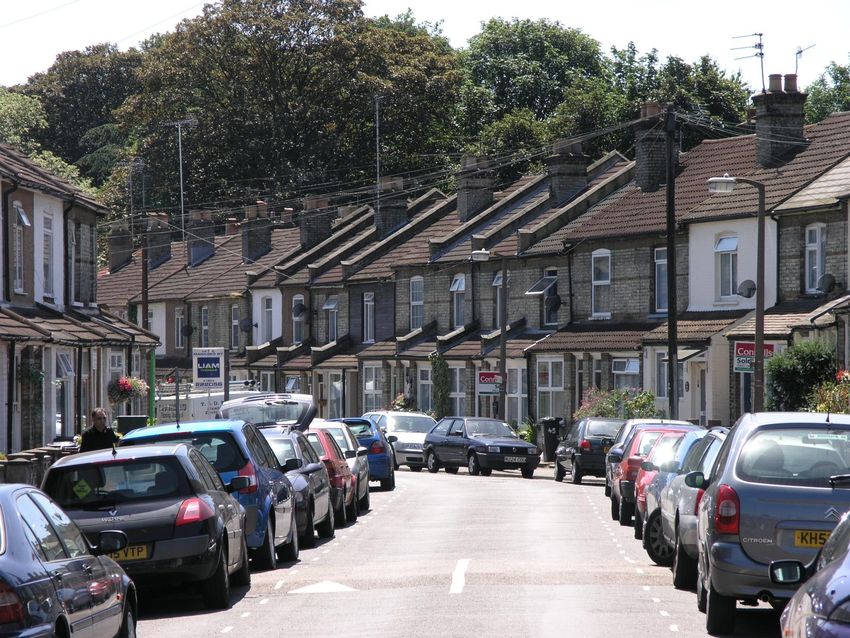
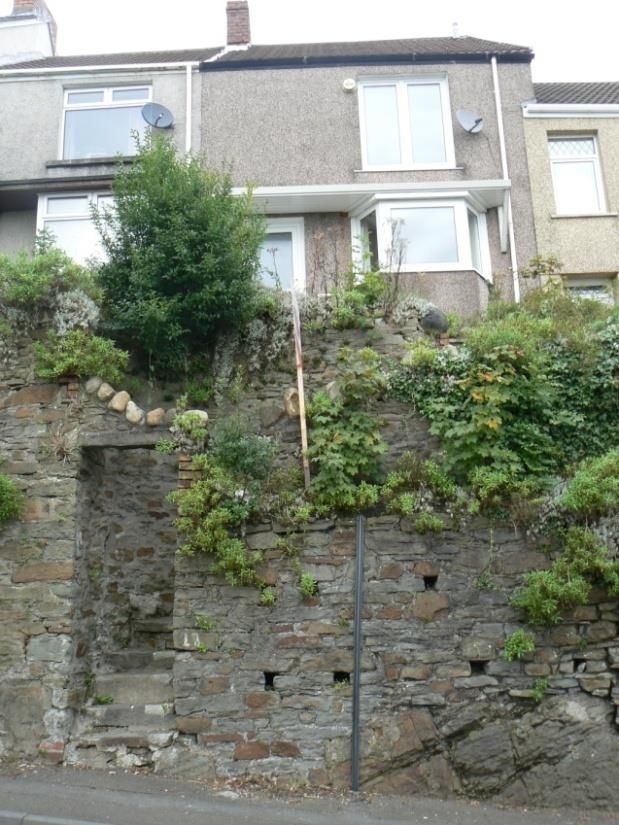
5 million pre 1919 homes in England (22% of stock)

– There are 750,000 historic (pre 1850)
  homes in England

– Another 2.2 million Victorian homes
  (1850-1899)

– Another 2.0 million Edwardian homes
  (1900-1918)
Typical semi’ – the house of the future?
Victorian terraced housing
English housing stock: changing standards over time
DCLG English House Condition Survey 2007

                           50

                           45

                           40

                           35
      % of housing stock

                           30

                           25

                           20

                           15

                           10

                           5

                           0
                                1971      1976       1981         1986   1991     1996        2001       2006
                                  lacking basic amenities                       unfit (1985 Act)
                                  unfit (1989 Act)                              non-decent (2001 orig def)
                                  non-decent (2006 updated def)                 HHSRS (2006)
                                  HHSRS excess cold (2006)
Collecting energy efficiency data for housing – Data on the building structure, building characteristics, heating systems, insulation levels, lighting, etc… – Calculating energy efficiency. SAP is the Government’s Standard Assessment Procedure for the energy rating of dwellings – SAP operates on a scale of 1 (very inefficient) to 100 (very efficient) – A measure of the notional cost to heat and light each square meter of the dwelling – Uses standard assumptions for occupancy, climate and fuel prices. – Developed as a compliance tool and allows comparison of housing across the country – Basis for EPC’s in the UK
Improving energy efficiency: progress to-date
SAP by Dwelling Age

                      D

                      E
                      F
SAP by Dwelling Type
Progress to-date
Fuel poverty
Fuel Poverty Components

– Fuel poverty is caused by a combination of factors
  including:

  – poor energy efficiency

  – high fuel prices

  – low incomes
Fuel Poverty Targets

– The current fuel poverty target for England sets an
  ambition that as many fuel poor homes as reasonably
  practicable achieve a Band C energy efficiency standard
  by 2030. This became law in December 2014.
– The interim objectives in the new fuel poverty strategy
  are:
  – 1. as many fuel poor homes in England as is
    reasonably practicable to Band E by 2020
  – 2. as many fuel poor homes in England as is
    reasonably practicable to Band D by 2025
Fuel poverty
– A measure of ability to pay fuel bills – in particular inability
– Previous definition (10%):
– If a household spends more than 10% of its income on all household fuel use in
order to meet a specified heating regime then it is considered to be fuel poor.
Fuel Poverty Fuel Price × Fuel Consumption
Ratio
=
IncomeFuel poverty
Current (New) definition (Hill’s Low Income High Cost):
A household is considered to be fuel poor where:
– It has required fuel costs that are above average; and
– Its income is below the average poverty line (once housing and
fuel costs have been taken into account).
Also defines a fuel poverty ‘gap’:
– The difference between a household’s required fuel costs and
what these costs would need to be for it not to be in fuel poverty
Lots of complex definitional aspects, particularly around
how to make households and dwelling comparable on a
like for like basis.Fuel poverty Government has a package of measures .across the three main components of fuel poverty Efficiency: building regulations, Green Deal, PRS regulation, heat strategy Prices: helping customers to switch to a better deal, smart meters, Warm Home Discount Incomes: Universal Credit, WFP, CWP .
FUEL POVERTY

CALCULATING THE FUEL
CONSUMPTION REQUIREMENT
Basic principles

                                                    Roof loss
              Other gains

                                            Total space
      Solar gain                            heating load

                               Cooker                               Windows

Fuel supply                          Appliances                     Walls

                                                                    Ventilation
      Flue losses
                            Boiler

                                      Waste water      Floor loss
BREDEM – BREDEM is the BRE Domestic Energy Model for the calculation of energy consumption in buildings – Data on the building structure, building characteristics, heating systems, insulation levels, lighting, cooking, occupants, etc… – An indication of the actual fuel cost to heat, light and power the entire house – Uses actual information for occupancy, climate and fuel prices – Allows an estimate for fuel affordability to be derived
Fuel poverty fuel consumption
   Under the fuel poverty definition, the energy required to heat and
   power a home includes energy for:

1. Space heating - ES (GJ).
2. Water heating - EW (GJ).
3. Lights and appliances - EL & A (GJ).
4. Cooking - EC (GJ).
The BREDEM model is used to predict the energy use of a
   household.

Total household fuel consumption = ES + EW + EL & A + EC.
Heating regime
– There are four designated heating regimes
  – Full
  – Standard
  – Partial full
  – Partial standard

– Setting of times and temperatures for heating based on dwelling
  and occupancy characteristics.

– Heating regime is set based on:
    • Floor area of property to assess underoccupancy
      – Bedroom Standard & Parker Morris Standard
    • Household reported patterns
      – Is someone at home on weekdays
FUEL POVERTY CALCULATING HOUSEHOLD INCOME
Calculating household income

Data Sources

– Information from the EHS Interview Survey
  – HRP and Partner individually
    • amount earned from self-employment, regular
      employment, government schemes, other work,
      occupational and private pensions, other sources
  – HRP plus Partner combined
    • amount received from state benefits (including state
      pension)
  – Amount of savings or money invested
  – Other Benefit Units
    • which state benefits are received, total gross earnings
      for each benefit unit
  – Rent and housing benefit
  – Mortgage payments, support for mortgage interest
    and mortgage payment protection
Income definitions
– Fuel Poverty Full Income
“Net income of the whole household, including income
related directly to housing (i.e. Housing Benefit,
ISMI, MPPI, Council Tax and Council Tax Benefit)”
– Low Income, High Costs (LIHC) definition
– Net income of the whole household as in full income
but with the subtraction of gross rent and mortgage
payments to give “net income after housing costs”Fuel Poverty time series
Fuel Poverty time series
Identifying fuel poor

Household characteristics       Composition
                                Size
                                Age of the main reference person
                                Employment status
                                NS-SEC
                                Benefits
                                Disability
                                Fuel method of payment
                                etc.

Dwelling characteristics    –   Dwelling Age
                            –   Dwelling Type
                            –   Insulation
                            –   Floor Space
                            –   Boiler
                            –   Age of heating system
                            –   Tenure
                            –   etc.
Post improvement performance
DCLG English House Condition Survey 2007
Distribution of homes by EER Bands, 1996, 2006 and post-improvement scenario
1996
2007
post-improvement
0% 20% 40% 60% 80% 100%
B C D E F GThe scale of the task for England
Reaching the 80% target by 2050

Need to include:

  – Stock condition

  – Decarbonisation of the power supply

  – Low carbon heat

  – Advances in technology

  – Changes in occupant behaviour
Retrofitting Challenges

  – Drivers

  – Scale and time presents capacity issues - Can the industry
    deliver?

  – Technical

  – Financial

  – Occupant
Tackling fuel poverty
Tackling fuel poverty

“It is estimated that poor insulation results in £1 in every
£3 currently spent heating UK homes being wasted”

Therefore majority of fuel poverty addressed through
improving energy efficiency. Approaches are both
national and local
Decent Homes
To be classed as ‘Decent’, a home must meet all four of the
criteria below:
1. meet the statutory minimum standard for housing –
   HHSRS (Housing Health and Safety Rating System);
2. be in a reasonable state of repair;
3. have reasonably modern facilities and services; and
4. provides a reasonable degree of thermal comfort.

Progress
• 888,000 homes made
  decent 2001 to 2010
• Estimated cost £37
  billion
Previous energy efficiency schemes

CESP (Community Energy Saving Programme)
– designed to promote a 'whole house'
  approach and treat as many properties
  as possible in defined geographical
  areas selected using the Income
  Domain of the Indices of Multiple
  Deprivation (IMD)
– 293.000 measures installed to 154,000
  dwellings (75k external insulation)
CERT (Carbon Emissions Reduction Target)
– required certain gas and electricity
  suppliers to achieve targets for
  reducing carbon emissions within
  domestic properties
– 297Mt CO2 of carbon saving, 41%
  saving to priority group
Current energy efficiency schemes

Green Deal
– enable homeowners and businesses to
  implement energy efficiency improvements at
  little or no upfront cost with payment recouped
  through customers’ energy bills

ECO (Energy Company Obligation)

1. Carbon Emissions Reduction Obligation
2. Carbon Saving Community Obligation
3. Home Heating Cost Reduction Obligation
Local energy efficiency schemes

Different areas, different priorities
e.g. the owners of older properties in rural areas who are most likely to be
fuel poor; in others, it may be families with young children living in private
rented accommodation.

1. Collective switching
2. Energy Efficiency Schemes
3. Local energy generation
4. Ensuring the energy efficiency of new build
5. Public health
The costs and benefits of dealing
with poor housing in England
The Real Cost of Poor Housing 2010

– Poor housing was costing the NHS in
  England some £600m in first year
  treatment costs alone

– Well received and the subject of
  much debate

– Led to a number of follow-up
  publications applying the same
  methodology to different housing
  stocks:
Purpose of Research

–   To quantify poor housing and estimate how much money could be
    saved by tackling the worst housing conditions in England

–   To provide a tool for policy makers/deliverers to explore the impact
    of targeting improvements at different types of properties and
    different types of people

    Funded by BRE Trust and carried out by BRE in partnership with
    the Universities of Warwick and Brighton
Linking Housing and Health
Excess winter deaths (England and Wales)

An estimated 31,100 excess winter deaths
occurred in England and Wales in 2012/13
ONS
Accidents - breakdown of injuries by location

                   Transport, 299,174

          Workplace, 154,430

                                          Home, 2,701,326

   Leisure, 2,876,294
The English housing stock
– 22.7 million homes
– 52 million people
– 50%+ of homes over 50 years old
– 20% over 100 years old
– 100,000 new homes provided each year
– Only 20,000 demolished
– Homes will have to last 1,000 years
• at current rates of clearance
– 99.9% remain from one year to the next
We are stuck with the housing stock we have got so we had
better make the best of it!Housing Health and Safety Rating System (HHSRS)
Category 1 hazard = ‘Poor Housing’
Physiological Requirements Protection Against Infection
Damp and mould growth etc. Domestic hygiene, pests and refuse
Excessive cold Food safety
Excessive heat Personal hygiene, sanitation and drainage
Asbestos etc. Water supply
Biocides
CO and fuel combustion productions
Protection Against Accidents
Lead
Radiation Falls associated with baths etc.
Un-combusted fuel gas Falling on level surfaces
Volatile organic compounds Falling on stairs etc.
Falling between levels
Electrical hazards
Psychological Requirements Fire
Crowding and Space Flames, hot surfaces etc.
Entry by intruders Collision and entrapment
Lighting Explosions
Noise Position and operability of amenities etc.
Structural collapse and falling elements1. How likely a hazard is to effect a vulnerable person over the course
of 12 months: 1 in:
2. What is the most probable spread of harm outcome taking into
account the of 4 classes of harm:
Weighting
Extreme - 10,000
Severe - 1000
Serious - 300
Moderate - 10
Applying the formula gives a numerical hazard ratingFalls between levels Same likelihood of suffering ill health, but harm outcomes very different
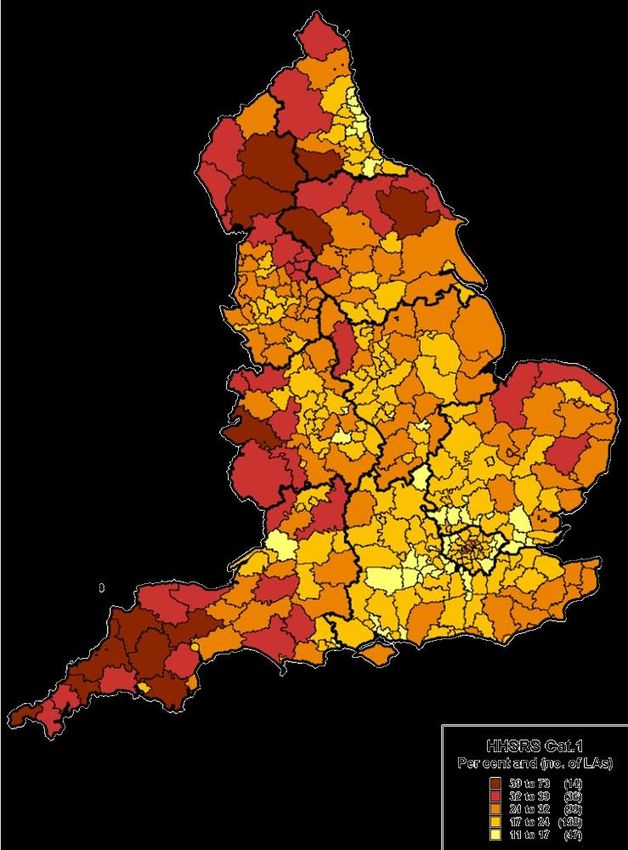
HHSRS Category 1 hazards (EHS 2011)
3.4 million (15%) of English homes have a Category 1 HHSRS hazard
                falls on stairs                                                                                           1,352,837
                  cold homes                                                                                             1,325,088
            falls on the level                                               543,848
        falls between levels                                239,930
                            fire                  128,590
                           lead                  112,051
                         radon                   107,603
                 hot surfaces                   107,168
falls associated with baths                   78,132
 collision and entrapment                     74,054
           damp and mould                   53,349
          entry by intruders               47,284
                    sanitation            35,222
                  food safety             32,283
           domestic hygiene               28,355
               overcrowding              23,871
          structural collapse           15,394
           carbon monoxide              15,336
         electrical problems            9,204
                  ergonomics           8,201
     uncombusted fuel gas              7,545
                          noise        6,161
                       lighting        5,453
                water supply           4,894
                  excess heat          1,369
                   explosions
                                   0            200,000           400,000   600,000    800,000   1,000,000   1,200,000   1,400,000
Estimates of costs of remedial work (2011 EHCS)
Hazard Number of Category Average repair Total cost to repair
1 Hazards cost per dwelling
Excess cold 1,325,088 £ 4,574 £ 6,061,192,123
Falls on stairs 1,352,837 £ 857 £ 1,159,516,031
Falls on the level 543,848 £ 780 £ 424,061,206
Falls between levels 239,930 £ 927 £ 222,382,484
Fire 128,590 £ 3,632 £ 466,975,191
Collision and entrapment 74,054 £ 692 £ 51,274,568
Falls - baths 78,132 £ 521 £ 40,679,153
Dampness 53,349 £ 7,382 £ 393,817,237
Hot surfaces 107,168 £ 2,436 £ 261,065,812
Lead 112,051 £ 1,661 £ 186,099,748
Entry by intruders 47,284 £ 1,063 £ 50,244,016
Radon 107,603 £ 1,126 £ 121,124,474
Sanitation (Personal hygiene) 35,222 £ 1,154 £ 40,639,168
Food safety 32,283 £ 2,461 £ 79,460,523
Pests (Domestic hygiene) 28,355 £ 1,921 £ 54,481,109
Overcrowding 23,871 £ 16,100 £ 384,325,757
Noise 6,161 £ 1,411 £ 8,691,034
Carbon monoxide 15,336 £ 506 £ 7,753,023
Structural collapse 15,394 £ 812 £ 12,507,557
Electrical problems 9,204 £ 2,360 £ 21,722,172
Ergonomics 8,201 £ 483 £ 3,963,825
Un-combusted fuel gas 7,545 £ 489 £ 3,688,692
Lighting 5,453 £ 1,947 £ 10,619,508
Any 3,472,765 £ 2,875 £ 10,072,810,155The cost of making poor housing acceptable
– Low cost work includes:
– Re-locate cooker (£157)
– Install 2 wired smoke detectors (£194)
–– Install handrail to staircase (£295)
100%
Medium cost work includes: 90%
£59,672
£7,898
– Replace lead piping (£1,890) 80%
£3,305
– Rewire house (£3,657) 70%
£1,730
– Redesign staircase (£4,325) 60% £1,195
50%
£919
40%
£584
High cost work includes: 30%
– Re-fit kitchen (£7,000)
£391
20%
£229
– Damp remedial works (£10,940) 10%
£123
– Solid wall insulation (£20,000) 0%
£- £10,000 £20,000 £30,000 £40,000 £50,000 £60,000
Total cost of making all HHSRS Cat 1 hazards acceptable = £10bn
Average cost = £2,875Typical HHSRS outcomes and 1st year treatment
HHSRS Outcome
Hazard Class 1 Class 2 Class 3 Class 4
Damp and mould Not applicable Type 1 allergy Severe asthma Mild asthma
growth - (£2,034) (£1,027) (£242)
Excess cold Heart attack, care, death Heart attack Respiratory condition Mild pneumonia
(£19,851) (£22,295)* (£519) (£84)
Radon (radiation) Lung cancer, then death Lung cancer, survival Not applicable Not applicable
(£13,247) (£13,247)* - -
Falls on the level Quadraplegic Femur fracture Wrist fracture Treated cut or bruise
(£92,490)* (£39,906)* (£1,545) (£115)
Falls on stairs and Quadraplegic Femur fracture Wrist fracture Treated cut or bruise
steps (£92,490)* (£39,906)* (£1,545) (£115)
Falls between levels Quadraplegic Head injury Serious hand wound Treated cut or bruise
(£92,490)* (£6,464)* (£2,476) (£115)
Fire Burn ,smoke, care, death Burn, smoke, Care Serious burn to hand Burn to hand
(£14,662)* (£7,435)* (£1,879) (£123)
Hot surfaces and Not applicable Serious burns Minor burn Treated very minor
materials - (£7,378) (£1,822) burn
(£123)
Collision and Not applicable Punctured lung Loss of finger Treated cut or bruise
entrapment - £5,152 £1,698 £115
Representative cost £90,000 £30,000 £1,800 £120
Not applicable = HHSRS class very rare or non existent
* = Costs after 1 year are likely to occur, these are not modelledNHS first year treatment costs 2011
Falls
on
stairs
£207 M
Falls
Excess
on
the level
£128 M
Cold
£848 M
Falls
between
levels
£84 M
Hot
Fire
surfaces £25 M
£15 M
Damp Falls - Collision
£16 M baths £16 M
£16 MComparative cost burden to the NHS
Risk Factor Total cost burden to the NHS
Physical inactivity £0.9 billion – £1.0 billion
Overweight and obesity £5.1 billion – £5.2 billion
Smoking £2.3 billion – £3.3 billion
Alcohol intake £3.2 billion – £3.2 billion
Poor housing £1.0 billion – £1.4 billionIncluding all sub-standard housing – 2010 report: Total cost of poor housing = £600m – 2014 report: Total cost of poor housing (HHSRS Cat 1) = £1.4bn – 2014: Add HHSRS Cat 2 housing = + £428m – 2014: Add all sub-standard housing = + £160m – The full cost (in terms of NHS first year treatment costs) of sub-standard housing = £2.0bn
Costs to society of living with HHSRS hazards

Residents costs                           External costs
Annual loss of asset value if owned (H)   Annual loss of asset value if rented (H)

Poor physical health (H)                  Higher health service treatment cost (H)

Poor mental health (M)                    Higher health service treatment cost (H)

Social isolation (NQ)                     Higher care service treatment cost (M)

Higher home fuel bills (H)                Higher building heating costs (H)

Higher insurance premiums (H)             Higher external insurance premiums (NQ)

Uninsured content losses (M)              Uninsured external losses (M)

Under achievement at school (NQ)          Extra school costs/homework classes (H)

Loss of future earnings (M)               Loss of talents to society (NQ)

Personal insecurity (NQ)                  High policing cost (H)

More accidents (M)                        High emergency service costs (H)

Poor hygienic conditions (NQ)             High environmental health costs (H)

Costs of moving (M)                       Disruption to service providers (M)

Adopting self-harming habits (M)          Special health care responses (H)

                                          Government and EU programmes (H)
Cost benefit tool
– We cannot find £10bn and go out and fix every HHSRS
Category 1 hazard in the home and save the NHS £1.4bn pa
– So the cost-benefit tool uses the costs provided through the
research to apply different scenarios for action.
Hazard Fall on Stairs Number of category 1 hazards in England 1,755,000
Scenario All up front Cost equal each year by 1% Average Cost to repair £ 1,084
Potential/Lost Benefit equal each year by 1% Total cost to repair in England £ 1,902,420,000
Total number of properties to repair
Probability of Category 1 hazardous event 32
Time period for repair 10 years Probability of Population Average hazardous event 245
Proportion to repair All 1
Average Benefit to NHS by repairing £ 211
Time period 1 years
Annual budget for repair £ 1,902,420,000 Payback period 5.1 years
Annual number of properties to repair 1,755,000 Cumulative payback period 6 years
Average cost to repair £ 1,084 Total All Cost over 25 years £ 1,902,420,000
Total Benefit over 25 years £ 9,276,244,453
At 7% discount rate: Period for NPV to become positive 7 years
£10,000,000
Thousands
Cumulative Benefit
£9,000,000
Cumulative cost of repair
£8,000,000 Cumulative cost of Cat 1
Cumulative all costs
£7,000,000
£6,000,000
£5,000,000
£4,000,000
£3,000,000
£2,000,000
£1,000,000
£0
1 2 3 4 5 6 7 8 9 10 11 12 13 14 15 16 17 18 19 20 21 22 23 24 25
YearsPayback example: Falls on stairs – HHSRS Band C (Cat 1 hazard) – Work = replace balustrades – Cost of work = £314 – Annual benefit to NHS = £146 – Payback = 2.1 years
Case study: cost-benefit of energy improvements
Before: solid, un-insulated stone walls, After: condensing gas boiler and radiators
partial double glazing, small amount    for space and water heating,
of roof insulation, off-peak storage    top-up loft insulation,
radiators, electric immersion heater.   full double glazing.
– Cost of upgrade = £0                  – Cost of upgrade = £3,528
– SAP = 22                              – SAP = 59
– Annual fuel cost = £965               – Annual fuel cost = £461
– CO2 emissions = 8,972 kg pa           – CO2 emissions = 4,666 kg pa
– HHSRS Band = A (Cat 1 hazard)         – HHSRS Band F (Low hazard)
– Household in fuel poverty             – Household not in fuel poverty

                                        – Cost savings to NHS pa = £528
                                        – Payback to NHS = 5.1 years
                                        WHEN YOU MAKE A HOME MORE
                                        SUSTAINABLE YOU ALSO MAKE
                                        IT MORE HEALTHY!
BRE Tools – HHCC and HIA
Prospective quantitative HIAs for Local Housing
                   Authorities
1. Quantifying the number and distribution of poor dwellings in LA
   area
2. Assessing the potential short term effect on health and wellbeing
3. Quantifying the health costs to the NHS and wider society of
   people living in these poor homes
4. Estimate the health cost benefit of interventions to reduce health
   and safety hazards in poor homes
5. Linking and informing the JSNA and Health and Wellbeing
   strategy
6. Consideration of other data to help develop initiatives designed to
   reduce the inequalities gap
Potential health benefits from improving poor housing
Housing Hazard type Number of Mitigating the Estimated number of Cost of repairs
hazards hazard medical interventions
avoided
Excess cold Improving heating 42, including 13 deaths £45.4m
and thermal
8,506 efficiency measures
Damp and mould growth Improved heating, 695 £11.8m
ventilation
1,396
Entry by intruders 1,442 Window and door 436 £1.5m
locks, security
lighting and key safes
Falls in baths, on stairs, 14,121 Stair rails, 544 £13.5m
trips and slips balustrades, grab
rails, repair to paths
Accidents affecting 4,237 Identifying hazards, 575 £9.5m
children provide more space,
education of
(Personal Hygiene, Sanitation professionals
and Drainage, Falling between
levels, Flames and hot
surfaces, Electrical hazards,
Collision and entrapment)
Total 29,702 2,292 £81.7mCost benefit analysis
Hazard Work Hazard Mitigated
Total cost of
Cost of work (£)
work (£)
Expected annual Expected annual Annual saving
cost to NHS (£) cost to NHS (£) to NHS (£)
Payback
period (yrs)Damp and mould growth
Excess cold
Crowding and space
Entry by intruders
Falls associated with baths etc
NHS - least expensive 50%
Falling on level surfaces etc
NHS - least expensive 20%
Society - least expensive 50%
Falling on stairs etc
Society - least expensive 20%
Falling between levels
Fire
Flames, hot surfaces etc
Collision and entrapment
0 2 4 6 8 10 12 14 16
Payback period (years)Housing Health Cost Calculator (HHCC)
What is the Housing Health Cost Calculator HHCC

– Developed by BRE and administered by RHE
– HHSRS assessments can be added
– HHCC will calculate the score
– Registration and storing data is free!
– HHCC will calculate cost to NHS and to society
– Add a post work assessment to measure savings
– Costs of doing work can also be added, enabling the
  calculator to work out a payback period
– Annual subscriptions allow annual health savings to be
  calculated showing the value of housing intervention
How to add a case

– Cases can be added one
  by one
– You can identify dwellings
  by address, UPRN or both
– HHSRS system uses
  representative scale points
– NHS costs and costs to
  society appear at the
  bottom of the screen
Reviewing your data

– Can order data by rank, hazard, or savings
Case study - Liverpool
Liverpool Healthy Homes Programme
           Ian Watson, Programme Co-ordinator
Liverpool overall context
Population: 466,000 Fuel poverty rates across Liverpool
148,000 private sector properties:
- 19,400 present H&S risk (13%) (Excess
Cold, Falls, Electrical Safety and Fire)
- 19,000 fail the energy efficiency
requirements of the DHS (13%)
Private-rented sector accounts for
highest rates of hazardous housing
(18.7%) & highest concentration of
poorest thermal efficiency
Among highest mortality rates and
lowest levels of life expectancy Key
(% all households fuel poor)
Large health inequalities Above 27%
23-27%
18-23%
Below 18%
© Crown copyright and database rights 2012 Ordnance Survey 100018351Liverpool Life Expectancy
Northern Line
Bus Route 12
County Croxteth Fazakerley City Line
76.6 75.3 77.7
Kirkdale Anfield Tuebrook West Derby
73.8 74. 7 77. 3 79.6
Everton
75.0
Kensington Old Swan Knotty Ash
75.2 75. 5 78.4
Central
Picton
78.6
72.9
Woolton
Riverside 80.7
74.9
St Michaels Childwall Belle Vale
Mossley Hill
76.9 82. 7 77.2
81. 4
Church Cressington Speke
82. 6 79.0 Garston 74.0Housing & Health
Health
Rate of excess winter deaths – 280 per year (NHS health profile 2013)
For each winter death, there are 8 emergency admissions
Accidents in the home cause an estimated 70 deaths and 4,000
hospital admissions per year in Liverpool
Poor housing conditions are implicated in 500 deaths and around
5,000 illnesses requiring medical attention each year in Liverpool
(from national BRE estimates)
Commissioning Drivers
Tackling health inequalities
JSNA
Housing, Health and Safety Rating SystemHealthy Homes Programme - objectives
Phase 1
At scale to make a real population difference
Identify 25,000 properties in priority neighbourhoods
Assess the health and housing needs of each occupant
Engage residents into health and well-being related services
Carry out full health and safety inspection in worst 4,400
properties and secure necessary improvements
Home Safety promotion (particularly under 11’s and over 65’s)
Through the removal of hazard exposure, the programme is
designed to reduce premature deaths by up to 100
when fully implemented, and reduce GP consultations
and hospital admissions by over 1000 casesProgress - April 2009 to January 2015 40,384 initial assessments 20,934 surveys completed 28,689 referrals to partners
Referrals to Partner agencies
>2001                                                                                       Dentists

1000-
2000                                                             Fuel Debt                     2,869
                           Mental
500-                      Wellbeing
 999                                    1,134                            1,571
                                                                                                                               Food and
Progress – Housing conditions 5,736 Health & Safety inspections carried out 4,166 serious housing hazards identified £5.2M Private sector investment 30 construction jobs supported (estimate) 1,846 referrals to social housing providers for repair issues
Common home hazards to February 2015
Health Promotion
Working with landlords
Provide information about key contacts
Ensure annual checks of gas appliances
carried out. Assisting landlords gain
access using enforcement powers
Healthy Homes Property Standard
Contribute to ‘rogue landlords hit squad’
Housing and health campaigns
CO Awareness
Child Accident Safety
Falls prevention
Winter SurvivalReaching Out
Healthy Homes on Prescription
55 practices taken up GP clinical system to identify ‘vulnerable’ patients
GP ‘alerted’ and prompted to ask vulnerable patient about housing conditions
during consultation
Simple referral made from clinical system to Healthy Homes
Healthy Homes visit and provide feedback
Health Centres
Regularly visit 32
centres to provide
Healthy Homes
surgeriesEmergency accommodation pilot
To reduce hospital admissions and delayed discharges
associated with sub standard housing
£1750 per £192 per
week week
Partnership with Dying to Keep Warm charity to
Provide emergency heating for vulnerable residents
Install gas isolation valves
Provide microwaves where dangerous cooking appliances
Provide and fit CO detectors through Handy Person SchemeValue for Money?
BRE evaluation of first year’s operation shows:
861 HHSRS inspections removing 725 Cat1 hazards
Total project cost £1.07M (Inspection cost £300K)
On-going annual NHS savings £440K (£4.4M over 10 years)
Excess cold hazard alone £341,000 (£3.41M over 10 years)
Wider Society annual savings £1.1M (£11M over 10 years)
Excess cold hazard alone £852,000 (£8.52M over 10 years)
Total anticipated savings by HHP:
£55 Million
(£42M from excess cold)
(Building Research Establishment Jan 2011)Cold homes – changing legislation
Liverpool took action against a landlord who had installed a heating
system which was too expensive to operate, contending that it was
unaffordable & unacceptable on grounds of health and safety
Initial court ruled that affordability of system not relevant to health and
safety
This was appealed by the Council, and the matter was raised in the
Houses of Parliament
A higher court agreed
that the running costs
of a heating system
are a relevant factorTackling Fuel Poverty
Energy
efficiency Targeted
•
•
HHSRS improvements
Warm Front approach by
•
•
Efficiency measures
Promotion / campaigns focusing on
• RSL HHSRS training
deprived areas,
and inbound
Fuel cost
referrals
Household Fuel
income Poverty
• Winter Fuel Payments
• Fuel Poverty
• Benefit entitlement checks • HHSRS – ensuring
• Next Step job and career opps affordable systems
• HHSRS – healthier home, • Home Heat Helpline
healthier workforce? • CAB Fuel PovertyEvaluation (Ongoing, but..)
Reduction in health deprivation since 2007
47% reduction in excess winter deaths (36% North West) Year Excess WD
11/12 170
Dental rates increased ‘…the highest NHS dental access rate
Liverpool PCT has had for over two years…. innovative ways of 10/11 220
improving dentistry access through the ‘Healthy Homes Dental Scheme’ 09/10 300
NHS Operational Plan 2011/12 08/09 320Remember, it costs to do
nothing!
Thank you for listening
rileyjm@bre.co.uk
watsoni@bre.co.ukYou can also read