Bureau of Communications and Arts Research - Trends and drivers in the affordability of communications services for Australian households
←
→
Page content transcription
If your browser does not render page correctly, please read the page content below
Bureau of
Communications
and Arts Research

 Trends and drivers in the
 affordability of communications
 services for Australian households
 July 2017

 WORKING PAPER
TRENDS AND DRIVERS IN THE AFFORDABILITY OF COMMUNICATIONS SERVICES FOR AUSTRALIAN HOUSEHOLDS

ii   Disclaimer
     The material in this paper is of a general nature and should not be regarded as legal advice or relied on for assistance
     in any particular circumstance or emergency situation. In any important matter, you should seek appropriate
     independent professional advice in relation to your own circumstances.

     The Commonwealth accepts no responsibility or liability for any damage, loss or expense incurred as a result of the
     reliance on information contained in this discussion paper.

     This paper has been prepared as a working paper only and does not indicate the Commonwealth’s commitment to a
     particular course of action. Additionally, any third party views or recommendations included in this working paper do
     not reflect the views of the Commonwealth, or indicate its commitment to a particular course of action.

     Copyright
     © Commonwealth of Australia 2017

     The material in this discussion paper is licensed under a Creative Commons Attribution—3.0 Australia license,
     with the exception of:
        •   the Commonwealth Coat of Arms

        •   this Department’s logo

        •   any third party material

        •   any material protected by a trademark, and

        •   any images and/or photographs.

     More information on this CC BY license is set out at the creative commons website: www.creativecommons.org/
     licenses/by/3.0/au/. Enquiries about this license and any use of this paper can be sent to:
     The Bureau of Communications and Arts Research, Department of Communications and the Arts, GPO Box 2154,
     Canberra, ACT, 2601.

     Attribution
     Use of all or part of this discussion paper must include the following attribution:

     © Commonwealth of Australia 2017

     Using the Commonwealth Coat of Arms
     The terms of use for the Coat of Arms are available from the It’s an Honour website (see www.itsanhonour.gov.au
     and click ‘Commonwealth Coat of Arms’).

     Bureau of Communications and Arts Research, Department of Communications and the Arts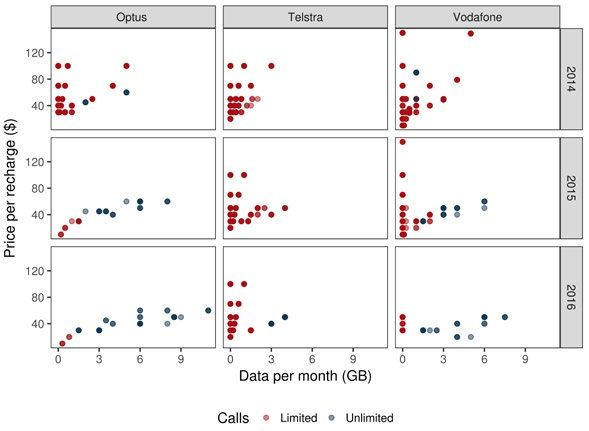
TRENDS AND DRIVERS IN THE AFFORDABILITY OF COMMUNICATIONS SERVICES FOR AUSTRALIAN HOUSEHOLDS

Contents                                                                                                                iii

Introduction                                                                                                      1
   Why look at affordability?                                                                                     1
   Key findings                                                                                                   1

Overall affordability has improved                                                                                2
   Households are spending less                                                                                   2
   …and are accessing more services                                                                               3
   Households are getting better value from lower prices and more data                                            6

Affordability of home broadband                                                                                   8
   Regional ADSL customers will benefit from the NBN                                                              8
       Box 1. On-net and off-net ADSL services                                                                    9
   …as data allowances increase                                                                                 13
   Prices of entry-level broadband bundle plans are stable, but with increased
   data inclusions for some plans                                                                               16

Affordability of mobile services                                                                                18
   There is a wide range of options for mobile customers, including at lower price points 18
   …providing regional consumers with more choice                                                               20
       Box 2: MNOs vs MVNOs                                                                                     20
   The range of both post-paid and prepaid plans has increased…                                                 23
   …including for mobile wireless broadband                                                                     24

Affordability outcomes for particular households                                                                27
   Lower-income households spend a larger proportion of their income on
   communications services                                                                                      27

International comparisons                                                                                       31

Outlook for affordability                                                                                       32

Appendix: Price collection methodology                                                                          33

Endnotes                                                                                                        37

                                Bureau of Communications and Arts Research, Department of Communications and the Arts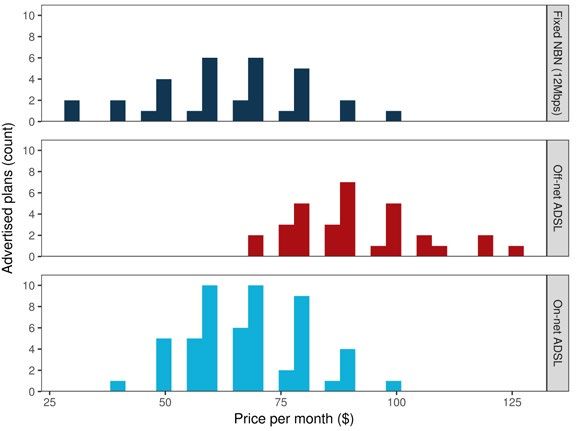
TRENDS AND DRIVERS IN THE AFFORDABILITY OF COMMUNICATIONS SERVICES FOR AUSTRALIAN HOUSEHOLDS

iv

     Bureau of Communications and Arts Research, Department of Communications and the Arts
TRENDS AND DRIVERS IN THE AFFORDABILITY OF COMMUNICATIONS SERVICES FOR AUSTRALIAN HOUSEHOLDS
List of figures v
Figure 1. Average share of household disposable income spent on mobile and fixed-line
telephone rent, calls and internet charges 2
Figure 2. Average annual household expenditure on mobile and fixed-line telephone rent,
calls and internet charges and average annual household disposable income 3
Figure 3. Growth in real household consumption of communications goods and services 4
Figure 4. Essential and non-essential communications services, 1970s to 2010s 4
Figure 5. Australians’ access to communications technologies, 2006 to 2016 5
Figure 6. Volume of data downloaded, Australia, December 2012–16 6
Figure 7. Telecommunications services price indices 7
Figure 8. Number of fixed broadband bundle plans at price points (selected providers)
by technology, May 2017 8
Figure 9. ADSL connections by equipment, 2016 9
Figure 10. Distribution of fixed broadband bundle plans by price and included data for
selected providers, May 2017 10
Figure 11. Distribution of NBN satellite plans and low data fixed NBN plans by price and
included on-peak data allowance for selected providers, May 2017 11
Figure 12. Distribution of NBN satellite plans and off-net ADSL plans by price and
included on-peak data allowance for selected providers May 2017 12
Figure 13. Average bundle prices for on-net ADSL, off-net ADSL and fixed NBN plans
(selected providers) over the period June 2014 to June 2016 13
Figure 14. Average monthly data included with on-net ADSL, off-net ADSL and
fixed NBN plans (selected providers) over the period June 2014 to June 2016 14
Figure 15. Proportion of advertised plans including more than 500GB per month
(selected providers), by technology 15
Figure 16. Average price and price range for entry-level fixed broadband bundles
(selected providers) over the period June 2014 to June 2016, by technology 17
Figure 17. Price vs included data, by limited or unlimited calls 18
Figure 18. Price vs Included data, by payment type 19
Figure 19. Price vs included data, by Telstra or non-Telstra network 21
Bureau of Communications and Arts Research, Department of Communications and the ArtsTRENDS AND DRIVERS IN THE AFFORDABILITY OF COMMUNICATIONS SERVICES FOR AUSTRALIAN HOUSEHOLDS
vi Figure 20. Price vs included data for plans on the Telstra network, by Telstra or MVNOs 22
Figure 21. MNO post-paid plans, 2014–16 23
Figure 22. MNO prepaid plans, 2014–16 24
Figure 23. Mobile Wireless Broadband Price vs Included data, by payment type 25
Figure 24. Mobile Handset vs Mobile Wireless Broadband data downloaded per connection 26
Figure 25. Average share of household disposable income spent on mobile and fixed-line
telephone rent, calls and internet charges, by household disposable income decile, 2015 27
Figure 26 and Figure 27. Average share of household disposable income spent on
mobile and fixed-line telephone rent, calls and internet charges, by vulnerable groups
and rural households over time 28
Figure 28 and Figure 29. Average annual household expenditure on mobile and fixed-line
telephone rent, calls and internet charges, all households and rural areas. Average annual
household disposable income, all households and rural areas. 29
Figure 30 and Figure 31. Percentage of low-income and high spending households,
vulnerable groups and rural households, 2006 – 2015 30
List of tables
Table 1. Mobile coverage, percentage of the Australian population, 2016 20
Table 2. Selected long-life prepaid plans, call and data costs, May 2017 22
Bureau of Communications and Arts Research, Department of Communications and the ArtsTRENDS AND DRIVERS IN THE AFFORDABILITY OF COMMUNICATIONS SERVICES FOR AUSTRALIAN HOUSEHOLDS
Introduction 1
Why look at affordability?
Communications services are increasingly essential for household access to information,
employment, markets and key services. Consumer demand for communications services has grown
rapidly. In response, competitive markets should be providing services that are affordable, including for
vulnerable groups.
While the Productivity Commission looked at the affordability of communications services as part of
its inquiry into the Telecommunications Universal Service Obligation, this paper provides a deeper and
more targeted examination of trends in affordability for particular household types, focusing on mobile
and internet services.
While this working paper examines pricing as part of the analysis, price itself does not provide a complete
picture of the extent to which households are able to afford to access the communications services
necessary to engage with society and the economy. Affordability, which takes into account incomes,
prices and quantity consumed, is typically measured at the household level as the proportion of total
household income spent on a good or service by all members of a household.
Average measures of affordability for all households are also useful to determine trends over time.
However, these measures provide little information on outcomes of particular groups. This paper
examines trends in affordability for all households, as well as for vulnerable groups and those in rural
and regional areas. Affordability in Australia relative to other countries is also assessed using a range
of international metrics.
Key findings
• The affordability of communications services for households has improved in aggregate and for
most vulnerable groups over recent years. Consumers are getting better value as prices stay the
same or fall, while product inclusions (such as data) increase.
• Markets for communications services are responding to strong consumer demand and different
tastes by providing greater choice and products at a range of price points. Mobile customers are
generally well served with significant choice and options.
• For home broadband services, the roll out of the NBN is improving choice and reducing prices for
regional consumers.
• Australia compares well internationally on affordability measures for mobile services and is
improving for fixed broadband. However, better data and comparable methodology are needed for a
robust cross-country comparison of the affordability of broadband services.
• Strong consumer demand for communications services is anticipated to continue well into the
future. The outlook for affordability will depend on a number of factors including regulatory settings,
competitive pressures and broader income growth.
Bureau of Communications and Arts Research, Department of Communications and the ArtsTRENDS AND DRIVERS IN THE AFFORDABILITY OF COMMUNICATIONS SERVICES FOR AUSTRALIAN HOUSEHOLDS
2
Overall affordability has improved
Aggregate household affordability of communications services has improved since 2008. This indicates
a healthy degree of competition in the market and suggests most households are able to benefit from the
digital economy.
Households are spending less
The average household saw its expenditure on communications services as a share of household
disposable income fall in recent years. Average household expenditure on fixed-line telephone, mobile
and internet services declined from 4.1 per cent of household disposable income in 2008 to 3.5 per cent
in 2015 (Figure 1).
Figure 1. Average share of household disposable income spent on mobile and fixed-line
telephone rent, calls and internet charges
5
4
3
Per cent %
2
1
0
2006 2007 2008 2009 2010 2011 2012 2013 2014 2015
Source. The Household Income and Labour Dynamics in Australia (HILDA) Survey, Release 15 1.
Notes. Telephone rent and calls includes rent and charges on both fixed-line and mobile phones including the cost of buying a mobile handset
that is included in a service bundle (but excluding the cost of buying a handset outright). Internet charges capture both fixed and mobile
internet expenses. This data series tracks expenditure share by the average household. While households vary in size, average household size
in Australia has remained constant at 2.6 people per household between 2006 and 2011, and is projected to stay between 2.5 and 2.6 people
per household in 2036.2 Household disposable (regular) income is equal to the sum of regular private income, Australian Government public
transfers, other regular public transfers and foreign pensions minus estimated taxes on regular income. A small number of households with an
expenditure share equal to zero or equal to 100 per cent or greater have been excluded from the analysis. Figures have not been adjusted for
inflation.
Bureau of Communications and Arts Research, Department of Communications and the ArtsTRENDS AND DRIVERS IN THE AFFORDABILITY OF COMMUNICATIONS SERVICES FOR AUSTRALIAN HOUSEHOLDS
This has largely resulted from increases in disposable income rather than reduced expenditure on 3
communications services, which has been relatively flat (at approximately $2000 a year, Figure 2).
The net result is a decline in communications services share in spending.
Figure 2. Average annual household expenditure on mobile and fixed-line telephone rent,
calls and internet charges and average annual household disposable income
$100,000 $3,000
$2,500
$80,000
$2,000
$60,000
$1,500
$40,000
$1,000
$20,000
$500
$0 $0
2006 2007 2008 2009 2010 2011 2012 2013 2014 2015
Average household disposable income (LHS)
Average household expenditure on telephone rent, calls and internet charges (RHS)
Source. The Household Income and Labour Dynamics in Australia (HILDA), Release 15.
Notes. Telephone rent and calls includes rent and charges on both fixed-line and mobile phones including the cost of buying a mobile handset
that is included in a service bundle (but excluding the cost of buying a handset outright). Internet charges capture both fixed and mobile
internet expenses. This data series tracks expenditure share by the average household. While households vary in size, average household size
in Australia has remained constant at 2.6 people per household between 2006 and 2011, and is projected to stay between 2.5 and 2.6 people
per household in 2036.3 Household disposable (regular) income is equal to the sum of regular private income, Australian Government public
transfers, other regular public transfers and foreign pensions minus estimated taxes on regular income. A small number of households with an
expenditure share equal to zero or equal to 100 per cent or greater have been excluded from the analysis. Figures have not been adjusted for
inflation.
In addition, once quality is taken into account, households are getting better value for money from
communications services. Data suggests that as well as benefiting from falling real prices for
communications services, the quantity consumed has grown robustly in line with strong demand for
these services and increased product inclusions (largely data allowances).
…and are accessing more services
Households have ramped up their consumption of communications services to take advantage of greater
connectivity, mobility and choice of content. Demand for communications goods and services is growing
faster than that of other goods and services in the economy (Figure 3).
Bureau of Communications and Arts Research, Department of Communications and the ArtsTRENDS AND DRIVERS IN THE AFFORDABILITY OF COMMUNICATIONS SERVICES FOR AUSTRALIAN HOUSEHOLDS
4 Figure 3. Growth in real household consumption of communications goods and services
20
15
% change year-on-year
10
5
0
-5
-10
Mar 1997 Mar 2001 Mar 2005 Mar 2009 Mar 2013 Mar 2017
Household consumption excluding communications goods and services
Household consumption of communications goods and services
Source. ABS (2017), 5206.0 Australian National Accounts: National Income, Expenditure and Product, Mar 2017.
Note: Communications goods and services include telecommunication equipment and services and postal services.
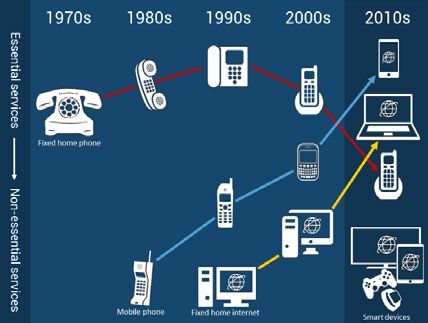
Consumers’ preferences for different types of communications services have also changed rapidly with
the emergence of new technologies. Services once viewed as luxuries, for example mobile phones, are
increasingly considered essential (Figure 4).
Figure 4. Essential and non-essential communications services, 1970s to 2010s
Source. BCAR (2017)
Bureau of Communications and Arts Research, Department of Communications and the ArtsTRENDS AND DRIVERS IN THE AFFORDABILITY OF COMMUNICATIONS SERVICES FOR AUSTRALIAN HOUSEHOLDS
As a consequence consumers are using more communications services than ever before, with more than 5
half of Australians (58 per cent) using five or more different types of communications services in the six
months to June 2016.4 In particular, a home broadband connection and internet-enabled mobile service
are now used by the majority of Australians. Australians’ access to internet-enabled mobile phones has
grown rapidly, from 8 per cent in 2006 to 76 per cent in 2016 (Figure 5).
Figure 5. Percentage of Australians accessing communications technologies, 2006 to 2016
100
80
60
Per cent %
40
20
0
Home internet Home internet Mobile phone (any) Mobile phone Fixed line home
connection (any) connection (internet-enabled) phone
(broadband)
2006 2016
Source. ACMA (2016), Communications report 2015–16; 2005–06
Notes. Access to home internet and broadband connections is reported at the household level (percentage of Australian households) in
2005–06 (shaded bars) and at the population level (percentage of Australians) in 2015–16. In 2005–06 the ACMA reported that around 90 per
cent of Australians had a fixed-line home phone. In 2015–16 the fixed-line home phone category includes managed VoIP services.
Similarly, consumer demand for data in Australia has grown rapidly over the past four years (Figure 6).
The volume of broadband data downloaded over the last quarter of 2016 exceeded 2.5 million
terabytes (TB). This was a 51 per cent higher than the 2015 December quarter, and 366 per cent higher
than for the same period in 2012.5
While demand for mobile handset data is much lower, it has grown at a much faster rate. Driven by the
ubiquity of smart phones, mobile handset data grew from 14,000TB to 146,000TB over the same four
year period; an impressive tenfold increase.
Bureau of Communications and Arts Research, Department of Communications and the ArtsTRENDS AND DRIVERS IN THE AFFORDABILITY OF COMMUNICATIONS SERVICES FOR AUSTRALIAN HOUSEHOLDS
6 Figure 6. Volume of data downloaded, Australia, December 2012–16
3,000,000
2,500,000
2,000,000
Terabytes (TB)
1,500,000
1,000,000
500,000
0
Dec 2012 Dec 2013 Dec 2014 Dec 2015 Dec 2016
Broadband Mobile handset
Source. ABS (2017), 8153.0 – Internet Activity, December 2016.
Notes. Data downloaded is reported for the three month period prior to the reference date.
This means the average mobile handset customer downloads 1.9GB per month, compared with 2.9GB
downloaded on dedicated wireless (fixed, mobile and satellite) connections and 117GB on fixed-line
broadband connections.6 This has shown rapid growth compared in four years—in December 2012, these
figures were 0.2GB, 1.5GB and 30.6GB respectively.
Households are getting better value from lower prices and more data
Real prices for mobile, internet and residential fixed-line voice services have fallen consistently over the
past decade, most significantly for fixed-line voice services (Figure 7). For internet and mobile services,
real prices have fallen since 2012–13, while nominal prices (that is, not adjusted for inflation) have largely
remained stable.
Bureau of Communications and Arts Research, Department of Communications and the ArtsTRENDS AND DRIVERS IN THE AFFORDABILITY OF COMMUNICATIONS SERVICES FOR AUSTRALIAN HOUSEHOLDS
Figure 7. Telecommunications services price indices 7
100
90
80
70
Index (2006-07 = 100)
60
50
40
30
20
10
0
2006-07 2007-08 2008-09 2009-10 2010-11 2011-12 2012-13 2013-14 2014-15 2015-16
Mobile Services Index Residential Fixed Voice Services Index Internet Services Index
Source. ACCC (2017), Competition in the Australian telecommunications sector: Price changes for telecommunications services in Australia,
p. 108, 110.
Notes. These indices capture movements in the cost of plans and are adjusted by the ACCC for inflation using the Consumer Price Index.
They do not directly account for changes in product inclusions such as data allowances for mobile and internet services.7 Fixed-line services do
not include residential VOIP.
Since 2012–13, product inclusions have also increased significantly. For example:
• ADSL data quotas grew by 32 per cent during 2015–16 following a 73 per cent increase in 2014–15
and a 47 per cent increase in 2013–14.8
• Data quotas for post-paid mobile services increased by an average of 30 per cent during 2015–16,
following significant increases of 119 per cent in 2014–15 and 78 per cent in 2013–14.9
• A number of internet and mobile service providers have also started bundling content and
entertainment offers into their plans at a discounted rate or for free where access to specific
content services is not included against data quotas.
Once these inclusions are taken into account, consumers are getting significantly greater value from their
communication services.
Bureau of Communications and Arts Research, Department of Communications and the ArtsTRENDS AND DRIVERS IN THE AFFORDABILITY OF COMMUNICATIONS SERVICES FOR AUSTRALIAN HOUSEHOLDS
8
Affordability of home broadband
Regional ADSL customers will benefit from the NBN
The NBN rollout is increasing the range of products available and providing more affordable alternatives
for some consumers, particularly in regional areas.
Based on currently advertised prices, regional ADSL customers switching to fixed-line and fixed wireless
NBN will be able to access a similar level of service at lower prices and have access to a wider choice
of plans. The BCAR compared fixed NBN plans (both fixed-line and fixed wireless NBN10), as well as
ADSL retail bundled plans, covering the advertised prices of select retail service providers representing
approximately 90 per cent of the fixed broadband market.11
Figure 8 shows that bundled plans offered by service providers over Telstra’s wholesale ADSL network
(off-net) are at higher price points than those offered by service providers on their own infrastructure
(onnet) and fixed NBN plans.12 In general, on-net plans are more widely available in metropolitan areas,
while off-net plans are mostly available in regional areas (see Box 1).
Figure 8. Number of fixed broadband bundle plans at price points (selected providers)
by technology, May 2017
Source. BCAR survey of advertised ADSL and NBN bundle plans offered by Telstra, Optus, iiNet, Internode, iPrimus, Belong, TPG and Dodo.
Notes. Includes plans advertised on provider websites as at 17 and 18 May 2017. Includes ADSL2+/fixed NBN broadband connections and
bundles. Where an active phone line is required, $25.95 (price of Telstra Home Phone Basic) is added to the monthly price of the plan. Where
contract length or bundled hardware affect the monthly connection fee, the option with the cheapest monthly fee is selected. Off-net plans
identified using known Telstra-only addresses and details from Critical Information Summaries. It is unknown if providers vary pricing regionally
(outside of technology type).
Bureau of Communications and Arts Research, Department of Communications and the ArtsTRENDS AND DRIVERS IN THE AFFORDABILITY OF COMMUNICATIONS SERVICES FOR AUSTRALIAN HOUSEHOLDS
9
Box 1. On-net and off-net ADSL services
ADSL connections require specialised networking equipment installed at the exchange. Internet
service providers (ISPs) can purchase and install this equipment (an ‘on-net’ connection) or
purchase wholesale ADSL connections from Telstra (an ‘off-net’ connection). On-net connections
are common at larger exchanges, typically in metropolitan areas or regional centres. Elsewhere,
most connections are off-net. Figure 9 shows that the vast majority of ADSL connections in
exchanges located primarily in regional areas (Bands 3 and 4) – are provided using Telstra’s
equipment, either by Telstra or off-net. In exchanges located primarily in metropolitan areas (in
Bands 1 and 2), just over half of ADSL connections are provided using non-Telstra infrastructure
(on-net).
ISPs offer different ADSL products to on-net and off-net customers. As a result, there are
significant regional differences in the cost of ADSL.
Figure 9. ADSL connections by equipment, 2016
100
80
60
Per cent %
40
20
0
Overall Bands 1 & 2 (mostly metropolitan) Bands 3 & 4 (mostly regional)
Telstra's equipment Other provider's equipment
Source. ACCC (2016), Wholesale ADSL service declaration inquiry – discussion paper, p. 22.
Notes. includes both wholesale and retail connections. Non-Telstra connections are predominantly retail, with the ACCC commenting
that as at June 2015, ADSL resale competition was extremely limited. Precise figures are commercial-in-confidence.
Off-net ADSL bundle plans are generally more expensive than on-net ADSL and NBN plans (excluding satellite) offering equivalent
data allowances (Figure 10). Off-peak data inclusions are essentially offered by one provider (TPG) on their ADSL plans and have been
excluded from the analysis.
Bureau of Communications and Arts Research, Department of Communications and the ArtsTRENDS AND DRIVERS IN THE AFFORDABILITY OF COMMUNICATIONS SERVICES FOR AUSTRALIAN HOUSEHOLDS
10 Figure 10. Distribution of fixed broadband bundle plans by price and included data for
selected providers, May 2017
140
120
100
Price per month ($)
80
60
40
20
0
0 200 400 600 800 1000 1200
Unlimited
On peak data per month (GB)
On-Net ADSL Fixed NBN Off-net ADSL Series4
Source. BCAR survey of advertised ADSL and NBN bundle plans offered by Telstra, Optus, iiNet, Internode, iPrimus, TPG, Belong and Dodo.
Notes. Includes plans advertised on provider websites as of 17 and 18 May 2017. Includes ADSL2+/Fixed-line NBN broadband connections and
bundles. Where an active phone line is required, $25.95 (price of Telstra Home Phone Basic) is added to the monthly price of the plan. Where
contract length or bundled hardware affect the monthly connection fee, the option with the cheapest monthly fee is selected. Offnet plans
identified using known Telstra-only addresses and details from Critical Information Summaries. It is unknown if providers vary pricing regionally
(outside of technology type).
Metropolitan ADSL customers who switch to the NBN will be at least as well off, as the advertised prices
of plans and included data are broadly comparable to those offered on the NBN at the basic speed tier
(12/1 Mbps).13 On-net ADSL and fixed NBN broadband connections and broadband-voice bundle plans
are available at similar price points, and the price of plans appears to be similar when data allowances are
taken into account.
NBN Co Limited (nbn) aims to activate 8.1 million premises by 2020, with 7.6 million of these premises
(93.8 per cent) connected to the NBN using fixed-line technology. A further 300,000 active premises
(3.7 per cent) will have their broadband delivered on fixed wireless technology, with the remaining 200,000
premises (2.5 per cent) connected through the NBN satellite.14
For many households without access to fixed broadband, NBN satellite is able to provide access to
high-speed broadband services with an on-peak data allowance of less than 40GB per month at a price
that is only marginally more expensive than comparable fixed-line or fixed wireless NBN plans (Figure 11).
Above 40GB per month, however, ADSL and NBN fixed-line and fixed wireless plans are cheaper than NBN
satellite plans (Figure 12).
Bureau of Communications and Arts Research, Department of Communications and the ArtsTRENDS AND DRIVERS IN THE AFFORDABILITY OF COMMUNICATIONS SERVICES FOR AUSTRALIAN HOUSEHOLDS
Notwithstanding this, prior to the rollout of the Sky Muster satellite, there were in practice no broadband 11
options (such as ADSL) available for some locations due to their remoteness. As such, caution should
be taken when comparing ADSL affordability with the affordability of the satellite. In addition, there have
been recent changes to the Sky Muster service that should improve the affordability of the satellite
service — in particular nbn’s recent announcement that it has changed its Fair Use Policy to increase the
wholesale average peak download usage by 50 per cent and doubled the maximum usage allowed per
customer, and kept wholesale prices the same.
This analysis does not include satellite plans delivered as part of the ‘Sky Muster Education Port’ service,
which provides existing satellite households with an additional 50GB per student using the internet as
their primary means of education.
Figure 11. Distribution of NBN satellite plans and low data fixed NBN plans by price and
included on-peak data allowance for selected providers, May 2017
250
200
Price per month ($)
150
100
50
0
0 10 20 30 40 50 60 70 80
On peak data per month (GB)
12Mbps Satellite 25Mbps Satellite Fixed NBN (TRENDS AND DRIVERS IN THE AFFORDABILITY OF COMMUNICATIONS SERVICES FOR AUSTRALIAN HOUSEHOLDS
12 Figure 12. Distribution of NBN satellite plans and off-net ADSL plans by price and
included on-peak data allowance for selected providers May 2017
250
200
Price per month ($)
150
100
50
0
0 200 400 600 800 1000 1200
Unlimited
On peak data per month (GB)
12Mbps Satellite 25Mbps Satellite Off-net ADSL Series4
Source. BCAR survey of advertised NBN satellite plans offered by Activ8me, SkyMesh, Harbour ISP, IPSTAR, iiNet, reachnet, Ant Communications,
BorderNET, Clear Networks; and off-net bundle plans offered by Telstra, Optus, iiNet, Internode, iPrimus, TPG, Belong and Dodo.
Notes. Off-peak data has been excluded from the analysis. Satellite-voice bundles and ‘night-owl’ satellite plans, which combine small on-peak
inclusions with larger off-peak inclusions, have also been excluded. Contract term for each of the advertised NBN satellite plans included in the
analysis is one month or less. There is no connection fee associated with these plans, with the exception of iiNet plans which have a $99.95
activation fee (this fee is not applicable if consumers choose to sign-up for a 24 month contract term). NBN satellite connections are available
at either a 12/1 Mbps or 25/5 Mbps speed tier. At the end of Q4 2016, two-thirds of NBN satellite services in operation (AVCs) were at the 25/5
speed tier with the remaining third at the 12/1 speed tier (NBN Wholesale Market Indicators Report 31 December 2016). All of the providers
surveyed charge an additional $5 per month to upgrade to the 25/5 Mbps speed tier.
With home broadband increasingly regarded as an essential service, there is good news for households
given real prices have fallen in recent years, including for some entry-level plans.
Data collected by the ACCC on the prices of broadband bundles including fixed bundles advertised on the
websites of selected retail service providers (such as Telstra, Belong, Optus, iiNet and iPrimus) suggests
that average prices for fixed-line and fixed wireless NBN, on-net ADSL and off-net ADSL bundles remained
broadly constant between June 2014 and June 2016 (Figure 13). Once accounting for the rate of inflation
in the rest of the economy, the real price of fixed broadband bundles offered by the included providers has
declined in recent years.
Bureau of Communications and Arts Research, Department of Communications and the ArtsTRENDS AND DRIVERS IN THE AFFORDABILITY OF COMMUNICATIONS SERVICES FOR AUSTRALIAN HOUSEHOLDS
Figure 13. Average bundle prices for on-net ADSL, off-net ADSL and fixed NBN plans 13
(selected providers) over the period June 2014 to June 2016
120
100
Average price per month ($)
80
60
40
20
0
Jun 2014 Dec 2014 Jun 2015 Dec 2015 Jun 2016
On-net ADSL Fixed NBN Off-net ADSL
Source. Advertised service plan data compiled by the ACCC. Includes fixed bundles (phone and internet) advertised by the following retail
service providers: Telstra, Belong, Optus, TPG, iiNet and iPrimus.
Notes. Prices have not been adjusted for inflation. Off-net plans include connections at Zone 2 and 3 exchanges for Telstra and Belong. Some
providers are not available on all types of connection.
…as data allowances increase
Providers are increasing their data allowances in response to growing consumer demand. Between 2014
and 2016 the average amount of data included in plans increased significantly, particularly for fixed NBN
and on-net ADSL plans (Figure 14).
Bureau of Communications and Arts Research, Department of Communications and the ArtsTRENDS AND DRIVERS IN THE AFFORDABILITY OF COMMUNICATIONS SERVICES FOR AUSTRALIAN HOUSEHOLDS
14 Figure 14. Average monthly data included with on-net ADSL, off-net ADSL and fixed NBN
plans (selected providers) over the period June 2014 to June 2016
800
700
600
Average on peak data per month (GB)
500
400
300
200
100
0
Jun 2014 Dec 2014 Jun 2015 Dec 2015 Jun 2016
On-net ADSL Fixed NBN Off-net ADSL
Source. Advertised service plan data compiled by the ACCC. Includes fixed bundles (phone and internet) advertised by the following retail
service providers: Telstra, Belong, Optus, TPG, iiNet and iPrimus.
Notes. Unlimited plans recorded as 1500GB. Off-net plans include connections at Zone 2 and 3 exchanges for Telstra and Belong. Off-peak data
was excluded from the analysis. Some providers are not available on all types of connection.
In general, providers increasingly offered more plans with on-peak data inclusions in excess of 500GB per
month, with only a marginal increase in monthly prices.
This shift to plans with larger data allowances has contributed to the increase in average data downloads,
as providers have removed smaller plans. However, increases to data inclusions are not uniform across
different retail service providers and market segments (Figure 15)
Bureau of Communications and Arts Research, Department of Communications and the ArtsTRENDS AND DRIVERS IN THE AFFORDABILITY OF COMMUNICATIONS SERVICES FOR AUSTRALIAN HOUSEHOLDS
Figure 15. Proportion of advertised plans including more than 500GB per month 15
(selected providers), by technology
Fixed NBN
100
80
60
40
20
0
Q3-4 2014 Q1-2 2015 Q3-4 2015 Q1-2 2016
On-net ADSL
100
80
Per cent %
60
40
20
0
Q3-4 2014 Q1-2 2015 Q3-4 2015 Q1-2 2016
Off-net ADSL
100
80
60
40
20
0
Q3-4 2014 Q1-2 2015 Q3-4 2015 Q1-2 2016
Large plans Small plans
Source. Advertised service plan data compiled by the ACCC. Includes fixed bundles (phone and internet) advertised by the following retail
service providers: Telstra, Belong, Optus, TPG, iiNet and iPrimus.
Notes. Large plans included more than 500GB per month of on-peak data, or unlimited data. Off-net plans include price of Telstra connection at
Zone 2 and 3 exchanges. Some providers are not available on all types of connection.
Bureau of Communications and Arts Research, Department of Communications and the ArtsTRENDS AND DRIVERS IN THE AFFORDABILITY OF COMMUNICATIONS SERVICES FOR AUSTRALIAN HOUSEHOLDS
16 Prices of entry-level broadband bundle plans are stable, but with
increased data inclusions for some plans
Low-income or low-demand consumers have seen the price of entry-level plans fall in real terms.
Entry-level broadband bundles are defined as the cheapest plan including at least 40GB per month offered
by each provider included in the survey.
Monthly nominal prices for entry-level plans remained relatively constant over the period from June 2014
to June 2016 (Figure 16), which means prices have declined when adjusted for inflation. In terms of data
inclusions, some of these consumers are better off as some providers have increased data allowances
for entry-level plans over the period.
Off-net ADSL entry-level plans were generally more expensive than on-net ADSL and fixed NBN plans
over this period.
Bureau of Communications and Arts Research, Department of Communications and the ArtsTRENDS AND DRIVERS IN THE AFFORDABILITY OF COMMUNICATIONS SERVICES FOR AUSTRALIAN HOUSEHOLDS
Figure 16. Average price and price range for entry-level fixed broadband bundles 17
(selected providers) over the period June 2014 to June 2016, by technology
Fixed NBN
100
80
60
40
On-net ADSL
100
Price per month ($)
80
60
40
Off-net ADSL
100
80
60
40
Jun 2014 Dec 2014 Jun 2015 Dec 2015 Jun 2016
Price range Average price
Source. Advertised service plan data compiled by the ACCC. Includes fixed bundles (phone and internet) advertised by the following retail
service providers: Telstra, Belong, Optus, TPG, iiNet and iPrimus.
Notes. Entry-level plans defined as the cheapest bundle including at least 40GB data per month of on-peak data for each provider. Prices have
not been adjusted for inflation. Off-net plans include connections at Zone 2 and 3 exchanges for Telstra and Belong. Some providers are not
available on all types of connection.
Bureau of Communications and Arts Research, Department of Communications and the ArtsTRENDS AND DRIVERS IN THE AFFORDABILITY OF COMMUNICATIONS SERVICES FOR AUSTRALIAN HOUSEHOLDS
18
Affordability of mobile services
There is a wide range of options for mobile customers, including at
lower price points
Most mobile customers enjoy substantial choice when selecting a mobile plan. As at May 2017, the range
of mobile services included pre and post-paid plans, at various price points, and with a range of data and
voice inclusions. Customers who can access services from multiple mobile networks are better placed to
tailor their choice of plan to suit their particular data and call needs.
The amount of data included in a plan tends to drive its price, with a strong positive relationship between
price and data inclusions (Figure 17). There is also a strong relationship between data inclusions and
the number of plans available to consumers. For instance, consumers with average data requirements
— around 2GB per month — have the greatest choice, with a number of products offered at lower price
points.15 Large data users have more limited choice, with fewer plans available providing more than 12GB
per month.
The relationship between a plan’s monthly price and its call inclusions is less clear. Unlimited calls are
common, being included in more than half of the plans surveyed. Unlimited calls are a standard feature
of plans with large data inclusions, but are also available at lower monthly costs ($25) (Figure 17).
This suggests customers can cheaply access unlimited calls, irrespective of their data use.
Figure 17. Price vs included data, by limited or unlimited calls
120
100
Price per month or recharge ($)
80
60
40
20
0
0 5 10 15 20 25 30 35
Data per month (GB)
Unlimited calls Limited calls Average data use
Source. BCAR survey of advertised mobile plans offered by Telstra, Optus, Vodafone, Amaysim, Virgin, Aldi, Boost, TPG. Excludes 32 prepaid
plans with an expiry period of more than 1 month.
Notes. Plans advertised on provider websites in May. Blue circles are plans that include unlimited calls, other plans are red circles. Darker circles
indicate numerous plans at the same data point. Plans closest to the bottom of the chart are the cheapest option for each amount of included data.
The vertical blue line is the average Australian mobile consumption as at December 2016 (ABS 8153.0 Internet Activity, Australia, December 2016).
Excludes plans with bundled hardware, such as an included handset.
Bureau of Communications and Arts Research, Department of Communications and the ArtsTRENDS AND DRIVERS IN THE AFFORDABILITY OF COMMUNICATIONS SERVICES FOR AUSTRALIAN HOUSEHOLDS
Both the price and availability of prepaid plans are crucial to the affordability of mobile services, as 19
prepaid services are heavily used by more vulnerable groups. For example, prepaid plans are often
favoured by low income customers,16 often as a way to control their expenditure,17 and are also accessible
to customers with limited access to credit or banking services.
Consumers who require prepaid services are generally well served in terms of price and choice. In
particular, prepaid products dominate the cheapest end of the market (less than $25 a month and 2GB
of included data), while post-paid offers are generally only available for $25 a month or more. Consumers
can also access unlimited calls on prepaid plans at a lower monthly cost (around $30).
Many prepaid plans are available with up to 12–15GB per month (Figure 18) at comparable prices to
post-paid services. However, prepaid plans tend not to be available with large amounts of data (inclusions
greater than 15GB). Large mobile data users are therefore limited to post-paid products.
A number of prepaid plans offered longer expiry periods (typically 12 months), but with more limited data
and call inclusions. Despite offering significantly worse value on a per-call or per-GB basis, these plans
may represent a cost effective solution for extremely low use customers, as they can be used over an
extended period. An analysis of some of these plans by carrier is at Table 2.
Figure 18. Price vs Included data, by payment type
120
100
Price per month or recharge ($)
80
60
40
20
0
0 5 10 15 20 25 30 35
Data per month (GB)
Post-paid Prepaid Average data use
Source. BCAR survey of advertised mobile plans offered by Telstra, Optus, Vodafone, Amaysim, Virgin, Aldi, Boost, TPG. Excludes 32 prepaid
plans with an expiry period of more than 1 month.
Notes. Plans advertised on provider websites in May. Blue circles are post-paid plans, prepaid plans are red circles. Darker circles indicate
numerous plans at the same data point. Plans closest to the bottom of the chart are the cheapest option for each amount of included data.
The vertical blue line is the average Australian mobile consumption as at December 2016 (ABS 8153.0 Internet Activity, Australia, December
2016). Excludes plans with bundled hardware, such as an included handset.
Bureau of Communications and Arts Research, Department of Communications and the ArtsTRENDS AND DRIVERS IN THE AFFORDABILITY OF COMMUNICATIONS SERVICES FOR AUSTRALIAN HOUSEHOLDS
20 …providing regional consumers with more choice
Although carriers apply nationally consistent pricing, the range of mobile products on offer varies across
locations due to differences in the coverage of both mobile network operators (MNOs) and mobile virtual
network operators (MVNOs) (Box 2). This variation can impact choice and affordability, particularly for
regional and remote areas.
Telstra has the largest footprint of any mobile carrier, both in terms of population reach (Table 1) and
geographic coverage. For approximately 1 million km2 (around 13 per cent of Australia), Telstra is the only
available mobile network, although this area includes less than 1 per cent of the Australian population.18
This means that some regional customers only access mobile plans provided on the Telstra network.
Table 1. Mobile coverage, percentage of the Australian population, 2016
3G coverage 4G coverage
(% of population) (% of population)
Telstra 99.3 98
Optus 98.5 95
VHA (Vodafone) 97 96.9
Source. ACCC (2016), Domestic Mobile Roaming Declaration Inquiry 2016 – Discussion Paper
As with other MNOs, Telstra resells large sections of its network to MVNOs such as Boost and Aldi. The
addition of these MVNOs has increased the choice of products available to regional areas. When taking
into account the plans offered by these resellers, services offered over the Telstra network were broadly
comparable to other networks in terms of price. For plans with large data inclusions (i.e. greater than
10GB), there tended to be fewer available on the Telstra network and they tended to be more expensive.
Box 2: MNOs vs MVNOs
Mobile network operators (MNOs) build and operate the physical equipment that provides mobile
services. There are three MNOs currently operating in Australian (Telstra, Optus and Vodafone),
with a fourth (TPG) set to enter the market in 2018.
As well as selling mobile services directly to customers, MNOs also offer provision services
for resellers, or mobile virtual network operators (MVNOs), on a wholesale basis. An MNO can
sell access to some or all of its network, and to a subset of technologies (i.e. 3G/4G, and at
differing speeds).
Desktop research was conducted in May 2017, and recorded mobile plans advertised on MNO and
MNVO websites. Both prepaid and post-paid plans were recorded. Post-paid plans that included a
handset were excluded, to allow for immediate comparison with prepaid plans.
Bureau of Communications and Arts Research, Department of Communications and the ArtsTRENDS AND DRIVERS IN THE AFFORDABILITY OF COMMUNICATIONS SERVICES FOR AUSTRALIAN HOUSEHOLDS
Figure 19. Price versus included data, by Telstra or non-Telstra network 21
120
100
Price per month or recharge ($)
80
60
40
20
0
0 5 10 15 20 25 30 35
Data per month (GB)
Telstra network Other networks Average data use
Source. BCAR survey of advertised mobile plans offered by Telstra, Optus, Vodafone, Amaysim, Virgin, Aldi, Boost, TPG. Excludes 32 prepaid
plans with an expiry period of more than 1 month.
Notes. Plans advertised on provider websites in May 2017. Red circles are plans available on the Telstra network, other plans are blue circles.
Darker circles indicate numerous plans at the same data point. Plans closest to the bottom of the chart are the cheapest option for each
amount of included data. The vertical blue line is the average Australian mobile consumption as at December 2016 (ABS 8153.0 Internet
Activity, Australia, December 2016). Excludes plans with bundled hardware, such as an included handset.
The overall picture for Telstra’s resale of access to its mobile network is unclear. Boost appears to have
access to the entire network, whilst Aldi appears to access a large proportion of the network, particularly
in eastern Australia. Customers who are only able to access Telstra’s retail mobile services (and not those
from MVNOs) would have a more limited range of offers and generally higher prices (Figure 20).
Bureau of Communications and Arts Research, Department of Communications and the ArtsTRENDS AND DRIVERS IN THE AFFORDABILITY OF COMMUNICATIONS SERVICES FOR AUSTRALIAN HOUSEHOLDS
22 Figure 20. Price vs included data for plans on the Telstra network, by Telstra or MVNOs
120
100
Price per month or recharge ($)
80
60
40
20
0
0 5 10 15 20 25 30 35
Data per month (GB)
Telstra MVNOs on the Telstra network Average data use
Source. BCAR survey of advertised mobile plans offered by Telstra, Aldi, and Boost. Excludes 32 prepaid plans with an expiry period of more
than 1 month.
Notes. Plans advertised on provider websites in May 2017. Red circles are plans provided directly by Telstra, while MVNO plans provided on the
Telstra network are blue circles. Darker circles indicate numerous plans at the same data point. Plans closest to the bottom of the chart are the
cheapest option for each amount of included data. The vertical blue line is the average Australian mobile consumption as at December 2016
(ABS 8153.0 Internet Activity, Australia, December 2016). Excludes plans with bundled hardware, such as an included handset.
Telstra’s prepaid cap plans are broadly comparable to competitor offers in terms of price and inclusions,
while its sim-only post-paid plans offer slightly less value. Telstra’s long-life prepaid plans appear to
offer significantly less value, in terms of both voice and data, than the other providers surveyed, with the
exception of Virgin (Table 2). However, there are some more cost effective long-life plans offered on the
Telstra network, such as those through ALDI.
Table 2. Selected long-life prepaid plans, call and data costs, May 2017
Plan (provider) Expiry period Price per Mb ($) Price of a two-minute
call
Prepaid Long Life (Telstra) 2–12 Months19 2 1.95
Prepaid Long Life (Virgin) 6–12 Months20 0.12 1.96
Pay As You Go (ALDI) 12 Months 0.05 0.24
Pay As You Go (Amaysim) 12 Months 0.072 0.24
Pay As You Go Plus (Vodafone) 12 Months 0.02 0.4
Bureau of Communications and Arts Research, Department of Communications and the ArtsTRENDS AND DRIVERS IN THE AFFORDABILITY OF COMMUNICATIONS SERVICES FOR AUSTRALIAN HOUSEHOLDS
The range of both post-paid and prepaid plans has increased… 23
Over the past three years there appears to have been a significant increase in the range of post-paid
products on offer to consumers. Over this period, data and voice inclusions have increased significantly,
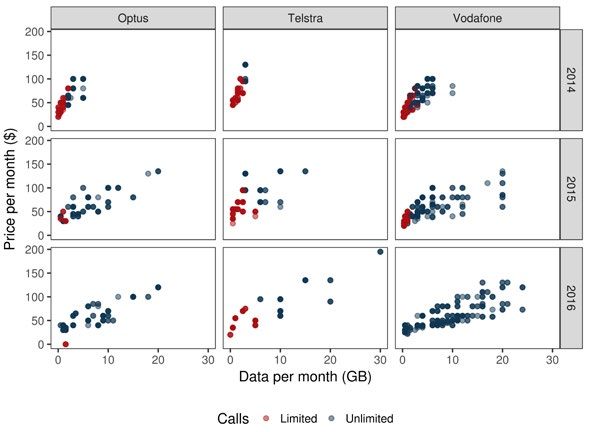
particularly for more expensive plans offered by Optus and Vodafone (Figure 21). By contrast, the price
of existing advertised plans appears to have remained relatively constant, though some expensive plans
with higher data inclusions have been introduced.
Figure 21. MNO post-paid plans, 2014–16
Source. Advertised service plan data compiled by the ACCC. Includes post-paid plans offered by Mobile Network Operators (MNOs).
Notes. Plans advertised by the following providers: Telstra, Optus, Vodafone. Collected on a monthly basis by the ACCC from January 2014
to November 2016. Blue circles are plans that include unlimited calls, other plans are red circles. Darker circles indicate numerous plans at
the same data point. Plans closest to the bottom of the chart are the cheapest option for each amount of included data. Prices have not been
adjusted for inflation.
There is a similar story for prepaid plans, where a broader range of prepaid products have become
available over the past three years. Similar to the trends observed in post-paid, many plans included
greater data and voice allowances in 2016 than 2014 without substantial increases in monthly costs,
particularly from Optus and Vodafone. However, data and voice allowances offered by Telstra have lagged
behind offerings from Optus and Vodafone. Prepaid plans have continued to offer more limited inclusions
at a lower monthly price than post-paid plans.
Bureau of Communications and Arts Research, Department of Communications and the ArtsTRENDS AND DRIVERS IN THE AFFORDABILITY OF COMMUNICATIONS SERVICES FOR AUSTRALIAN HOUSEHOLDS
24 Figure 22. MNO prepaid plans, 2014–16
Source. Advertised service plan data compiled by the ACCC. Includes prepaid plans offered by Mobile Network Operators (MNOs).
Notes. Plans advertised by the following providers: Telstra, Optus, Vodafone. Collected on a monthly basis by the ACCC from March 2014 to
November 2016. Blue circles are plans that include unlimited calls, other plans are red circles. Darker circles indicate numerous plans at the
same data point. Plans closest to the bottom of the chart are the cheapest option for each amount of included data. Prices have not been
adjusted for inflation.
Consumers appear to be better off because of lower real prices and the inclusion of more data. With
prices broadly constant in nominal terms for prepaid and postpaid plans over the past three years both
prepaid and post-paid prices have declined in real terms. Additionally, some customers are likely to be
receiving significantly more calls and data with their mobile plans.
…including for mobile wireless broadband
Similar to mobile services, research of advertised prices for mobile wireless broadband services (wireless
services) indicates that most consumers have access to a range of products across a range of price
points (for both prepaid and post-paid plans).
As with mobile handset plans, data is a driver of the price of wireless products. Consumers have a
considerable choice of wireless products below 12–15GB, especially for those with average data
requirements of around 3GB per month (Figure 23).21
Bureau of Communications and Arts Research, Department of Communications and the ArtsTRENDS AND DRIVERS IN THE AFFORDABILITY OF COMMUNICATIONS SERVICES FOR AUSTRALIAN HOUSEHOLDS
Figure 23. Mobile Wireless Broadband Price vs Included data, by payment type 25
200
180
160
Price per month or recharge ($)
140
120
100
80
60
40
20
0
0 10 20 30 40 50 60 70
Data per month (GB)
Prepaid Post-paid Average data use
Source. BCAR desktop research of advertised mobile wireless broadband plans offered by Telstra, Optus, Vodafone, Amaysim, Virgin and Aldi
(TPG and Boost did not offer data-only mobile broadband plans).
Notes. Plans advertised on provider websites in May 2017. Blue dots are post-paid plans, red dots are prepaid plans. Darker circles indicate
numerous plans at the same data point. Plans closest to the bottom of the chart are the cheapest option for each amount of included data.
A number of plans had expiry periods of less than one month. These have been adjusted to reflect the cost and data available if a customer
was to maintain service over a one month period. The vertical blue line is the average Australian mobile wireless broadband consumption as at
December 2016 (ABS 8153.0 Internet Activity, Australia, December 2016). Plans which bundle hardware (i.e. mobile broadband dongles) have
been excluded.
In terms of data inclusions, there are more plans with larger data inclusions (12GB and over) offered for
post-paid wireless compared to prepaid. With the exception of a few plans, these larger prepaid plans are
more expensive than post-paid plans with the same data inclusions.
While most low-end post-paid and prepaid mobile plans are fairly comparable in terms of data included,
the amount of data included for wireless services varies significantly. For example a number of prepaid
plans with data inclusions up to 20–30GB are offered at higher price points. This could be due to the large
difference in expiry dates for products (one week up to two years).22
Prices could also be influenced by the degree of competition in wireless services compared to mobile
services. As at June 2016, Telstra’s retail share of the market for mobile wireless services (65 per cent)
was much higher than its share of the market for mobile handset services (45 per cent). The wireless
market share of the other MNOs was just 20 per cent; 13 per cent for Optus and 7 per cent for Vodafone.23
The ACCC reports that prices paid for wireless services increased by 6.4 per cent during 2015–16 and
average data inclusions also increased significantly by 91 per cent.24 This increase is a result of average
and higher spending consumer groups spending significantly more on wireless services.
Bureau of Communications and Arts Research, Department of Communications and the ArtsTRENDS AND DRIVERS IN THE AFFORDABILITY OF COMMUNICATIONS SERVICES FOR AUSTRALIAN HOUSEHOLDS
26 The volume of mobile and wireless data downloaded by users has increased significantly in recent years,
especially from 2015 onwards (Figure 24).
Figure 24. Mobile handset versus mobile wireless broadband data downloaded per
connection
3.5
Average monthly download per connection (GB)
3
2.5
2
1.5
1
0.5
0
2011 2012 2013 2014 2015 2016
Mobile Wireless Broadband Mobile Handsets
Source. ABS (2017), 8153.0 – Internet Activity, Australia, December 2016
Bureau of Communications and Arts Research, Department of Communications and the ArtsTRENDS AND DRIVERS IN THE AFFORDABILITY OF COMMUNICATIONS SERVICES FOR AUSTRALIAN HOUSEHOLDS
Affordability outcomes for particular 27
households
Aggregate affordability measures, which reflect the outcome for the ‘average’ household, are not
sufficient to draw inferences of affordability for some groups. This is because costs and products vary
across different communications services, market segments and geographic regions.
This variance may disproportionately impact on low income, vulnerable groups — which includes
households where at least one member is not employed, has a long term health condition, is aged 65
years and over, or is Aboriginal or Torres Strait Islander, as well as rural households.
Lower-income households spend a larger proportion of their income
on communications services
In 2015, the bottom 10 per cent of households by income spent almost 10 per cent of their disposable
income on communications services, compared with the top 10 per cent of households, who spent
approximately 1 per cent of their disposable income. The average spend was 3.5 per cent of disposable
income across all households (Figure 25).
Figure 25. Average share of household disposable income spent on mobile and fixed-line
telephone rent, calls and internet charges, by household disposable income decile, 2015
12.0
10.0
8.0
Per cent %
6.0
4.0
2.0
0.0
1 2 3 4 5 6 7 8 9 10
Source. The Household Income and Labour Dynamics in Australia (HILDA) Survey, Release 15.
Notes. Analysis excludes a small number of households with an expenditure share equal to zero or equal to 100 per cent or greater.
Bureau of Communications and Arts Research, Department of Communications and the ArtsYou can also read