Feedback attribution to dry heatwaves over East Asia
←
→
Page content transcription
If your browser does not render page correctly, please read the page content below
LETTER • OPEN ACCESS
                                                                                                  Recent citations
Feedback attribution to dry heatwaves over East                                                       - Projected response of global runoff to El
Asia                                                                                                    Niño-Southern oscillation
                                                                                                        Thanh Le et al

To cite this article: Ye-Won Seo et al 2021 Environ. Res. Lett. 16 064003

View the article online for updates and enhancements.

                               This content was downloaded from IP address 46.4.80.155 on 10/09/2021 at 08:47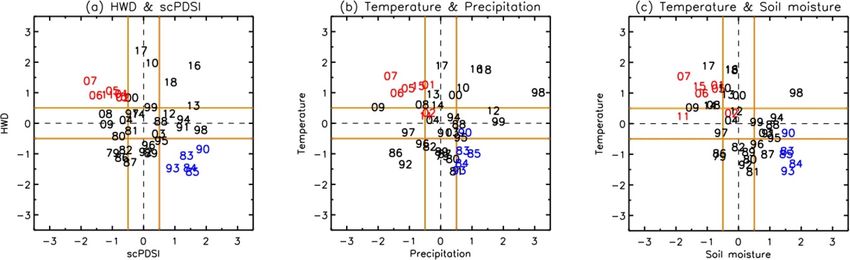
Environ. Res. Lett. 16 (2021) 064003 https://doi.org/10.1088/1748-9326/abf18f
LETTER
Feedback attribution to dry heatwaves over East Asia
OPEN ACCESS
Ye-Won Seo1,2, Kyung-Ja Ha1,2,3,∗ and Tae-Won Park4
RECEIVED 1
14 December 2020 Center for Climate Physics, Institute for Basic Science, Busan, Republic of Korea
2
Department of Atmospheric Sciences, Pusan National University, Busan, Republic of Korea
REVISED 3
BK21 School of Earth and Environmental Systems, Pusan National University, Busan, Republic of Korea
10 March 2021 4
Department of Earth Science Education, Chonnam National University, Gwangju, Republic of Korea
ACCEPTED FOR PUBLICATION ∗
Author to whom any correspondence should be addressed.
23 March 2021
E-mail: kjha@pusan.ac.kr
PUBLISHED
17 May 2021
Keywords: heatwave, drought, feedback attribution, East Asia, CFRAM
Supplementary material for this article is available online
Original content from
this work may be used
under the terms of the
Creative Commons
Attribution 4.0 licence. Abstract
Any further distribution Summer heatwave events have exhibited increasing trends, with sudden increases occurring since
of this work must
maintain attribution to the early 2000s over northeastern China and along the northern boundary of Mongolia. However,
the author(s) and the title
of the work, journal
the mechanism behind heatwaves remains unexplored. To quantitatively examine the feedback
citation and DOI. attribution of concurrent events related to surface temperature anomalies, the coupled
atmosphere–surface climate feedback-response analysis method based on the total energy balance
within the atmosphere–surface column was applied. The results demonstrate that the
contributions of the latent heat flux and surface dynamic processes served as positive feedback for
surface warming by reducing the heat release from the surface to the atmosphere because of
deficient soil moisture based on dry conditions. Cloud feedback also led to warm temperature
anomalies through increasing solar insolation caused by decreasing cloud amounts associated with
anomalous high-pressure systems. In contrast, the sensible heat flux played a role in reducing the
warm temperature anomalies by the emission of heat from the surface. Atmospheric dynamic
feedback led to cold anomalies. The influence of ozone, surface albedo, and water vapor processes
is very weak. This study provides a better understanding of combined extreme climate events in the
context of radiative and dynamic feedback processes.
1. Introduction 2015, Zscheischler et al 2018, Kong et al 2020,
Yu and Zhai 2020). For instance, Mazdiyasni and
Extreme climatic events can occur simultaneously, AghaKouchak (2015) reported no statistically signi-
exacerbating the associated environmental and soci- ficant trend in drought risk in the southern and west-
etal impacts. Most analyses of climate and weather ern United States; however, the risk of simultaneous
extremes tend to focus on a single climate event, such severe drought and heatwaves increased sharply. A
as heatwaves, droughts, floods, and storms. How- study related to concurrent droughts and heatwaves
ever, this univariate approach may underestimate the over India also examined the substantial increase in
effects of concurrent and compound extremes. the frequency of concurrent events and their spa-
The interaction and dependence between tem- tial extent over India in recent years (Sharma and
perature and precipitation have been widely recog- Mujumdar 2017). Over the past few decades, frequent
nized (Hao et al 2013, Shukla et al 2014, Seo et al heatwaves associated with severe drought and deser-
2018). Recent research suggests that combined pre- tification trends during summer have been observed
cipitation and temperature effects may be more in northern China (Li et al 2019b, Kong et al 2020, Yu
important than their respective individual effects and Zhai 2020).
(Trenberth et al 2014). Several studies have focused Previous studies have investigated the mechan-
on severe droughts that occurred corresponding to isms of concurrent heatwave and drought events from
record-breaking temperature events in many regions, the perspective of dynamical processes associated
including Asia, Europe, India, and North America with large-scale atmospheric circulation. High-
(Perkins et al 2012, Mazdiyasni and AghaKouchak pressure anomalies are representative characteristics
© 2021 The Author(s). Published by IOP Publishing LtdEnviron. Res. Lett. 16 (2021) 064003 Y-W Seo et al
of most concurrent heatwave and drought events (CFRAM) (Cai and Lu 2009, Lu and Cai 2009)
(Fischer et al 2007, Zampieri et al 2009); however, to estimate quantitative contributions of individual
atmospheric circulation alone is not sufficient to radiative and dynamical processes including albedo,
explain the maintenance of compound events since cloud, water vapor, ozone, sensible/latent heat flux,
concurrent heatwaves and droughts that are driven surface and atmospheric dynamics to the temperat-
only by high-pressure systems occur on much shorter ure changes related to dry heatwaves. The advant-
timescales, such as a span of few days. The monsoon age of the CFRAM is that radiative and non-radiative
climate of East Asia is a crucial factor in understand- processes can be decomposed. This methodology can
ing extreme temperature and hydrological events over help us gain a better understanding of the tem-
the region. Ding et al (2007) indicated that a signi- perature anomaly sources. The CFRAM has been
ficant weakening of the East Asian summer monsoon applied to quantify the relative contributions of radi-
over the recent 20 year period was caused by a south- ative and dynamical feedbacks to the surface and
ward shift of the tropical upper-level easterly jet. This atmospheric temperature anomalies associated with
weakening caused northern and northeastern China polar warming amplification (Taylor et al 2013),
to suffer from droughts, whereas the Yangtze River the Northern annular mode (Deng et al 2013), the
basin and southern China exhibited marked increases Siberian high variability (Park et al 2015), the El
in precipitation. This implies that the large-scale Niño–Southern Oscillation (Park et al 2012, Hu et al
atmospheric circulation and intrinsic regional cli- 2016), and the East Asian winter monsoon vari-
mate characteristics provide favorable conditions for ations (Li and Yang 2017). Their results show that
maintaining and strengthening hot and dry extreme the CFRAM is an efficient analysis to evaluate and
events. understand which process is crucial for modulat-
Even though anomalous anticyclonic circula- ing surface and atmospheric temperature. There-
tion exists, land and atmosphere interactions are fore, the goal of this study is to understand the key
necessary for simultaneous heatwaves and droughts contributors among various feedback processes for
(Fischer et al 2007, Lorenz et al 2010, Whan et al the changes in concurrent heatwave-induced surface
2015). The land–atmosphere feedback processes ini- temperature anomalies using the CFRAM. We discuss
tiated by soil moisture anomalies can strongly mod- the changes in surface temperature between strong
ulate near-surface heat and aridity through high- and normal dry heatwave years attributed to indi-
pressure systems in the mid-troposphere (Miralles vidual feedback processes and examine the physical
et al 2014, 2019, Wang et al 2019). Previous stud- mechanisms for the features of dry heatwaves over
ies have indicated that dry soil conditions with per- East Asia.
sistent anticyclonic circulation would amplify soil
moisture–temperature feedback and reinforce sur-
face warming (Zampieri et al 2009, Rohini et al 2. Methods
2016). Recently, Zhang et al (2020) showed enhanced
land–atmosphere coupling associated with continu- We used daily 2 m air temperature data from the
ous soil moisture deficit, which appears to intensify ERA-Interim reanalysis dataset (Dee et al 2011) for
surface warming and anticyclonic circulation anom- the heatwave definition. In this study, a heatwave
alies. It strengthens heatwaves which affect soil defi- event was defined as having temperatures exceed-
cit. Moreover, Li et al (2019a) emphasized the role ing the 90th percentile of the average daily temper-
of soil moisture–atmosphere feedbacks in future cli- ature for the warm season for at least three con-
mate change, and it leads to enhance the magnitude secutive days (Meehl and Tebaldi 2004, Perkins and
and interannual variability of temperature. Some Alexander 2013, Russo et al 2014). The 90th per-
studies using the Global Land–Atmosphere Coupling centile is calculated as a single threshold for the total
Experiment-Coupled Model Intercomparison Pro- period, 7360 days for the 40 years from 1979 to 2018
ject Phase 5 simulations also reported that drying (40 years × 184 days). We used the total heatwave days
trends in soil moisture tend to enhance hot extremes as the sum of heatwave days during the considered
and aridity (Berg et al 2016, Vogel et al 2017). period, for each year. To detect drought events,
Although previous studies have reported mech- monthly self-calibrating Palmer Drought Severity
anisms of single and concurrent extreme events Index (scPDSI) data were obtained from the Cli-
associated with heatwaves and droughts, the quant- mate Research Unit version 4.03 (Barichivich et al
itative attributes of each process are yet to be 2020). The scPDSI data for the global land sur-
fully understood. Besides, the role of feedback pro- face (excluding Antarctica) spanned the 1901–2018
cesses related to concurrent extreme events has not period at a monthly temporal resolution, with a spa-
been clearly elucidated. Thus, progress is needed to tial resolution of 0.5◦ × 0.5◦ . Concurrent extreme
quantify these feedback processes to understand the events were defined as heatwave events that occurred
relative importance of various radiative and dynam- under simultaneously severely dry conditions. An
ical processes. Here we use the Coupled atmosphere– instance of severely dry conditions is defined as
surface climate feedback-response analysis method scPDSI < −3.
2Environ. Res. Lett. 16 (2021) 064003 Y-W Seo et al
To quantify the contributions of individual radi- the divergence of the longwave radiation flux, and
ative and dynamical processes to the dry heatwave- ⃗ non-radiative is the vertical profile of the convergence of
Q
related surface temperature changes, we used the the total energy caused by turbulent, convective, and
CFRAM in this study. The CFRAM is a computation- large-scale atmospheric motions. According to the
ally efficient, off-line diagnostic tool that decomposes linear approximation, the sum of the partial energy
local temperature anomalies into partial temperature perturbations caused by individual radiative feedback
changes due to individual radiative and atmospheric processes can be expressed as:
dynamical feedback. To conduct the calculations in
the CFRAM, the atmospheric/surface temperature, ∆⃗S ≈ ∆⃗S(w) + ∆⃗S(c) + ∆⃗S(α) + ∆⃗S(O3 ) , (6)
specific humidity, ozone mixing ratio, cloud amount,
cloud liquid/ice water content, surface albedo, sens-
∂ ⃗R ⃗
ible/latent heat flux, surface pressure, surface net ∆⃗R ≈ ∆⃗R(w) + ∆⃗R(c) + ∆⃗R(O3 ) + ∆T, (7)
downward shortwave flux, and surface downwelling ∂ ⃗T
shortwave flux data were obtained from the ERA-
Interim reanalysis datasets. These datasets are gridded ⃗ non-radiative = ∆Q
∆Q ⃗ (SH) + ∆Q ⃗ (LH) + ∆Q
⃗ (atmos_dyn)
with a standard 1.5◦ latitude × 1.5◦ longitude grid + ∆Q ⃗ (sfc_dyn) , (8)
and 37 vertical levels ranging from 1000 to 1 hPa. This
study focused on 40 years, spanning 1979–2018, dur- where w, c, α, O3 , SH, LH, atmos_dyn, and sfc_dyn
ing the warm season (May to October). represent water vapor, cloud, surface albedo, ozone,
Solar insolation at the top of the atmosphere sensible heat flux, latent heat flux, atmospheric
(TOA) (I), one of the input variables for the radiat- dynamics, and surface dynamics, respectively. The
ive transfer model (RTM), is calculated as: ⃗
matrix ∂∂⃗RT is equivalent to the Planck feedback para-
( )2 meter in the partial radiative perturbation method
R0 S0
I= (H sinφ sinδ + cosφ cosδ sinH) , (1) (Wetherald and Manabe 1988) but in a more gen-
RE π
eral sense is obtained by including the vertical struc-
where S0 is the solar constant (1360.89 Wm−2 ), ture of radiative fluxes. In contrast, the Planck feed-
φ is the latitude, ∆ is the solar declination angle back parameter in Wetherald and Manabe (1988) is
(−23.45◦ ⩽ δ ⩽ 23.45◦ ), RE is the distance of the referred to as the radiative flux at the TOA. Substitut-
Earth from the Sun, R0 is its annual mean, and H is ing equations (6)–(8) into (5):
the length of a half-day: ( )−1 {
∂ ⃗R ( )(w) ( )(c)
H = cos−1 (−tanφ tanδ) , (2) ∆⃗T = ∆ ⃗S − ⃗R + ∆ ⃗S − ⃗R
∂ ⃗T
( ) ( )(O3 )
◦ 360◦ + ∆ ⃗S − ⃗R + ∆⃗S(α) + ∆Q⃗ (SH)
δ = 23.45 × sin × (n + 284) . (3) }
365
+∆Q ⃗ (LH) + ∆Q⃗ (atmos_dyn) + ∆Q
⃗ (sfc_dyn) .
Here, n is the day of the year, with n = 1 for January 1 (9)
and n = 365 for December 31. We also calculated the
distance from the Earth to the Sun as: We obtain equation (9), which denotes that the local
( )2 ∑ 2 temperature differences between two climate states
R0
= (ak cos kt + bk sin kt), (4) can be decomposed into eight partial temperature dif-
RE ferences. The local temperature differences between
k=0
two climate states are expressed by the sum of the
where t = 2πd/365, with d = 0 for January 1 and
radiative energy input caused by different climate
d = 364 for December 31. The coefficient for the
states and energy flux perturbations that are not
calculation of the Sun–Earth distance is shown in
caused by the radiation change associated with tem-
table S1.
perature changes. The radiative energy differences
CFRAM was developed by Lu and Cai (2009)
and the Plank feedback matrix are performed using
based on differences in the total energy balance within
the Fu-Liou RTM (Fu and Liou 1992). For more
an atmosphere–surface column at a given horizontal
details, refer to Cai and Lu (2009), Lu and Cai (2009),
location consisting of M atmospheric layers and a sur-
and Park et al (2012).
face layer between two climate states. In this study,
the two climate states denote the strong dry heatwave
3. Results
years and normal years. It can be written as:
∂⃗E 3.1. Relationship between heatwaves and drought
∆ = ∆⃗S − ∆⃗R + ∆Q
⃗ non-radiative , (5) conditions
∂t
Figure 1 shows the number of heatwave days,
⃗
where ∆ ∂∂Et is the change in energy storage, ⃗S is the the drought index (scPDSI), and the number of
convergence of the shortwave radiation flux, ⃗R is concurrent events over East Asia during the warm
3Environ. Res. Lett. 16 (2021) 064003 Y-W Seo et al
Figure 1. (a) Total days of heatwaves (d yr−1 ), (b) scPDSI during the warm season (May to October), (c) total days of heatwaves
under dry conditions (d yr−1 ), and (d)–(f) their linear trends during the period from 1979 to 2018. (g)–(i) Time series of area
average of (a)–(c) over East Asia (95 ◦ E–135 ◦ E, 20 ◦ N–55 ◦ N), respectively.
season. There are dominant areas in which heat- similar spatial patterns, with increasing trends over
waves frequently occur in southeastern China, Korea, northern China. Therefore, the compound events are
and Japan, and heatwave events have increased since affected by the regional characteristics of dryness, but
the mid-1990s. The drought index exhibits a spa- their frequency tends to be closely related to heatwave
tial pattern different from that of heatwaves, and events. The results imply that compound events have
the drought frequency is calculated using a drought occurred more frequently and significantly over East
index that represents severe and extremely dry con- Asia, since the early 2000s.
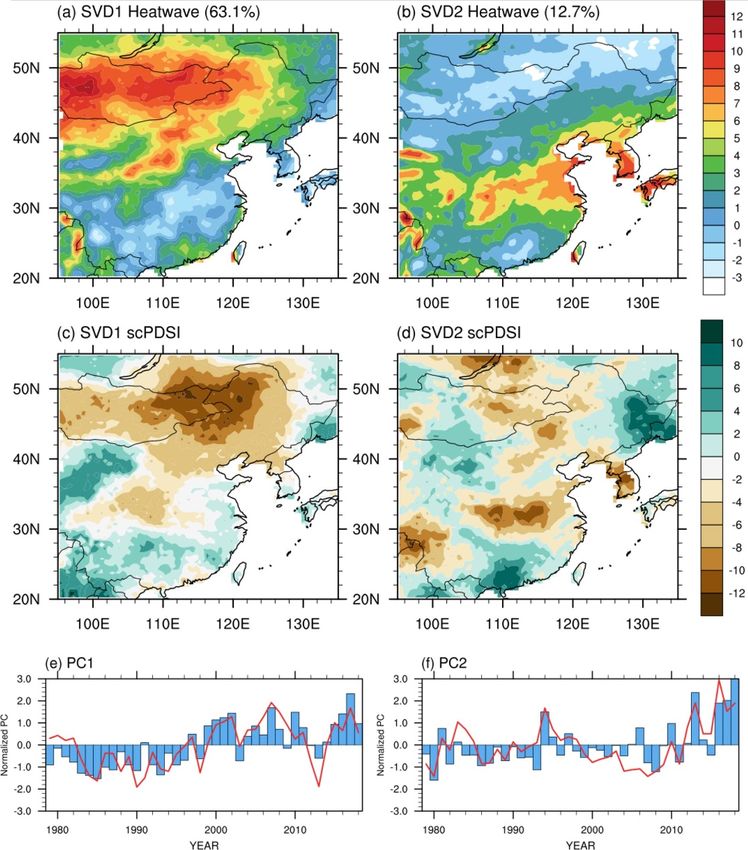
ditions. Regions in which drought occurs most fre- To examine the co-variability of heatwaves and
quently include northeastern China and the northern droughts, we performed a singular value decompos-
boundary of Mongolia, whereas the East Asian sum- ition (SVD) analysis of the total summer heatwave
mer monsoon regions have less frequent droughts. days and summer scPDSI (figure 2). The first SVD
Longer-lasting droughts can have devastating effects. mode explained 57.5% of the total covariance, and
East Asia experienced prominent dry conditions the first spatial mode showed an increase in heat-
for at least ten consecutive years during the 2000s waves and a decrease in scPDSI, indicating enhanced
(figure 1(e)). Heatwaves under dry conditions coin- dry and extremely warm conditions over northern
cided with the spatial distribution of the drought East Asia. Consistent with the spatial distribution
index and these events were relatively rare before the of SVD1, the principal components (PCs) of the
late 1990s but have become more frequent since the heatwaves are significantly correlated with scPDSI
early 2000s. Their time series were significantly cor- over East Asia (r = 0.76) and showed an increas-
related with the drought index (r = −0.64) and with ing trend. The spatial patterns of the second mode
heatwaves (r = 0.71). The linear trends of heatwaves of heatwaves showed a strong zonally elongated pat-
represent the increase over most of East Asia, but tern along with central China, the Korean peninsula,
they do not coincide with the spatial distribution of and Japan, with 17.2% of the total covariance. The
the total heatwave days. Despite the frequent occur- second SVD mode of scPDSI coincided with a heat-
rence of heatwaves over southern East Asia during wave; however, negative anomalies still occurred over
the last 40 years, the linear trends represent a more northern East Asia. The second PC time series cap-
slowly increasing pattern, whereas northern East Asia tured a sudden increase since the early 2000s and the
has exhibited rapidly increasing trends. The linear time coefficients of both fields are closely correlated,
trends in the drought index and dry heatwaves show with a 0.79 correlation coefficient. This denotes that
4Environ. Res. Lett. 16 (2021) 064003 Y-W Seo et al
Figure 2. First and second singular value decomposition (SVD) modes of total heatwave days and scPDSI during the warm season
(MJJASO) for the period 1979–2018: (a), (b) spatial modes of total heatwave days; (c), (d) spatial modes of scPDSI, and (e),
(f) their PC time series.
the heatwave events have since tended to increase, and for the period 1979–2018 and were used to construct
the variability of scPDSI indicated well-organized dry the composites (figures 3 and S1 (available online
conditions over northeastern East Asia, suggesting at stacks.iop.org/ERL/16/064003/mmedia)). All the
favorable conditions for simultaneous heatwaves and strong years have existed since the 2000s, as shown
droughts. in figure 1. We also adopted the 2 m air temperat-
To understand and evaluate the relative contri- ure and precipitation or soil moisture data instead of
butions of the various radiative and dynamical feed- the heatwave index and scPDSI (figures 3(b) and (c)).
back processes during the strong concurrent heat- Although the data in some years were out of range,
waves and droughts, we used scatterplots to select they showed a distribution, approximately similar to
years involving the two climatic states (figure 3). that of the indices.
We contrasted the composite strong concurrent state
with normal years, as defined below, in the warm 3.2. Partial temperature anomalies related to
season and obtained a process-resolving decompos- feedback processes
ition of the heatwave-related temperature anomalies To validate the performance of the CFRAM, the sur-
according to equation (9). We identified the strong face and atmospheric temperature anomalies derived
(weak) years as those in which the normalized heat- from the ERA-Interim dataset during the strong years
wave was higher (lower) than 0.5, and the scPDSI was and the sum of the CFRAM-derived partial temperat-
lower (higher) than −0.5 simultaneously; the normal ure changes at the surface, 0.8-sigma, 0.7-sigma, 0.5-
years were selected by excluding the strong and weak sigma, and 0.2-sigma levels are shown in figure S2.
years. Following these criteria, a total of 7 (5), strong The spatial structure and magnitude of the two
(weak), years, and 28 normal years were identified fields were highly similar. A strong warm-core was
5Environ. Res. Lett. 16 (2021) 064003 Y-W Seo et al
Figure 3. Scatter diagram between (a) the normalized anomaly of heatwave days (HWD) and scPDSI, (b) the normalized
anomaly of precipitation and temperature, and (c) the normalized anomaly of soil moisture and temperature in MJJASO over
East Asia (95 ◦ E–135 ◦ E, 20 ◦ N–55 ◦ N). Red, blue, and black numbers indicate strong, weak, and normal years for dry heatwaves
over East Asia.
found over East Asia at the surface and in the leads to less heat release through less evaporation
mid-troposphere. In the lower stratosphere, cold or transpiration from the surface to the atmosphere
temperature anomalies existed, and a clear baroclinic and contributes to the increasing temperature at the
structure was present over East Asia in both the reana- surface.
lysis data and in the CFRAM-derived temperature Surface dynamic processes are induced by energy
anomalies. Therefore, the CFRAM performed reas- perturbations at the surface caused by changes in
onably well in reproducing the heatwave-related tem- soil heat diffusion, heat storage anomalies, and sur-
perature anomaly fields directly derived from the face turbulent sensible/latent heat flux anomalies
ERA-Interim data. (figure 4(h)). The majority of the surface dynamic
In general, the term ‘forcing’ is defined as an feedback can be explained by the sensible and lat-
energy input to the system; ‘response’ and ‘feed- ent heat flux, and soil moisture might contribute to
back’ are defined as the output of the system and an the formation of temperature anomalies. While the
induced input from the output, respectively. In using sensible heat flux and atmospheric dynamic feedback
CFRAM for climate model feedback analysis, ‘forcing’ produced a cooling effect over the concurrent heat-
is defined as an external perturbation profile in the wave regions (figures 4(f) and (i)), the effects of the
atmosphere–surface column, ‘response’ is defined as sensible heat flux indicated signs opposite to those
a vertically varying atmosphere–surface temperature of the latent heat flux. As the emission of the sens-
profile, and ‘feedback’ is defined as any energy flux ible heat increases from the warm surface, the effects
perturbations that are not directly caused by the long- of the sensible heat feedback act toward cooling the
wave radiation change caused by temperature changes surface temperature. These feedback processes par-
(Lu and Cai 2009). tially counteract the effects of warm temperatures
From this perspective, the partial temperat- (figure 4(f)). The total contribution of sensible and
ure changes caused by the eight radiative and latent heat flux to surface temperature change is sur-
non-radiative feedback processes obtained through face cooling in most dry heatwave regions (figure
CFRAM are presented in figure 4. Warm temper- S3). It notes that the sensible heat flux effect is lar-
ature changes related to clouds, latent heat flux, ger than that of latent heat flux. It also implies that
and surface dynamics affected the total temperat- surface dynamics due to horizontal heat diffusion
ure changes (figures 4(e), (g), and (h)). In partic- in the soil and heat storage anomalies, provide loc-
ular, cloud feedback was the main driver of warm alized temperature anomalies of warming over the
temperature anomalies; it is affected by radiative dry heatwave regions. Atmospheric dynamic pro-
energy flux perturbations caused by changes in the cesses are the terms of the energy perturbations
cloud amounts and cloud liquid/ice water content caused by changes in large-scale atmospheric motions
(figure 4(e)). Reduced cloud amounts accompan- (figure 4(i)). These terms are linked to the distribu-
ied by anticyclonic circulation affected the insola- tion of atmospheric pressure, temperature advection,
tion over East Asia and modulated the warm sur- and wind. The partial temperature changes caused by
face. The latent heat flux was caused by changes in ozone, water vapor, and albedo feedback were weak
the surface latent heat flux from the surface to the (figures 4(b)–(d)).
atmosphere associated with evaporation or transpir-
ation of water at the land surface (figure 4(g)). As 3.3. Possible causes of concurrent heatwave-related
heatwaves occur under drought conditions, the land temperature anomalies
has less soil moisture than it had in normal states To examine the possible causes of the heatwave-
(figure 5(d)). Therefore, a reduced latent heat flux related partial temperature changes, we investigated
6Environ. Res. Lett. 16 (2021) 064003 Y-W Seo et al
Figure 4. (a) Total temperature anomalies (K) and CFRAM-derived partial temperature changes due to (b) ozone feedback,
(c) water vapor feedback, (d) surface albedo feedback, (e) cloud feedback, (f) sensible heat flux change, (g) latent heat flux
change, (h) surface dynamics, and (i) atmospheric dynamics in composite concurrent heatwave summer. Dotted regions indicate
the area where the number of concurrent heatwave days is more than 2 d yr−1 in figure 1(c).
Figure 5. Differences of (a) surface temperature (K) (shading) and total precipitation (mm) (contour), (b) geopotential height at
500 hPa (m) (shading) and cloud amount (contour), (c) latent (shading) and sensible heat flux (contour) (W m−2 ), and (d) soil
moisture (m3 /m3 ) (shading) and evaporation (mm) (contour) between strong and normal years of concurrent heatwave summer
(MJJASO).
the differences in the surface temperature, total pre- normal years of heatwaves and droughts during the
cipitation, geopotential height at 500 hPa, cloud warm seasons (figure 5). Over East Asia, the observed
amounts, latent and sensible heat flux, soil moisture, areas of warm temperature anomalies and dry con-
and vapor pressure deficit between the strong and ditions were consistent with the area of anticyclonic
7Environ. Res. Lett. 16 (2021) 064003 Y-W Seo et al
flow with positive anomalous geopotential height and human society, even if individual events may not
(figures 5(a) and (b)). The enhanced anticyclonic result in extreme conditions. This study focused on
anomalies induced sinking motion, contributing to the features of concurrent heatwaves and droughts
a decrease in precipitation during the warm seasons over East Asia. Our results indicate that the frequency
(figure 5(a)). Dry surface conditions caused by less of concurrent heatwaves and droughts has increased
precipitation reinforced the warm anomalies, thereby in most parts of East Asia, especially in northeastern
acting as a positive feedback to maintain dry con- China and along the northern boundary of Mongolia.
ditions and intensify the warm states at the surface. The spatial distribution was similar to that delineated
Moreover, the positive geopotential height anomalies by the drought index, but the frequency of occurrence
reduced the cloud cover, resulting in more solar insol- was primarily correlated to the heatwave events alone.
ation (figure 5(b)). Negative cloud amounts provided Concurrent events have tended to increase since the
additional warming in the East Asia domain via early 2000s. The first two principal modes of the
the associated increase in solar insolation (Ha et al heatwave and drought index also showed increas-
2020). Related to cloud feedback, the surface response ing trends over northeastern China after the early
could re-intensify the anomalous atmospheric condi- 2000s. In particular, the second mode of heatwaves
tions, thereby providing positive partial temperature and scPDSI supported an abrupt increase in the PC
changes. time series.
The differences in the sensible and latent heat We also demonstrated the feedback attribution
fluxes showed signs opposite to those of the partial from individual radiative and dynamical feedback
temperature changes. Sensible heat flux works effect- processes to surface temperature anomalies associ-
ively to release heat from the surface to the atmo- ated with concurrent heatwaves and droughts. We
sphere, whereas turbulent latent heat flux transports applied CFRAM to decompose these variables into
less heat from the surface (figure 5(c)). Warm temper- eight partial temperature changes, including ozone,
ature anomalies lead to enhanced transpiration from water vapor, albedo, cloud, sensible latent heat flux,
the available soil moisture, albeit with a lower total latent heat flux, surface dynamics, and atmospheric
surface latent heat flux, and, hence, to a parched sur- dynamics. It was found that the latent heat flux,
face. It strongly reduces latent cooling and thereby has cloud cover, and surface dynamics provide a warming
substantial impacts on the amplitude of extreme tem- effect on the surface temperature anomalies related
peratures (Perkins et al 2012, Seneviratne et al 2014). to intense heatwaves and drought events. The cloud
Therefore, a positive sensible heat flux change leads feedback led to increasing solar insolation at the
to a more conductive heat release from the surface to surface, which directly affected the formation of
the atmosphere, resulting in cooling at the surface. In warm surface temperatures. High-pressure systems
contrast, a positive latent heat flux change indicates and dry air conditions are related to the decrease
that the turbulent latent heat is trapped in the surface, in cloud cover, adding cloud-induced warming to
and they contribute to a warmer surface. the total warm temperature change. The latent heat
The negative anomalies of the soil moisture flux provided the most substantial warming effect
matched well with the warm surface temperature on the surface temperature anomalies as a reduc-
(figure 5(d)). There was also a general agreement tion of the heat released from the surface to the
between the soil moisture exchange and evapora- atmosphere; this implies that soil moisture attribu-
tion. As mentioned previously, soil moisture contrib- tions are important. This feedback effect accounted
utes to latent/sensible heat flux processes and surface for most of the surface dynamic processes. In con-
dynamic feedback and has thus been emphasized in trast, the sensible heat flux and atmospheric dynamic
many heatwave and drought studies (Miralles et al processes play a role in reducing warm temperature
2014, Whan et al 2015, Wang et al 2019, Zhang et al anomalies.
2019, 2020, Choi et al 2020). Soil deficits restric- This study provides a better understanding of
ted surface evaporation and generated conditions combined extreme climate events in the context of
favorable for sensible heat fluxes to the atmosphere, radiative and dynamic feedback processes. It has been
whereas latent heat flux tended to have an oppos- suggested that heatwaves and droughts intensify and
ite response. These processes offered drier conditions propagate via land–atmosphere feedback; however,
with negative evaporation at the surface, which indic- knowledge about the initiation and evolution of heat-
ated the critical roles of land–atmosphere interac- waves and droughts remains limited. In addition, soil
tions through soil moisture in the positive feedback moisture deficit closely related to vegetation changes,
of atmospheric circulation, surface warming, and soil and it could bring the decrease of absorption of
dryness. solar radiation through the albedo effects. Further
research associated with how net radiation consid-
4. Conclusion and discussion ering longwave radiation flux affects surface heating
should be able to help this issue. Land–atmosphere
The combined effects of high temperatures and low interactions could be key to resolving the unrevealed
precipitation could significantly affect ecosystems problems about the generation of these concurrent
8Environ. Res. Lett. 16 (2021) 064003 Y-W Seo et al
extreme climate events, and these interactions should hot 2018 summer in Korea? J. Meteorolog. Soc. Japan
be explored further in future research. 98 153–67
Hao Z, Aghakouchak A and Phillips T J 2013 Changes in
concurrent monthly precipitation and temperature extremes
Data availability Environ. Res. Lett. 8 034014
Hu X, Yang S and Cai M 2016 Contrasting the eastern Pacific El
Niño and the central Pacific El Niño: process-based feedback
The drought index used in this study, scPDSI, is avail- attribution Clim. Dyn. 47 2413–24
able from the Climatic Research Unit server: https:// Kong Q, Guerreiro S B, Blenkinsop S, Li X F and Fowler H J 2020
crudata.uea.ac.uk/cru/data/drought/. Increases in summertime concurrent drought and heatwave
The data that support the findings of this study in Eastern China Weather Clim. Extremes 28 100242
Li K, Zhang J, Yang K and Wu L 2019a The role of soil moisture
are openly available at the following URL/DOI: feedbacks in future summer temperature change over East
http://apps.ecmwf.int/datasets/. Asia J. Geophys. Res. Atmos. 124 12034–56
Li X, You Q, Ren G, Wang S, Zhang Y, Yang J and Zheng G 2019b
Concurrent droughts and hot extremes in northwest China
Acknowledgments from 1961 to 2017 Int. J. Climatol. 39 2186–96
Li Y and Yang S 2017 Feedback attributions to the dominant
modes of East Asian winter monsoon variations J. Clim.
This study was supported by the Institute for Basic 30 905–20
Science (IBS) under IBS-RS028-D1. We thank Lorenz R, Jaeger E B and Seneviratne S I 2010 Persistence of heat
Jianhua Lu, Sun Yat-sen University in China for waves and its link to soil moisture memory Geophys. Res.
providing his model and constructive and valuable Lett. 37 1–5
Lu J and Cai M 2009 A new framework for isolating individual
comments. We are grateful to the European Centre feedback processes in coupled general circulation
for Medium Range Weather Forecasts Laboratory for climate models. Part I: formulation Clim. Dyn.
providing their respective data sets. 32 873–85
Mazdiyasni O and AghaKouchak A 2015 Substantial increase in
concurrent droughts and heatwaves in the United States
ORCID iDs Proc. Natl Acad. Sci. 112 11484–9
Meehl G A and Tebaldi C 2004 More intense, more frequent, and
Kyung-Ja Ha https://orcid.org/0000-0003-1753- longer lasting heat waves in the 21st century Science
9304 305 994–7
Miralles D G, Gentine P, Seneviratne S I and Teuling A J 2019
Tae-Won Park https://orcid.org/0000-0002-1373- Land–atmospheric feedbacks during droughts and
8632 heatwaves: state of the science and current challenges Ann.
New York Acad. Sci. 1436 19–35
Miralles D G, Teuling A J, Van Heerwaarden C C and De
References Arellano J V G 2014 Mega-heatwave temperatures due to
combined soil desiccation and atmospheric heat
Barichivich J, Osborn T J, Harris I, van der Schrier G and accumulation Nat. Geosci. 7 345–9
Jones P D 2020 Drought [in ”State of the Climate in 2019”] Park T W, Deng Y and Cai M 2012 Feedback attribution of the El
Bull. Amer. Meteor. Soc. 101 S1-S429 Nio-Southern Oscillation-related atmospheric and surface
Berg A et al 2016 Land–atmosphere feedbacks amplify aridity temperature anomalies J. Geophys. Res. Atmos. 117 23101
increase over land under global warming Nat. Clim. Change Park T W, Jeong J H, Deng Y, Zhou R and Cai M 2015
6 869–74 Quantitative decomposition of radiative and non-radiative
Cai M and Lu J 2009 A new framework for isolating individual contributions to temperature anomalies related to siberian
feedback processes in coupled general circulation climate high variability Clim. Dyn. 45 1207–17
models. Part II: method demonstrations and comparisons Perkins S E and Alexander L V 2013 On the measurement of heat
Clim. Dyn. 32 887–900 waves J. Clim. 26 4500–17
Choi N, Lee M I, Cha D H, Lim Y K and Kim K M 2020 Decadal Perkins S E, Alexander L V and Nairn J R 2012 Increasing
changes in the interannual variability of heat waves in East frequency, intensity and duration of observed global
Asia caused by atmospheric teleconnection changes J. Clim. heatwaves and warm spells Geophys. Res. Lett. 39 1–5
33 1505–22 Rohini P, Rajeevan M and Srivastava A K 2016 On the variability
Dee D P et al 2011 The ERA-Interim reanalysis: configuration and and increasing trends of heat waves over India Sci. Rep. 6 1–9
performance of the data assimilation system Q. J. R. Russo S, Dosio A, Graversen R G, Sillmann J, Carrao H,
Meteorol. Soc. 137 553–97 Dunbar M B, Singleton A, Montagna P, Barbola P and
Deng Y, Park T W and Cai M 2013 Radiative and dynamical Vogt J V 2014 Magnitude of extreme heat waves in present
forcing of the surface and atmospheric temperature climate and their projection in a warming world J. Geophys.
anomalies associated with the northern annular mode Res. Atmos. 119 12500–12
J. Clim. 26 5124–38 Seneviratne S I, Donat M G, Mueller B and Alexander L V 2014
Ding Y, Ren G, Zhao Z, Xu Y, Luo Y, Li Q and Zhang J 2007 No pause in the increase of hot temperature extremes Nat.
Detection, causes and projection of climate change over Clim. Change 4 161–3
China: an overview of recent progress Adv. Atmos. Sci. Seo Y W, Yun K S, Lee J Y, Lee Y W, Ha K J and Jhun J G 2018
24 954–71 Future changes due to model biases in probabilities of
Fischer E M, Seneviratne S I, Vidale P L, Luthi D and Schar C extreme temperatures over East Asia using CMIP5 data Int.
2007 Soil moisture–atmosphere interactions during the J. Climatol. 38 1177–88
2003 European Summer Heat Wave J. Clim. 20 5081–99 Sharma S and Mujumdar P 2017 Increasing frequency and spatial
Fu Q and Liou K N 1992 On the correlated k-distribution method extent of concurrent meteorological droughts and heatwaves
for radiative transfer in non homogeneous atmospheres J. in India Sci. Rep. 7 1–9
Atmos. Sci. 49 2139–56 Shukla S, Mohammad S, AghaKouchak A, Guan K and Funk C
Ha K J, Yeo J H, Seo Y W, Chung E S, Moon J Y, Feng X, 2014 Temperature impacts on the water year 2014 drought
Lee Y W and Ho C H 2020 What caused the extraordinarily in California Geophys. Res. Lett. 42 4384–93
9Environ. Res. Lett. 16 (2021) 064003 Y-W Seo et al
Taylor P C, Cai M, Hu A, Meehl J, Washington W and Zhang G J on extreme maximum temperatures in Europe Weather
2013 A decomposition of feedback contributions to polar Clim. Extremes 9 57–67
warming amplification J. Clim. 26 7023–43 Yu R and Zhai P 2020 More frequent and widespread persistent
Trenberth K E, Dai A, van der Schrier G, Jones P D, Barichivich J, compound drought and heat event observed in China Sci.
Briffa K R and Sheffield J 2014 Global warming and changes Rep. 10 1–7
in drought Nat. Clim. Change 4 17–22 Zampieri M, D’Andrea F, Vautard R, Ciais P, De
Vogel M M, Orth R, Cheruy F, Hagemann S, Lorenz R, van den Noblet-Ducoudré N and Yiou P 2009 Hot European
Hurk B J J M and Seneviratne S I 2017 Regional summers and the role of soil moisture in the propagation of
amplification of projected changes in extreme temperatures mediterranean drought J. Clim. 22 4747–58
strongly controlled by soil moisture-temperature feedbacks Zhang J, Yang Z, Wu L and Yang K 2019 Summer high
Geophys. Res. Lett. 44 1511–9 temperature extremes over Northeastern China predicted by
Wang P, Zhang Q, Yang Y and Tang J 2019 The sensitivity to initial spring soil moisture Sci. Rep. 9 12577
soil moisture for three severe cases of heat waves over Zhang P, Jeong J-H, Yoon J-H, Kim H, Wang S-Y S,
eastern China Front. Environ. Sci. 7 1–16 Linderholm H W, Fang K, Wu X and Chen D 2020 Abrupt
Wetherald R T and Manabe S 1988 Cloud feedback processes in a shift to hotter and drier climate over inner East Asia beyond
general circulation model J. Atmos. Sci. 45 1397–415 the tipping point Science 370 1095–9
Whan K, Zscheischler J, Orth R, Shongwe M, Rahimi M, Zscheischler J et al 2018 Future climate risk from compound
Asare E O and Seneviratne S I 2015 Impact of soil moisture events Nat. Clim. Change 8 469–77
10You can also read