STRUCTURE, MAGNETIC AND DIELECTRIC PROPERTIES IN NANO-CRYSTALLINE YB2COMNO6

Page created by Raymond Harrington
 
CONTINUE READING
STRUCTURE, MAGNETIC AND DIELECTRIC PROPERTIES IN NANO-CRYSTALLINE YB2COMNO6
Structure, magnetic and dielectric properties in nano-crystalline Yb2 CoMnO6

                                                                                                                  Ilyas Noor Bhatti
                                                                                    Department of Physics, Jamia Millia Islamia University, New Delhi - 110025, India.

                                                                                                                 Imtiaz Noor Bhatti
arXiv:2003.07872v1 [cond-mat.str-el] 17 Mar 2020

                                                                                       Department of School Education, Government of Jammu and Kashmir, India.

                                                                                                               Rabindra Nath Mahato
                                                                                School of Physical Sciences, Jawaharlal Nehru University, New Delhi - 110067, India.

                                                                                                                   M. A. H. Ahsan
                                                                                    Department of Physics, Jamia Millia Islamia University, New Delhi - 110025, India.

                                                   Abstract
                                                   Structural, magnetic and dielectric properties have been studied for Yb2 CoMnO6 . Nano-crystalline sample of
                                                   Yb2 CoMnO6 synthesized by sol-gel method and structural analysis shows that the sample crystallizes in monoclinic
                                                   crystal structure with P21 /n phase group. To understand the charge state of Co, Mn and Yb we have performed the
                                                   XPS study. Magnetic study shows that the sample undergoes a paramagnetic to ferromagnetic phase transition around
                                                   T c ∼56 K and an additional magnetic ordering at a lower temperature around 14 K due to ordering of Yb3+ magnetic
                                                   ions. Temperature dependent Raman study reveals that spin-phonon interaction is present in this material. Further,
                                                   we have studied the dielectric properties of this material. We observed that the material shows a relaxation behavior
                                                   that obeys the thermally activated relaxation mechanism. Impedance spectroscopy reveals that the material shows
                                                   non-Debye’s behavior. AC conductivity study is performed to understand the conduction mechanics which involve
                                                   the quantum mechanical tunneling phenomenon.

                                                   1. Introduction                                                              perovskites.[8] Interestingly, novel high-temperature
                                                                                                                                multiferroicity have been observed in a 3d-5d based
                                                      Materials which simultaneously shows ferroelec-                           Bi2 (Ni/Mn)ReO6 compound.[9] Despite having an in-
                                                   tricity and magnetism are termed as multiferroic                             teresting physics and exotic phenomenon with promis-
                                                   materials.[1, 2] Strong coupling of electric and mag-                        ing potential for industrial applications these materials
                                                   netic properties can be utilized for vast industrial ap-                     have not been well studied.
                                                   plications, for instance, storage devices, sensors, tun-
                                                   able microwave filters, etc.[3, 4, 5, 6] Recently, sev-                         Among the vast class of compounds 3d based
                                                   eral double perovskite materials have exhibited cou-                         R2 CoMnO6 (where R = rare earth elements) has re-
                                                   pled magnetic and electric phenomenon. Among them,                           ceived much attention of researchers due to their ex-
                                                   a new double perovskite Ba2 FeMnO6 have shown                                otic properties such as E type ferromagnetic ordering,
                                                   co-existence of electric and magnetic hysteresis and                         spin-phonon coupling, multiferroicity, magnetoelectric-
                                                   considered as a promising candidate for spintronic                           ity, etc. In these double perovskites the spin mag-
                                                   applications.[7] The tunable magneto-electric effect has                     netic moment of Co2+ and Mn4+ interact via domi-
                                                   been observed in Y2 MnCrO6 which have further in-                            nant super-exchange interaction and give rise to ferro-
                                                   tensified the quest of multiferroic materials in double                      magnetic ordering in these materials. However, in ad-
                                                                                                                                dition to this magnetic phase transition, the rare-earth
                                                       Email addresses: inoorbhatti@gmail.com (Ilyas Noor                       ions also interact at low temperatures and in most cases
                                                   Bhatti), inbhatti07@gmail.com (Imtiaz Noor Bhatti)                           align themselves in opposite direction to the Co/Mn
                                                   Preprint submitted to Elsevier                                                                                          March 19, 2020
sublattice and thus results in an antiferromagnetically        clear. However, Yb2 O3 is insoluble in water to make a
ordered state. It is worth to mention some previous            clear solution we have added nitric acid drop by drop
findings, for instance, Lu2 CoMnO6 shows E-type mag-           to the beaker containing Yb2 O3 and water with con-
netic ordering around 50 K with an anomaly in dielec-          tinuous stirring at 95 o C. After continuous staring for
tric constant at same temperature which suggests some          20 minutes Yb2 O3 dissolves completely in dilute nitric
kind of magneto-electric interplay in this material.[10]       acid and the solution becomes clear. Then all the solu-
Further, this material shows pyroelectric properties and       tions were poured into the 500 ml beaker and filled to
has shown negative magnetocapacitance.[11] In another          400 ml with distilled water. This final solution is then
case, Er2 CoMnO6 shows a ferromagnetic ordering of             kept on magnetic starrier at 90 o C for 24 hours for suit-
Co and Mn cations around 67 K with a low temper-               able reaction time. The solution then turned into a gel
ature ferrimagnetic ordering around 10 K activated by          and finally heated up to form a foam. The foam is col-
Er3+ ions.[12] The pyroelectric and polarization proper-       lected from the beaked grounded well and heated at 600
ties of Y2 CoMnO6 have been studied and confirms that          o
                                                                 C. The collected powder is then grounded again for 30
no intrinsic magnetoelectric multiferroicity exists.[13]       minutes and sintered at 900 o C for 12 hours. The ob-
Magnetization and neutron study of single crystalline          tained powder is collected and characterized by X-ray
Yb2 CoMnO6 shows E-type ferromagnetic ordering and             diffraction using Rigaku mini flex 600 diffractometer.
also shows negative magnetocapacitance.[10] Strong             X-ray photoelectron spectroscopy (XPS) is performed
magnetic anisotropy and metamagnetic transition have           to understand the charge state of cations. The XPS
been observed in a self flux-grown single crystal of           measurements were performed with base pressure in the
Yb2 CoMnO6 . In this study, we aim to investigate the          range of 10−10 mbar using a commercial electron en-
magnetic and dielectric properties of nano-crystalline         ergy analyzer (Omnicron nanotechnology) and a non-
Yb2 CoMnO6 and compare the results with bulk study             monochromatic AlKα X-ray source (hν = 1486.6 eV).
to identify the effect of reduced dimensions.                  The XPSpeakfit software has been used to analyze the
   In the present study, we report structural, magnetic,       XPS data. The samples used for XPS study are in pellet
dielectric and transport properties of nano-crystalline        form where an ion beam sputtering has been done on the
Yb2 CoMnO6 . The structural analysis shows the sam-            samples to expose clean surface before measurements.
ple is in single phase and adopts the monoclinic crystal       The magnetic measurements were done on powder us-
structure with P21 /n space group. Magnetization study         ing a vibrating sample magnetometer by Cryogen.Inc.
reveals that the Yb2 CoMnO6 is a ferromagnetic material        Temperature dependent Raman spectra have been col-
that undergoes PM-FM phase transition around T c ∼56           lected using Diode based laser (λ = 473 nm) coupled
K. The material also shows antiferromagnetic ordering          with a Labram-HR800 micro-Raman spectrometer. It
at low temperature. Raman study shows spin-phonon              is a single spectrometer with 1800 groves/mm grating
coupling is present in this material. Dielectric mea-          and a peltier cooled CCD detector with an overall spec-
surement shows a strong dispersion in dielectric con-          tral resolution of ∼1 cm−1 . For the low temperature Ra-
stant and tangent loss shows a relaxation phenomenon.          man measurements, the material has been mounted on
The impedance spectroscopy shows that Yb2 CoMnO6               a THMS600 stage from Linkam UK, with temperature
does not follow Debye’s model. The Nyquist plot anal-          stability of ±0.1 K. Dielectric measurements in the fre-
ysis shows non-Debye’s behavior Yb2 CoMnO6 . AC                quency range from 1 Hz to 5.5 MHz were performed us-
conductivity shows strong frequency dependency at the          ing a computer controlled dielectric set up on a closed-
higher frequency limit. The conductivity analysis shows        cycle refrigerator with operating temperature range of
that the conduction mechanism involves the quantum             20 to 300 K.
mechanical tunneling phenomenon.
                                                               3. Result and Discussions
2. Experimental details
                                                               3.1. Structural study
  Sol-gel method has been employed to synthesize                  Fig. 1a shows the X-ray diffraction pattern along with
the nano-crystalline Yb2 CoMnO6 . Starting ingredi-            Rietveld refinement for nano-crystalline Yb2 CoMnO6
ents with high purity (99.9%) from Alpha Aesar were            double perovskite. In this figure the black open circles
used. First, we have prepared solutions of each                are experimental data, the bold red solid line is the cal-
compound in separate beakers. We have dissolved                culated model, the blue weak line is the difference in
Mn(CH2 CO2 ).4H2 O, Co(NO3 )2 .6H2 O and nitric acid in        experimental and calculated pattern. The fitting param-
water with continuous stirring till the solution becomes       eter goodness of fit χ2 = 1.93 which is quite reasonable.
                                                           2
[1 1 1]                                                                                                                                             Co 2p                                 2p         (a)
                                                                                                 (a)                                                                                                                                                      3/2
                                                                                                                                                          Experimental
                                                                                                                                                                                                               Fit

                                                                                                                                                                                      Intensity (a.u.)
                                                                                                                                                          Calculated                                           2+
  Intensity (a.u.)

                                            [1 1 0]

                                                                                                                                                          Difference                                           satellite peaks
                                                                          [-1 1 3]

                                                                                                                                                          Braggs Peaks
                                                                [0 2 0]

                                                                                                [2 0 0]
                                                                                                                                                                                                                             2p

                                                                                                                                          [-3 0 2]
                                  [0 0 2]

                                                                                                                              [-2 -2 3]
                      [-1 -1 1]

                                                                                                                                                                                                                                 1/2

                                                                                                                    [0 0 4]
                                                                                                                                                     [-2 3 3]
                                                                                                          [1 1 2]
                                                                                     [-2 1 1]
                                                      [0 1 2]

                                                                                                                                                           [-3 0 6]

                                                                                                                                                                                                        805   800          795         790    785         780         775
                                                                                                                                                                                                                                 B.E.(eV)

                     20                               30                             40                                 50                           60         70     80
                                                                                                                                                                                                              Mn 2p                             2p              (b)
                                                                                                                                                                                                                                                      3/2
                                                                                                                                                                                                              Fit

                                                                                                    2               (Deg.)                                                                                    4+

                                                                                                                                                                                     Intensity (a.u.)
                                                                                                                                                                                                              satellite peaks
  (b)                                                                                                               (c)
                                                                                                                                                                                                                                  2p
                                                                                                                                                                                                                                        1/2

                                                                                                                                                                                                        665         658                651          644               637
                                                                                                                                                                                                                                 B.E.(eV)

                                                                                                                                                                                                                                                    4d          (c)
                                                                                                                                                                                                              Yb 4d                                    7/2

                                                                                                                                                                                                              Fit
                                                                                                                                                                                        Intensity (a.u.)

                                                                                                                                                                                                              3+

                                                                                                                                                                                                              satellite peaks

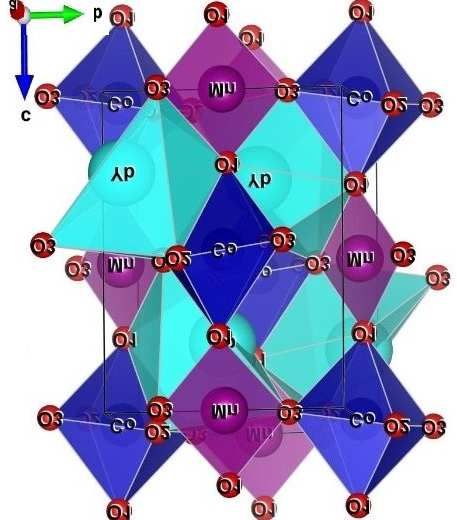
Figure 1: (Color online) (a) X-ray diffraction pattern along with Ri-
etveld refinement for nano-crystalline Yb2 CoMnO6 , peak indexing is                                                                                                                                           4d
represented for main peaks. (b) Shows the monoclinic unit cell struc-                                                                                                                                                5/2

ture obtained from refinement data. (c) Representative SEM image
use to estimate average partical size.
                                                                                                                                                                                                        205   200          195         190    185         180         175
                                                                                                                                                                                                                                 B.E.(eV)

                                                                                                                                                                                Figure 2: (Color online) (a) show the XPS core level spectra of Co
Further, from fitting we obtained Rwp /Rexp ratio ∼ 1.38                                                                                                                        2p (b) show the XPS core level spectra of Mn 2p. (c) shows the XPS
which is reasonably good and acceptable.[14, 15, 16]                                                                                                                            core level spectra of Yb 4d for Yb2 CoMnO6 . In the figure the red
These parameters show the Rietveld refinement is rea-                                                                                                                           solid line is the overall envelope of the XPS spectrum and the other
sonably good. Braggs peaks are also shown with navy                                                                                                                             colored solid lines are the other respective fitted peaks.
vertical bars. The Rietveld analysis on XRD data has
shown that the sample is chemically pure and in single
                                                                                                                                                                                3.2. X-ray photoelectron spectroscopy (XPS)
phase. Peak indexing is given in Fig. 1a for main peaks.
The sample crystallized in monoclinic crystal structure                                                                                                                            The physical properties of a compound are largely de-
with P21 /n space group. The lattice parameters are a =                                                                                                                         scribed by the oxidation state of cations present in the
5.1535(8) Å b = 5.5215(7) Å c = 7.3832(5) Å and β =                                                                                                                             material. XPS is a vital tool to understand the charge
90.29(1) o with the unit cell volume 210.08(9) Å3 . The                                                                                                                         state of cations. We have employed the XPS to study the
crystal structure unit cell is shown in Fig. 1b for this                                                                                                                        cationic charge state of Co, Mn and Yb in Yb2 CoMnO6 .
sample, it is evident from the figure that the Co and Mn                                                                                                                        XPS spectrum of Co 2p is shown in Fig. 2a in which
atoms are alternatively placed. Further, to measure the                                                                                                                         the open black circles are the experimental data the red
average particle size we used the scanning electron mi-                                                                                                                         line is the overall envelope of the spectrum the solid
croscope to obtain the micrograph of nano-particles as                                                                                                                          blue lines are the Co 2p peaks whereas orange solid
shown in Fig. 1c. The imageJ software is used to ana-                                                                                                                           lines are the satellite peaks fitted using XPS PEAKFIT
lyze the SEM micrograph and we found that the nano-                                                                                                                             4.1. It is evident from Fig. 2a there are two peaks lo-
particle of Yb2 CoMnO6 are obtained with average par-                                                                                                                           cated at 780.7 eV and 796.01 eV for CO 2p3/2 and Co
ticle size is ∼ 70 nm.                                                                                                                                                          2p1/2 respectively resulting from the spin-orbital split-
                                                                                                                                                                            3
ting of 2p orbital with 15.3 eV. Besides the Co 2p there                           100                                                   24
                                                                                                                                                          1
are two other peaks marked as satellite positioned at                                         FC                                         21

                                                                                                                                                  dM/dT
                                                                                                                                                          0
787 eV and 802.5 eV. The results are consistent with

                                                                                                                          )
                                                                                   80

                                                                                                                         -1
                                                                     )
                                                                    -1

                                                                                                                          (Oe mole emu
                                                                                                                                         18

                                                                     M (emu mole
literature.[17, 18, 19] Beside the Co 2p peaks two satel-                                                                                                 -1
                                                                                                                                                               14 K
                                                                                                                                                                           56 K

lite peaks have also been observed close to Co 2p peaks.                           60
                                                                                                    H      = 100 Oe
                                                                                                                                         15               -2
                                                                                                                                                               0   50    100    150

The peaks locations of Co 2p core level indicate that the
                                                                                                      dc
                                                                                                                                         12
                                                                                                                                                                      T (K)

Co cations are present in +2 oxidation states.                                     40
                                                                                                                                         9

   The measured XPS spectrum for Mn 2p core levels                                       ZFC

                                                                                                                         -1
                                                                                                                                         6
along with peak fitting is shown in Fig. 2b, where the                             20

open black circles are the experimental data the red line                                    (a)
                                                                                                                                         3
                                                                                                                                                                               (b)

is the overall envelope of the spectrum the solid blue                              0                                                    0
                                                                                         0    50   100 150 200 250 300                        0            40      80   120    160   200
lines are the Mn 2p peaks are shown. The Mn 2p spec-                                                 T (K)                                                         T (K)

trum shows two distinct peaks located at 642 eV and 654
eV corresponding to Mn 2p3/2 and 2p1/2 resulting from              Figure 3: (Color online) (a) Temperature dependent magnetization
the spin-orbital splitting of 2p orbitals with splitting en-       data M(T ) shown for Yb2 CoMnO6 measured at different fields. (b)
                                                                   M(T ) data plotted in terms of inverse susceptibility χ−1 , solid line is
ergy of 12 eV. The peak positions and splitting energy             fitting due to Curie Weiss Law. Inset shows dM/dT vs T plot showing
is reveals that the Mn cation is present in +4 oxidation           T c for Yb2 CoMnO6 .
state and is in agreement with literature.[20, 21, 22]
   XPS spectra of Yb 4d core level along with the fit-
ting of peaks are shown in Fig. 2c where the open black            to ferromagnetic (F M) phase transition in Yb2 CoMnO6 .
circles are experimental data, the solid red line is the           It is seen in Fig. 3a that the large bifurcation appears
overall envelope of the XPS spectrum and solid blue                in MZFC and MFC with further decreasing temperature.
lines are the Sm 3d orbitals. It is evident from the fig-          A peak like behavior around T c is observed in MZFC
ure that the two distinct spin-orbital split peaks Yb-4d5/2        curve and with further decreasing temperature the MZFC
and Yb-4d3/2 peaks are located at 186 eV and 199.6 eV,             began to decrease, such type of behavior is seen in
respectively with at spin-orbital splitting energy of 13.6         many perovskite compounds.[15, 16, 25, 26, 27, 28, 29]
eV. [23, 24] However, besides these two peaks there are            Whereas MFC continuously increases with decreasing
more small peaks attributed to the presence of Yb2+ ox-            temperature. However, at low temperature below ∼15
idation state in the material. The detailed analysis of            K there appears a peak in MFC and MZFC which is re-
XPS spectrum reveals that the majority of Yb cations               lated to the ordering of Yb3+ ions at low temperature.
are present in +3 oxidation states whereas small Yb2+              The bifurcation of ZFC and FC in oxides with com-
cations are also present.[24] It is conclusive from the            position La0.7−x Dy x Ca0.3 Mn(Fe)O3 has been studied in
XPS study that Co, Mn and Yb cations are in 2+, 4+                 detail.[30, 31] The observation of such bifurcation is
and 3+ oxidation states respectively.                              linked with the spin glass phase in this compound. How-
                                                                   ever, the observed bifurcation is influenced by compo-
3.3. Magnetization study                                           sition as reported and suppression of spin glass phase is
   Temperature dependent magnetization (M(T )) mea-                observed. However, to better understand the bifurcation
surements were performed both in the zero field cooled             in ZFC and FC of Yb2 CoMnO6 dynamic susceptibility
(ZFC) and field cooled (FC) mode as shown in Fig.                  measurement is required, where frequency dependent ac
3a. ZFC and FC data is recorded in a temperature                   susceptibility can shed light on the presence of glassy
range of 300 K to 2 K under an applied dc magnetic                 phase in this material. To estimate the transition tem-
field (Hdc ) of 100 Oe. The figure shows that with the             perature across which magnetic phase transition from
decrease in temperature the magnetic moment (M) in                 PM − F M appears we have plotted the dM/dT vs T
M(T ) curve remains steady initially. However, around              where the point of inflection in this plot gives the T c .
60 K the magnetic moment in both the (FC) and (ZFC)                Inset Fig. 3b shows two points of inflection, one around
curve began to increase with a further decrease in tem-            56 K the T c corresponding to the ferromagnetic ordering
perature. It is expected that the rise in magnetic moment          of Co2+ -Mn4+ whereas the other appears at 14 K which
is due to establishment of magnetic exchange between               is attributed to ordering of Yb3+ with net moment oppo-
Co2+ -Mn4+ in Yb2 CoMnO6 double perovskite which is                site to Co/Mn sublattice.
superexchange in nature and give rise to ferromagnetic                To further understand the magnetic behavior, we have
ordering below 56 K. This sharp rise in the magnetic               plotted the temperature dependent magnetization data in
moment below 56 K is marked by paramagnetic (PM)                   terms of inverse magnetic susceptibility i.e. χ vs T as
                                                                                                                  −1

                                                               4
4
               (a)                                        4
                                                                                                    of saturation even at the highest applied magnetic field
                                                               (b)
          3                                                                                         of 50 kOe at both 2 K and 25 K. From the M(H) curve
                                                          3

          2
                                                                                                    at 2 K we found that the magnetic moment at 50 kOe
               T = 25 K
                                                          2
                                                                 T=2K                               is about 3.5 µB /f.u. whereas the remanent magnetiza-

                                                 /f.u.)
 /f.u.)

          1                                               1
                                                                                                    tion and coercive force are 0.8387 µB /f.u. and 9065 Oe

                                                      B
                                                                                                    respectively.
      B

          0                                               0
                                                 M (
 M (

          -1                                              -1

                                                          -2
          -2                                                                                        3.4. Temperature dependent Raman study
                                                          -3
          -3
                                                          -4
                                                                                                       Temperature dependent Raman spectra taken at selec-
          -4                                                                                        tive temperatures across magnetic transition is shown
           -60   -40   -20    0   20   40   60             -60   -40   -20   0   20   40   60
                                                                                                    in Fig. 5a. The Raman spectra are taken in the tem-
                        H (k Oe)                                        H (k Oe)
                                                                                                    perature range from 10 K to 150 K across the mag-
Figure 4: (Color online) Isothermal magnetization data collected at 25
                                                                                                    netic transition whereas the Raman spectra are taken in
K (see (a)) and 2 K (see (b)) in an applied magnetic field of up to ±                               the close temperature intervals across T c . It is evident
50 kOe for Yb2 CoMnO6 .                                                                             from Fig. 5a the important feature in the Raman spectra
                                                                                                    are the prominent Raman modes at 641 and 496 cm−1
                                                                                                    corresponding to B2g stretching mode and A1g breath-
shown in the main panel of Fig. 3b. In the paramagnetic
                                                                                                    ing mode respectively. These Raman modes are due to
region above T c , the inverse magnetic susceptibility can
                                                                                                    stretching, bending and rotation of (Co/Mn)O6 octahe-
be fitted with conventional Curie Weiss law described
                                                                                                    dra. It is confirmed from the theoretical lattice dynam-
as:[32, 33]
                                                                                                    ics that the strong sharp peak around 636 cm−1 origi-
                                                                                                    nates from symmetric stretching of the (Co/Mn)O6 oc-
                       C                                                                            tahedra, whereas the band at around 496 cm−1 describes
           χ=                                                                          (1)          a mixed type vibration of antisymmetric stretching and
                     T − θP
                                                                                                    bending.[34] Additionally, the modes at ∼1278 cm−1
    Here C is Curie Constant and θP paramagnetic Curie                                              represent the second-order overtones of the breathing
temperature. We have observed that the inverse suscep-                                              mode.[35] The temperature dependent Raman spectra
tibility is varying linearly with the temperature above                                             show variation in the peak positions and line width cor-
T c . The susceptibility data of Yb2 CoMnO6 in the tem-                                             responding to each mode. The line shape along with
perature range 70 K to 200 K is fitted with Curie Weiss                                             the Lorentzian fitting is shown for phonon mode at 641
law given in Eq. 1. The fitting parameters obtained from                                            cm−1 is shown in Fig. 5b.
fitting of χ−1 with Eq. 1 in Fig. 3b were used to calcu-                                               To understand the presence of spin-phonon coupling
late Curie constant and θP . The obtained values of C                                               in Yb2 CoMnO6 , we have analyzed the Raman data
and θP for Yb2 CoMnO6 are 15.470(2) emu K mole−1                                                    of present series with the following anharmonic decay
Oe−1 and 14.08 K respectively. The positive value of                                                model:[26, 36]
θP signifies that the ferromagnetic ordering is present
in Yb2 CoMnO6 sample. Further, the effective√magnetic
moment is calculated using formula µe f f = 3CkB/N
                                                                                                                                                      
                                                                                                                                       2            
where C is obtained from the slope of Curie Weiss fit-                                                   ω(T ) = ω0 − C 1 +          ~ω               (2)
                                                                                                                                         2kB T ) − 1
                                                                                                                                             0
                                                                                                                                  exp
                                                                                                                                                           
ting in Fig. 3b. The value of µe f f is 11.12(6) µB /f.u.
    Isothermal magnetization i.e. the variation of magne-
tization against temperature M(H) data have been col-                                                   where ω0 and C are the intrinsic frequency of the
lected at 25 K and 2 K up to ±50 kOe applied magnetic                                               optical mode and anharmonic coefficient, respectively.
field as shown in Fig. 4a and 4b respectively. M(H)                                                 ω(T ) describes the expected temperature dependence of
curve does not show any hysteresis at 25 K, however,                                                a phonon mode frequency due to anharmonic phonon-
we observe a slight slope change around 20 kOe in both                                              phonon scattering.
positive and negative magnetic field directions. The                                                    The temperature dependent Raman shift (ω(T)) at
M(H) at 2 K is completely different from M(H) curve at                                              641 cm−1 is shown in Fig. 6a. We have fitted the
25 K. M(H) at 2 K shows a large hysteresis which sug-                                               Raman mode with anharmonic decay model shown in
gests the overall ferromagnetic nature of Yb2 CoMnO6 .                                              Eq.2. The ω(T) fitted well with this model above
Further, the magnetic moment does not show any signs                                                T c , however, we have observed that the ω(T) deviates
                                                                                                5
(a)                                                                     (b)
                                                                                                                                                          10 K
                                                                                                    150 K
                            Intensity (a.u.)

                                                                                                                                      Intensity (a.u.)
                                                                            10 K

                                               100         300        500          700         900               1100      1300                          600     620       640    660        680         700
                                                                                                        -1                                                                              -1

                                                                  Raman Shift (cm                            )                                                         Raman shift (cm )

Figure 5: (Color online) (a) Raman spectra of Yb2 CoMnO6 measured at different temperatures. (b) shows the line shape and its Lorentzian fitting
of B2g Raman mode at 641 cm−1 .

                   642.5                                                           23
                                                                                         (b)
                                                                                                                                                   3.5. Dielectric study
                                                                      (a)

                                                                                                                                                       Fig. 7a and 7b represent the temperature dependent
                   642.0
                                                                                                                                                   real and imaginary part of complex dielectric permittiv-
 )
-1

                                                                                                                                                   ity ǫ ′ and tan δ respectively measured in the tempera-
 Raman shift (cm

                                                                                   21
                   641.5
                                                                                                                                                   ture range 20 K to 300 K at different frequencies for
                                                                            FWHM

                   641.0
                                                                                                                                                   Yb2 CoMnO6 . Further, for relaxor systems with relax-
                                                                                   19                                                              ation mechanisms, each relaxation component will cor-
                   640.5
                                                                                                                                                   respond to plateaus in ǫ ′ (T) and respond with peaks in
                                                T
                                                    c
                                                                                                T
                                                                                                    c
                                                                                                                                                   tan δ. For this material, we have observed that with in-
                   640.0                                                           17                                                              creasing temperature the ǫ ′ at low temperatures ǫ ′ in-
                        0                      40        80     120    160           0         40            80      120    160
                                                                                                                                                   creases slowly however with increasing temperature ǫ ′
                                                        T (K)                                                T (K)
                                                                                                                                                   increases sharply. Further, with increasing frequencies,
Figure 6: (Color online) Temperature Variation of (a) Raman shift (b)
                                                                                                                                                   ǫ ′ decreases sharply. The higher value of ǫ ′ at low fre-
FWHM for Raman mode at 641 cm−1 corresponding to stretching of                                                                                     quency is attributed to the accumulation of the charges
Co/MnO6 for Yb2 CoMnO6 . The solid line is fitting due to Eq. 2                                                                                    at grain boundaries On careful observation of tangent
                                                                                                                                                   loss curve tan δ, it is seen that there is a broad hump
                                                                                                                                                   at low temperature which is a feature of relaxor phe-
                                                                                                                                                   nomenon. The observed relaxation is frequency depen-
                                                                                                                                                   dent and shifts to higher temperatures with increasing
from anharmonic behavior around T c shown in the fig-                                                                                              frequency.
ure where T c guided by the dotted line. The devia-                                                                                                    The relaxation mechanisms and its origin can be an-
tion of ω(T) around T c appears due to phonon renor-                                                                                               alyzed by fitting the peaks in tan δ with the Arrhenius
malization caused by ferromagnetic ordering. This re-                                                                                              law given by, τtanδ = τ0 exp(-Ea/KB T ) where, T is the
sult suggests a spin-phonon coupling in Yb2 CoMnO6 .                                                                                               temperature where peak occurs in tangent loss curve at
Such behavior has also been reported for many other                                                                                                a particular frequency τtanδ , τ0 and Ea are characteristic
compounds.[35, 36, 37] It is further noted that the tem-                                                                                           relaxation time and activation energy respectively and,
perature dependent line width of this phonon mode de-                                                                                              kB is the Boltzmann constant.[38, 39, 40, 42, 43]
creases with decreasing temperature as shown in Fig.                                                                                                   Fig. 8 shows the variation of relaxation time with ab-
6b. It is evident from the figure that the line width also                                                                                         solute temperature i.e. lnτ vs 103 /T. It is evident from
shows a deviation from anharmonic behavior across                                                                                                  the figure that the relaxation time is well fitted with Ar-
T c . This deviation is attributed to the additional scat-                                                                                         rhenius law which suggests the thermally activated re-
tering mechanism involved such as spin-phonon cou-                                                                                                 laxation mechanism. From the fitting parameters, we
pling. Thus it is evident from Raman study that the                                                                                                have calculated activation energy Ea = 0.153 eV. To fur-
spin-phonon coupling is present in Yb2 CoMnO6 .                                                                                                    ther understand the dielectric response we have mea-
                                                                                                                                  6
3
                     750                                                                             10
                                                                    (a)                                                 10 Hz          (b)
                                    10 Hz
                                                                                                                        100 Hz
                                    100 Hz
                                                                                                                        1 kHz
                                    1 kHz
                                                                                                          1
                     500            10 kHz                                                           10                 10 kHz

                                                                                               tan
                                                                                                                        100 kHz
                                    100 kHz
                                                                                                                        1 MHz
                                    1 MHz
                 '

                                                                                                       -1
                     250                                                                             10

                      0                                                                                -3
                                                                                                     10
                           0   50               100             150       200   250    300                    0        50       100    150    200   250   300

                                                                T (K)                                                                 T (K)

Figure 7: (Color online) Temperature dependent (a) real part of complex dielectric permittivity (ǫ ′ ) (b) loss tangent (tan δ) measure for Yb2 CoMnO6
in the temperature range of 20 K to 300 K at various frequencies.

        -2                                                                                           3.6. Impedance spectroscopy

        -4
                                                                                                         Fig. 10a shows the real part of complex impedance
                                                                                                     (Z ′ ) plotted as a function of frequency in the frequency
        -6                                                                                           range 1 Hz to 5.5 MHz at various temperatures between
                                                    3
                                                        e
                                                            V
                                                                                                     50 K to 300 K. For clarity both the axis are in loga-
                                                5
        -8                             0
                                           .1                                                        rithmic scales. It is quite evident from the figure that
                                   =
                                                                                                     the Z ′ decreases with increasing temperature. At low
  ln

                               E

       -10                                                                                           temperature Z ′ gradually decreases with increasing fre-
                                                                                                     quency, however, at the temperature above 100 K the Z ′
       -12                                                                                           initially remains independent of frequency then at the
                                                                                                     higher frequency it began to decreases. Further, the fre-
       -14                                                                                           quency independent region moves to the high frequency
             3         4       5            6                   7         8     9     10             region with increasing temperature. Further, it is ob-
                                                                    -1                               served that at high frequency and high temperature the
                                    1000/T (K )
                                                                                                     Z ′ almost similar. This feature possibly is due to the
Figure 8: (Color online) Variation of relaxation time against normal-
                                                                                                     release of accumulated space charges at high tempera-
ized temperature i.e ln τ vs 1000/T obtained from tan δ plot.                                        tures hence contribute to the enhancement of conduc-
                                                                                                     tion in this material at high temperatures. The imagi-
                                                                                                     nary part of impedance (Z ′′ ) is shown in Fig. 10b for a
sured the frequency dependent ǫ′ and tan δ over the                                                  wide frequency range. Z ′′ shows a peak which attains
frequency range 1 Hz to 5.5 MHz for Yb2 CoMnO6 at                                                      ′′
                                                                                                     Zmax    for all the curves measured at different tempera-
different temperatures. In Fig. 9a we observed that                                                  tures, further it is evident that the peak moves towards
Yb2 CoMnO6 exhibits high dielectric constant at low                                                  higher frequency with increasing temperature.
frequency and high temperature. The dielectric spec-                                                     We know that the most probable relaxation time (τ)
trum is shown in Fig. 9a clearly shows two plateaus well                                             can be determined for relaxation system by identifying
separated by dispersion indicated by the arrow (Fig.                                                 the position of the loss peak in the Z ′′ vs log ( f ) plots
9a). The separate plateau in Fig. 9a are attributed to                                               using the relation:[38, 39, 41, 42, 43]
static and optical dielectric constant. Further, the fre-
quency dependent dielectric constant shows the disper-
sion which moves to the higher frequency with increas-                                                                 1   1
                                                                                                                  τ=     =                                      (3)
ing temperature. Fig. 9b shows the dielectric loss as                                                                  ω 2π f
a function of frequency measured at selective tempera-
tures. The dielectric loss is relevant to the permittivity                                             where τ is relaxation time and f is the relaxation fre-
of the material.                                                                                     quency. To further understand the relaxation behavior
                                                                                           7
3                                                                                                   4
                      10                                                                                               10

                                                                          300 K
                                                                                                       (a)                                                                                     (b)
                                                                                                                            3
                                                                                                                       10
                                                                                                                                                       300 K

                                                                                           T = 25 K                                                                               T = 25 K
                                                                                                                            2
                                                                                                                       10

                                                                                                                            1
                                                                                                                       10

                                                                                                                 tan
                        2
                  '

                      10

                                                                                                                            0
                                                                                                                       10

                                                                                                                         -1
                                                                                                                       10

                              50 K                                                                                       -2
                                                                                                                       10         50 K
                        1
                      10
                                  0          1           2            3           4             5            6                           1                 3                          5               7
                              10         10         10               10      10                10           10                        10               10                        10                  10

                                                                 f (Hz)                                                                                f (Hz)

Figure 9: (Color online) Frequency dependent (a) real part of complex dielectric permittivity (ǫ ′ ) (b) loss tangent (tan δ) measure for Yb2 CoMnO6
at various temperatures between 25 K and 300 K in the frequency range 1 Hz to 5.5 MHz.

      1011                                                  120
                      75 K
                                              (a)                     (c)                                                        -2
      109                      T = 25 K
                                                            100
      107                                                                                                                        -4
 Z'

                                                                                                                                                                            V
      105                                                       80                                  300 K                                                           0
                                                                                                                                                                        e
              300 K
                                                                                                                                 -6                            .3
                                                                                                    275 K                                                  0
      103                                                                                                                                              =
                                                     Z" (10 )
                                                    6

             100 101 102 103 104 105 106 107
                                                                                                    250 K
                                                                                                                                                   E
                                                                60
                                                                                                                        ln

                                                                                                    225 K
                            f (Hz)                                                                                               -8
      1011
                                                                                                    200 K

                           75 K               (b)
      109                                                       40                                                              -10
                                      T = 25 K

      107
 Z"

                                                                20                                                              -12
      105

      103              300 K                                                                                                      3.0        3.5           4.0                  4.5        5.0        5.5   6.0
                                                                0
             100 101 102 103 104 105 106 107                     0    20    40        60       80 100 120                                                                                 -1

                                                                              Z' (10 )
                                                                                           6
                                                                                                                                                                1000/T (K )
                            f (Hz)

Figure 10: (Color online) (a) Frequency dependent real part of                                                         Figure 11: (Color online) Variation of relaxation time against normal-
impedance Z ′ measure at different temperatures. (b) Frequency de-                                                     ized temperature i.e ln τ vs 1000/T obtained from Z′′ plot.
pendent imaginary part of impedance Z ′′ measure at various temper-
atures. (c) real Z ′ and imaginary part Z ′′ plotted in terms of Nyquist
plot Z ′ vs Z ′′ .

we have plotted the relaxation time τ vs inverse temper-                                                                  Fig. 10c shows the Z ′ vs Z ′′ in the form of Nyquist
ature 103 /T (K−1 ). Fig. 11 shows the temperature varia-                                                              plots at some selective temperatures measure in the wide
tion of τ, it is observed that the relaxation time follows                                                             frequency range 1 Hz to 5.5 MHz. It is quite evident
Arrhenius behavior given as: [42, 43, 44]                                                                              from the figures that the plot gives the semicircle in the
                                                                                                                       whole range of temperature. The experimentally ob-
                                                                                                                       tained impedance data for Yb2 CoMn6 is plotted on the
                                                                                                                       complex plane in terms of the Nyquist plot i.e. Z′ vs Z′′ .
                                         !
                                  −Ea
        τb = τ0 exp                                                                                     (4)            The semicircle in the Nyquist plots has depressed which
                                  kB T
                                                                                                                       suggests that the non-Debye type of relaxation is found
  where τ0 is the pre-exponential factor, k B the Boltz-                                                               in this material. It also manifests that there is a distribu-
mann constant and T the absolute temperature. From                                                                     tion of relaxation time instead of a single relaxation time
the fitting parameters, the activation energy (Ea ) has                                                                in the material. Further, it is observed that the radius of
been calculated and is found to be 0.15 eV.                                                                            semicircles decreases with increasing temperature.
                                                                                                                 8
0.015

                         0.06
                                                                                                                    10 Hz                   (b)
                                                                                                0.012               100 Hz

                                                                                                                    1 kHz

                                                                                                                    10 kHz
                         0.04                                                                   0.009
                                                                                                                    100 kHz

                                                                                                                    1 MHz
                    M'

                                                                                           M"
                                        10 Hz
                                                                                                0.006
                                        100 Hz
                         0.02           1 kHz

                                        10 kHz                                                  0.003

                                        100 kHz

                                        1 MHz
                                                                                                0.000
                         0.00

                            0           50               100       150   200   250   300            0              50            100            150        200    250       300

                                                               T (K)                                                                        T (K)

Figure 12: (Color online) (a) Variation of real part of electrical modulus (M ′ ) with temperature. (b) Imaginary part of electrical modulus M ′′ as a
function of temperature.

        -4
                                                                                                stants, which once again suggests the material is non-
                                                                                                Debye-type.
        -6                                                                                         To understand the relaxation mechanism we can have
                                                     e
                                                         V                                      plotted the relaxation time as a function of absolute tem-
        -8
                                        0
                                            .2
                                                 6
                                                                                                perature i.e. τ vs 103 /T shown in Fig. 13. The relax-
                                    =
                                                                                                ation time is distributed and suggests that the relaxation
       -10                      E
                                                                                                mechanism is thermally activated in nature and follows
  ln

       -12                                                                                      Arrhenius behavior given by:[42, 43, 44]

       -14                                                                                                                                       !
                                                                                                                                   −Ea
                                                                                                        τ = τ0 exp                                                                                   (5)
       -16                                                                                                                         kB T
             3        4                 5                      6           7         8          where τ0 is pre-exponent factor, kB is Boltzmann con-
                                                               -1
                                                                                                stant and Ea is the activation energy. we have fitted the
                                    1000/T (K )                                                 data with above Eq. as shoown in Fig. 13 and found that
                                                                                                the data fitted well. From the fittng parameter we have
Figure 13: (Color online) Variation of relaxation time against normal-                          calculated the activation energy Ea = 0. 26 eV
ized temperature i.e ln τ vs 1000/T obtained from M′ ′ plot.
                                                                                                              -2
                                                                                                        10

3.7. Electrical modulus                                                                                                                     300 K

   Information of interface polarization, relaxation time,                                              10
                                                                                                              -4

electrical conductivity and grain boundary conduction
effects, etc can be deduced from the electrical modu-
                                                                                                              -6
lus of materials. Figs. 12a and 12b show the tem-                                                       10
                                                                                                  ac

perature dependent real (M ′ ) and imaginary (M ′′ ) part
electrical modulus obtained at selective frequencies for                                                      -8
                                                                                                                                                                                   T = 25 K

                                                                                                        10
Yb2 CoMnO6 in the temperature range of 20 K to 300
K.                                                                                                                                                                        50 K

   Fig. 12b shows variation of the M ′′ with frequency                                                  10
                                                                                                             -10

at selected temperatures. Once again, M ′′ spectroscopy                                                                 10
                                                                                                                             0
                                                                                                                                       10
                                                                                                                                            1
                                                                                                                                                      10
                                                                                                                                                           2
                                                                                                                                                                 10
                                                                                                                                                                      3
                                                                                                                                                                          10
                                                                                                                                                                               4
                                                                                                                                                                                   10
                                                                                                                                                                                        5
                                                                                                                                                                                            10
                                                                                                                                                                                                 6
                                                                                                                                                                                                     10
                                                                                                                                                                                                           7

plot reveals relaxation phenomena in the material. The
                                                                                                                                                                 f (Hz)
maximum value (M ′′ ) in the M ′′ vs log f plot shows
peak shifts to the higher frequency, which suggests that                                        Figure 14: (Color online) Frequency dependence plot of the ac con-
hopping of charge carriers is predominantly thermally                                           ductivity (σac ) for temperatures ranging from 50 K to 300 K are
activated. The asymmetric broadening of the peak in-                                            shown for Yb2 CoMnO6 .
dicates the spread of relaxation with different time con-
                                                                                           9
4.5
                                                 10 Hz                10 kHz
                                          (a)
                                 -2              100 Hz               100 kHz                                                                        (b)
                           10                    1 kHz                1 MHz
                                                                                                  4.0

                                                                                           (eV)
                                 -4
                           10
                                                                                                  3.5

                                                                                              a
                                 -6

                                                                                           E
                           10
                      ac

                                                                                                  3.0
                                 -8
                           10

                                -10                                                               2.5
                           10

                                -12
                           10                                                                     2.0
                                                                                                             1        2        3        4        5         6
                                      0         20           40                  60                     10       10       10       10       10        10
                                                             -1
                                                     1000/T (K    )                                                        f (Hz)

Figure 15: (Color online) (a) The variation of σac with absolute temperature (103 /T) is shown for Yb2 CoMnO6 .The solid lines are due to fitting
wth Eqn. 7. (b) Variation of activation energy as a function of frequency for Yb2 CoMnO6 ..

3.8. Electric conductivity                                                                   4. Conclusion
                                                                                                Yb2 CoMnO6 nano-crystalline was successfully syn-
                                                                                             thesis by sol-gel method. In the present study, we report
   To further understand the charge hopping and electri-
                                                                                             structural, magnetic, dielectric and transport properties
cal properties we have investigated the AC conductivity
                                                                                             of nano-crystalline Yb2 CoMnO6 . The structural analy-
in Yb2 CoMnO6 . The AC conductivity is calculated by
                                                                                             sis shows that the sample is in single phase and adopt
using the relation σac = ǫ0 ωǫ ′′ .[45, 46] Fig. 14 shows
                                                                                             monoclinic crystal structure with P21 /n space group.
the variation of AC conductivity with frequency i.e. σac
                                                                                             Magnetization study reveals that the Yb2 CoMnO6 is a
vs f at some selective temperatures in the range 50 K to
                                                                                             ferromagnetic material that undergoes PM-FM phase
300 K. It is evident from the figure that at low frequen-
                                                                                             transition around T c ∼56 K. The material also shows
cies the conductivity is independent of frequency and
                                                                                             antiferromagnetic ordering at low temperature. Raman
gives a plateau region at all temperatures. In this region
                                                                                             study shows spin-phonon coupling present in this mate-
of frequency, the conduction is mainly dominated by
                                                                                             rial. Dielectric measurement shows a strong dispersion
DC conductivity (σdc ). However, at higher frequencies,
                                                                                             in dielectric constant and tangent loss shows a relax-
the conductivity increases with increasing frequency. It
                                                                                             ation phenomenon. The impedance spectroscopy shows
is further to note that the plateau region marked by DC
                                                                                             that Yb2 CoMnO6 does not follow Debye’s model. The
conductivity in Fig. 14 extends to the higher frequen-
                                                                                             Nyquist plot analysis shows non-Debye’s behavior of
cies with increasing temperature. The frequency inde-
                                                                                             Yb2 CoMnO6 . AC conductivity shows strong frequency
pendent region also suggests that the hopping charges
                                                                                             dependence at the higher frequency limit. The conduc-
carrier are absent at low frequencies.
                                                                                             tivity analysis shows that the conduction mechanism in-
   The variation of AC conductivity with absolute tem-                                       volves quantum mechanical tunneling phenomenon.
perature i.e. σac vs 103 /T at some selective frequencies
is shown in Fig. 15a. We observed that with increasing
                                                                                             5. Acknowledgment
frequency the conductivity increases. To understand the
conduction mechanism we have fitted the the conduc-                                             We acknowledge MNIT Jaipur, India for XPS data
tivity with the following formula:[41, 47, 48]                                               and AIRF (JNU) for magnetic measurement facilities.
                                                                                             We acknowledge UGC-DAE-Consortium Indore and
                   −Ea
                                      !                                                      Dr. V. G. Sathe for Raman data. We also acknowl-
      σac = σ0 exp                                                             (6)           edge Dr. A. K. Pramanik for dielectric measurement
                   kB T
                                                                                             and UPEA-II funding for LCR meter. Author Ilyas
                                                                                             Noor Bhatti acknowledges University Grants Commis-
where σ0 is pre-exponent factor, kB is Boltzmann con-                                        sion, India for financial support.
stant and Ea is the activation energy. From the fitting
parameters, we have calculated the activation energy. It
is found that the activation energy Ea increases with de-                                    References
creasing frequency as shown in Fig. 15b.                                                          [1] K. F. Wang, J. M. Liu and Z. F. Ren, Adv. Phys. 58, 321 (2009).

                                                                                      10
[2] M. Fiebig, T. Lottermoser, D. Meier and M. Trassin, Nat. Rev.            [31] S. C. Bhargava, S. Singh and S.K. Malik, Phys. Rev. B 71,
     Mater. 1(8), 16046 (2016).                                                    104419 (2005).
 [3] J. T. Heron, M. Trassin, K. Ashraf, M. Gajek, Q. He, S. Y. Yang,         [32] S. Chikazumi, Physics of ferromagnetism. English edition pre-
     D. E. Nikonov, Y-H. Chu, S. Salahuddin and R. Ramesh, Phys.                   pared with the assistance of C.D. Graham, Jr (2nd ed.). Oxford:
     Rev. Lett. 107, 217202 (2011).                                                Oxford University Press (2009)
 [4] J. Seidel, L. W. Martin, Q. He, Q. Zhan, Y.-H. Chu, A. Rother,           [33] B. D. Cullity and C. D. Graham, Introduction to Magnetic Ma-
     M. E. Hawkridge, P. Maksymovych, P. Yu, M. Gajek, N. Balke,                   terials John Wiley & Sons (2011)
     S. V. Kalinin, S. Gemming, F. Wang, G. Catalan, J. F. Scott,             [34] M. N. Iliev, M. V. Abrashev, A. P. Litvinchuk, V. G. Hadjiev, H.
     N. A. Spaldin, J. Orenstein and R. Ramesh, Nat. Mater. 8, 229                 Guo, and A. Gupta, Phys. Rev. B 75, 104118 (2007).
     (2009).                                                                  [35] C. Meyer, S. Hhn, M. Jungbauer, S. Merten, B. Damaschke, K.
 [5] T. Hoffmann, P. Thielen, P. Becker, L. Bohat, and M. Fiebig,                  Samwer, and V. Moshnyaga, J. Raman Spectrosc. 48, 46 (2017).
     Phys. Rev. B 84, 184404 (2011).                                          [36] E. Granado, A. Garca, J. A. Sanjurjo, C. Rettori, I. Torriani, F.
 [6] E. K. H. Salje, Chem. Phys. Chem. 11(5) 940 (2010).                           Prado, R. D. Sanchez, A. Caneiro and S. B. Oseroff, Phys. Rev.
 [7] S. Ravi and C. Senthilkumar, Ceramics International 43(16)                    B 60, 11879 (1999).
     14441 (2017).                                                            [37] J. Laverdiere, S. Jandl, A. A. Mukhin, V. Yu. Ivanov, V. G.
 [8] F. Yong, Y. Shi-Ming, Q. Wen, W. Wei, W. Dun-Hui and D.                       Ivanov, and M. N. Iliev, Phys. Rev. B 73, 214301 (2006).
     You-Wei, Chin. Phys. B 23(11), 117501 (2014).                            [38] A. Schonhals and F. Kremer, Broadband Dielectric Spec-
 [9] M. Lezai and N. A. Spaldin, Phys. Rev. B 83, 024410 (2011).                   troscopy Springer-Verlag Berlin Heidelberg (2003)
[10] J. Blasco, J. L. Garca-Muoz, J. Garca, J. Stankiewicz, G. Subas,         [39] K. C. Kao, Dielectric Phenomena in Solids: With Emphasis on
     C. Ritter and J. A. Rodrguez-Velamazn, Appl. Phys. Lett. 107,                 Physical Concepts of Electronic Processes Elsevier (2004).
     012902 (2015).                                                           [40] Amantulla Mansuri, Ilyas Noor Bhatti, Imtiaz Noor Bhatti and
[11] S. Yez-Vilar, E. D. Mun, V. S. Zapf, B. G. Ueland, J. S. Gardner,             Ashutosh Mishra, Journal of Advanced Dielectrics 08, No. 04,
     J. D. Thompson, J. Singleton, M. Snchez-Andjar, J. Mira, N.                   1850024 (2018).
     Biskup, M. A. Sears-Rodrguez and C. D. Batista, Phys. Rev. B             [41] J. E. Kim, S. J. Kim, H. W. Choi and Y. S. Yang, J. Korean Phys.
     84, 134427 (2011).                                                            Soc. 42, 1224 (2003).
[12] A. Banerjee, J. Sannigrahi, S. Giri, and S. Majumdar, Phys. Rev.         [42] S. R. Elliott, Adv. Phys., 36, 135 (1987).
     B 98, 104414 (2018).                                                     [43] V. K. Bhatnagar and K. L.Bhatia, J. Non-Cryst. Solids, 119, 212
[13] J. Blasco, J. Garca, G. Subas, J. Stankiewicz, J. A. Rodrguez-                (1990).
     Velamazan, C. Ritter, J. L. Garca-Munoz and F. Fauth, Phys.              [44] H. A. M. Ali and M. A. Ibrahim, Materials Science-Poland,
     Rev. B 93, 214401 (2016).                                                     34(2), 386 (2016).
[14] Ilyas Noor Bhatti, Imtiaz Noor Bhatti, R. N. Mahato and M. A.            [45] A. Sing, A. Gupta and R. Chatterjee, Appl. Phys. Lett. 93,
     H. Ahsan, Physics Letter A 383, 2326 (2019).                                  022902 (2008).
[15] Imtiaz Noor Bhatti, R. S. Dhaka and A. K. Pramanik, Phys. Rev.           [46] S. Thakur, R. Rai, Igor Bdikin and M.A. Valente, Ceramics
     B 96, 144433 (2017).                                                          Mater. Res. 19, 1 (2016).
[16] Imtiaz Noor Bhatti, R. Rawat, A. Banerjee and A.K. Pramanik,             [47] V. S. Puli, C. Orozco, R. Picchini and C. V. Ramana, Materials
     J. Phys.: Condens. Matter 27, 016005 (2014).                                  Chemistry and Physics 184, 82 (2016).
[17] X. Wang, W. Li, X. Wang, J. Zhang, L. Sun, C. Gao, J. Shang,             [48] C. Chen, P. Jost, H. Volker, M. Kaminski, M. Wirtssohn, U.
     Y. Hu and Q. Zhu, RSC Adv. 7, 50753 (2017).                                   Engelmann, K. Kruger, F. Schlich, C. Schlockermann, R. P. S.
[18] B. Qiu, W. Guo, Z. Liang, W. Xia, S. Gao, Q. Wang, X. Yu, R.                  M. Lobo and M. Wuttig, Phys. Rev. B 95, 094111 (2017).
     Zhao and R. Zou, RSC Adv. 7,13340 (2017).
[19] H. Xia, D. Zhu, Z. Luo, Y. Yu, X. Shi, G. Yuan and J. Xie,
     Scientific Reports 3 2978 (2013).
[20] T. Hishida, K. Ohbayashi, and T. Saitoh, J. Appl. Phys. 113,
     043710 (2013).
[21] R. C. Sahoo, D. Paladhi and T. K. Nath, Journal of Magnetism
     and Magnetic Materials 436, 77 (2017).
[22] Y. Cao, W. Li, K. Xu, Y. Zhang, T. Ji, R. Zou, J. Yang, Z. Qin
     and J. Hu, J. Mater. Chem. A 2, 20723 (2014).
[23] S. Ch. Sarma, U. Subbarao, Y. Khulbe, R. Jana and S. C. Peter,
     J. Mater. Chem. A 5,23369 (2017).
[24] Z. Tiana, L. Zhengc, Z. Li, J. Li and J. Wanga, Journal of the
     European Ceramic Society 36, 2813 (2016).
[25] Ilyas Noor Bhatti, R. N. Mahato, Imtiaz Noor Bhatti, and M. A.
     H. Ahsan, Physica B: Condensed Matter 558, 59 (2019).
[26] Ilyas Noor Bhatti, Imtiaz Noor Bhatti, R. N. Mahato and M. A.
     H. Ahsan, Ceramics International 46, 46 (2020).
[27] Renu Gupta, Imtiaz Noor Bhatti abd A. K. Pramanik, J. Phys.:
     Condens. Matter 32, 035803 (2020).
[28] Imtiaz Noor Bhatti abd A. K. Pramanik, Physics Letters A 383,
     1806 (2019).
[29] Ilyas Noor Bhatti, Rabindra Nath Mahato, Imtiaz Noor Bhatti
     and M.A.H. Ahsan, Materials Today: Proceedings, 17, Part 1,
     216 (2019).
[30] S. C. Bhargava, S. Singh and S.K. Malik, Journal of Magnetism
     and Magnetic Materials 311, 594 (2007).

                                                                         11
You can also read