MULTIPHASE CHEMISTRY EXPERIMENT IN FOGS AND AEROSOLS IN THE NORTH CHINA PLAIN (MCFAN): INTEGRATED ANALYSIS AND INTENSIVE WINTER CAMPAIGN 2018

Page created by Sidney Jimenez
 
CONTINUE READING
MULTIPHASE CHEMISTRY EXPERIMENT IN FOGS AND AEROSOLS IN THE NORTH CHINA PLAIN (MCFAN): INTEGRATED ANALYSIS AND INTENSIVE WINTER CAMPAIGN 2018
Faraday Discussions
                                                                                                 Cite this: Faraday Discuss., 2021, 226, 207

                                                                                                                                                                              View Article Online
                                                                                                       PAPER                                                                   View Journal | View Issue
           This article is licensed under a Creative Commons Attribution 3.0 Unported Licence.

                                                                                                 Multiphase chemistry experiment in Fogs
Open Access Article. Published on 05 oktyabr 2020. Downloaded on 26.09.2021 22:52:44.

                                                                                                 and Aerosols in the North China Plain
                                                                                                 (McFAN): integrated analysis and intensive
                                                                                                 winter campaign 2018†
                                                                                                 Guo Li, a Hang Su, *a Nan Ma,b Jiangchuan Tao,b Ye Kuang,b
                                                                                                 Qiaoqiao Wang,b Juan Hong,b Yuxuan Zhang,c Uwe Kuhn,a
                                                                                                 Shaobin Zhang,b Xihao Pan,a Nan Lu,b Min Tang,b Guangjie Zheng,                                            a

                                                                                                 Zhibin Wang,d Yang Gao,e Peng Cheng,f Wanyun Xu,g
                                                                                                 Guangsheng Zhou,h Chunsheng Zhao,i Bin Yuan,b Min Shao,b
                                                                                                 Aijun Ding,c Qiang Zhang,j Pingqing Fu, k Yele Sun, l
                                                                                                 Ulrich Pöschl a and Yafang Cheng a

                                                                                                 Received 6th August 2020, Accepted 5th October 2020
                                                                                                 DOI: 10.1039/d0fd00099j

                                                                                                 Fine-particle pollution associated with winter haze threatens the health of more than 400
                                                                                                 million people in the North China Plain. The Multiphase chemistry experiment in Fogs and
                                                                                                 Aerosols in the North China Plain (McFAN) investigated the physicochemical mechanisms
                                                                                                 leading to haze formation with a focus on the contributions of multiphase processes in
                                                                                                 aerosols and fogs. We integrated observations on multiple platforms with regional and

                                                                                                 a
                                                                                                     Max Planck Institute for Chemistry, Mainz, 55128, Germany. E-mail: h.su@mpic.de
                                                                                                 b
                                                                                                     Institute for Environmental and Climate Research (ECI), Jinan University, Guangzhou, 511443, China
                                                                                                 c
                                                                                                     School of Atmospheric Sciences, Nanjing University, Nanjing, 210023, China
                                                                                                 d
                                                                                                 Research Center for Air Pollution and Health, College of Environmental and Resource Sciences, Zhejiang
                                                                                                 University, Hangzhou, China
                                                                                                 e
                                                                                                 Key Laboratory of Marine Environment and Ecology, Ministry of Education, Institute for Advanced Ocean
                                                                                                 Study, Ocean University of China, Qingdao, 266100, China
                                                                                                 f
                                                                                                     Institute of Mass Spectrometry and Atmospheric Environment, Jinan University, Guangzhou, 511443, China
                                                                                                 g
                                                                                                 State Key Laboratory of Severe Weather, Key Laboratory for Atmospheric Chemistry, Institute of Atmospheric
                                                                                                 Composition and Environmental Meteorology, Chinese Academy of Meteorological Sciences, Beijing, 100081,
                                                                                                 China
                                                                                                 h
                                                                                                 Gucheng Experimental Station of Ecological and Agricultural Meteorology, Chinese Academy of
                                                                                                 Meteorological Sciences, Beijing, 100081, China
                                                                                                 i
                                                                                                     Department of Atmospheric and Oceanic Sciences, School of Physics, Peking University, Beijing, China
                                                                                                 j
                                                                                                 Ministry of Education Key Laboratory for Earth System Modeling, Department of Earth System Science,
                                                                                                 Tsinghua University, Beijing 100084, China
                                                                                                 k
                                                                                                     Institute of Surface-Earth System Science, Tianjin University, Tianjin, 300072, China
                                                                                                 l
                                                                                                 State Key Laboratory of Atmospheric Boundary Layer Physics and Atmospheric Chemistry, Institute of
                                                                                                 Atmospheric Physics, Chinese Academy of Sciences, Beijing, China
                                                                                                 † Electronic supplementary information (ESI) available. See DOI: 10.1039/d0fd00099j

                                                                                                 This journal is © The Royal Society of Chemistry 2021            Faraday Discuss., 2021, 226, 207–222 | 207
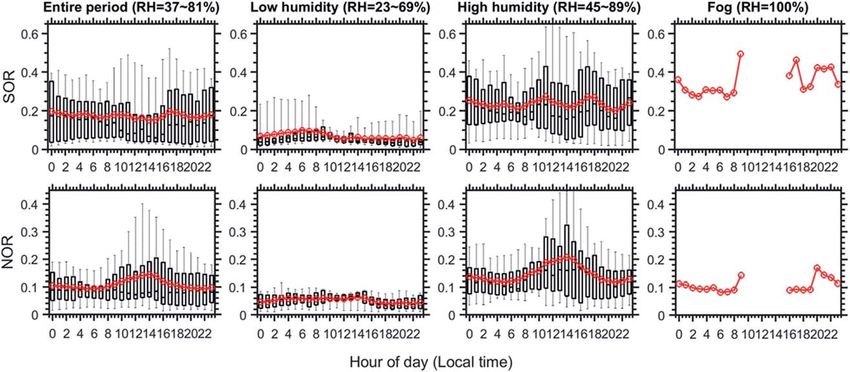
MULTIPHASE CHEMISTRY EXPERIMENT IN FOGS AND AEROSOLS IN THE NORTH CHINA PLAIN (MCFAN): INTEGRATED ANALYSIS AND INTENSIVE WINTER CAMPAIGN 2018
View Article Online
                                                                                                 Faraday Discussions                                                                       Paper
                                                                                                 box model simulations to identify and characterize the key oxidation processes producing
                                                                                                 sulfate, nitrate and secondary organic aerosols. An outdoor twin-chamber system was
                                                                                                 deployed to conduct kinetic experiments under real atmospheric conditions in
                                                                                                 comparison to literature kinetic data from laboratory studies. The experiments were
                                                                                                 spanning multiple years since 2017 and an intensive field campaign was performed in
           This article is licensed under a Creative Commons Attribution 3.0 Unported Licence.

                                                                                                 the winter of 2018. The location of the site minimizes fast transition between clean and
                                                                                                 polluted air masses, and regimes representative for the North China Plain were
Open Access Article. Published on 05 oktyabr 2020. Downloaded on 26.09.2021 22:52:44.

                                                                                                 observed at the measurement location in Gucheng near Beijing. The consecutive multi-
                                                                                                 year experiments document recent trends of PM2.5 pollution and corresponding
                                                                                                 changes of aerosol physical and chemical properties, enabling in-depth investigations of
                                                                                                 established and newly proposed chemical mechanisms of haze formation. This study is
                                                                                                 mainly focusing on the data obtained from the winter campaign 2018. To investigate
                                                                                                 multiphase chemistry, the results are presented and discussed by means of three
                                                                                                 characteristic cases: low humidity, high humidity and fog. We find a strong relative
                                                                                                 humidity dependence of aerosol chemical compositions, suggesting an important role
                                                                                                 of multiphase chemistry. Compared with the low humidity period, both PM1 and PM2.5
                                                                                                 show higher mass fraction of secondary inorganic aerosols (SIA, mainly as nitrate,
                                                                                                 sulfate and ammonium) and secondary organic aerosols (SOA) during high humidity and
                                                                                                 fog episodes. The changes in aerosol composition further influence aerosol physical
                                                                                                 properties, e.g., with higher aerosol hygroscopicity parameter k and single scattering
                                                                                                 albedo SSA under high humidity and fog cases. The campaign-averaged aerosol pH is
                                                                                                 5.1  0.9, of which the variation is mainly driven by the aerosol water content (AWC)
                                                                                                 concentrations. Overall, the McFAN experiment provides new evidence of the key role
                                                                                                 of multiphase reactions in regulating aerosol chemical composition and physical
                                                                                                 properties in polluted regions.

                                                                                                 1. Introduction
                                                                                                 In the recent decade, frequently occurring severe haze events in the North China
                                                                                                 Plain (NCP) have triggered numerous studies on the underlying formation
                                                                                                 mechanisms, and the contribution of multiphase chemistry to haze formation
                                                                                                 has become one of the focal points.1–4 Besides directly emitted primary pollut-
                                                                                                 ants,5,6 high levels of secondary inorganic aerosols (SIA, mainly sulfate, nitrate
                                                                                                 and ammonium) and secondary organic aerosols (SOA) have been observed
                                                                                                 during haze episodes in many regions of China. As an important component of
                                                                                                 ne particles, sulfate shows rapid formation during haze events and this high
                                                                                                 growth rate could not be explained by current state-of-the-art models, suggesting
                                                                                                 the existence of yet unknown sources of sulfate.2 Cheng et al.1 discovered that
                                                                                                 high rates of sulfate production and large differences between observed and
                                                                                                 modeled sulfate concentrations were related to high aerosol water content (AWC),
                                                                                                 suggesting that aqueous-phase oxidation in aerosol water may play a key role,
                                                                                                 following different reaction pathways depending on aerosol pH and oxidant
                                                                                                 concentration levels: at pH > 4.5 multiphase reactions of NO2 and O3 dominate,
                                                                                                 while at pH < 4.5 reactions involving transition metal ions (TMI) and H2O2 may
                                                                                                 prevail.1 Though the importance of multiphase reactions has been widely
                                                                                                 accepted, the exact formation pathway is still under debate.1,2,7–16 Besides sulfate,
                                                                                                 nitrate, ammonium and secondary organic aerosols also show distinct

                                                                                                 208 | Faraday Discuss., 2021, 226, 207–222   This journal is © The Royal Society of Chemistry 2021
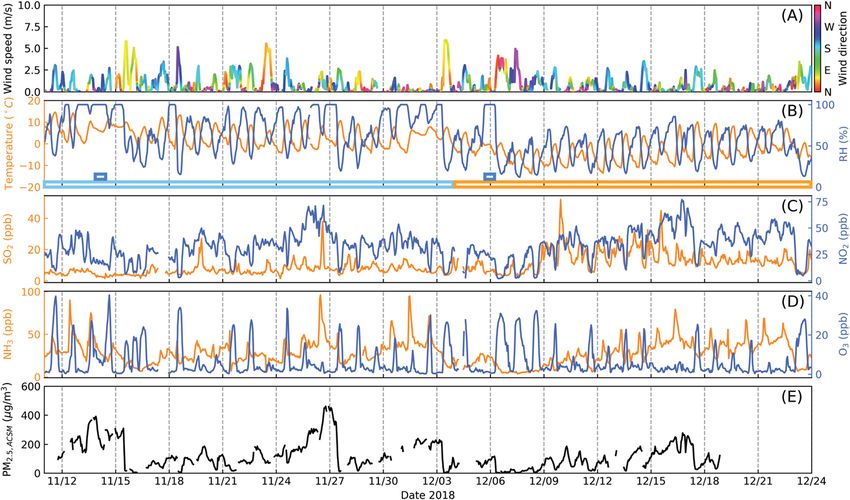
MULTIPHASE CHEMISTRY EXPERIMENT IN FOGS AND AEROSOLS IN THE NORTH CHINA PLAIN (MCFAN): INTEGRATED ANALYSIS AND INTENSIVE WINTER CAMPAIGN 2018
View Article Online
                                                                                                 Paper                                                                    Faraday Discussions
                                                                                                 characteristics during the haze events, and the increased contribution of multi-
                                                                                                 phase reactions has been suggested as a potential explanation.
                                                                                                    To elucidate the chemical mechanisms leading to severe haze formation in
                                                                                                 Beijing and the NCP, a number of eld campaigns and laboratory studies have
                                                                                                 been carried out. These early studies have revealed several challenges. For
           This article is licensed under a Creative Commons Attribution 3.0 Unported Licence.

                                                                                                 example, the observed aerosol concentrations in Beijing were found to be strongly
                                                                                                 inuenced by atmospheric transport processes, which may challenge proper
Open Access Article. Published on 05 oktyabr 2020. Downloaded on 26.09.2021 22:52:44.

                                                                                                 analysis of the prevailing chemical reactions.2 Likewise, simple laboratory
                                                                                                 experiments may differ from that in the real atmosphere, in which synergic effects
                                                                                                 or high ionic strengths may lead to orders of magnitude difference in reaction
                                                                                                 rates. Besides, many studies lack information about aerosol pH, which controls
                                                                                                 the rates of many atmospheric multiphase reactions.1
                                                                                                    Under this background, the Multiphase chemistry experiment in Fogs and
                                                                                                 Aerosols in the North China Plain (McFAN) was organized to advance our
                                                                                                 understanding of the physical–chemical mechanisms leading to severe haze
                                                                                                 formation, especially with a focus on the contributions of multiphase processes in
                                                                                                 aerosols and fogs. Instead of Beijing, we selected a site located in the central
                                                                                                 polluted region of the NCP, where the inuence of transport was smaller. We
                                                                                                 made a comprehensive design to cover more parameters (such as aerosol pH) that
                                                                                                 are required for a closure study on the multiphase reactions. We also introduced
                                                                                                 an environmental chamber system and an automatic-shiing aerosol inlet system
                                                                                                 to perform kinetic experiments under real ambient air conditions. In this over-
                                                                                                 view paper, the eld site and the instrumentation deployed during the McFAN
                                                                                                 experiment are rstly described. Then new observation-based ndings are
                                                                                                 presented.

                                                                                                 2. Experiment design and criteria for site
                                                                                                 selection
                                                                                                 One of the main scientic objectives of the McFAN experiment was to investigate
                                                                                                 the effects of multiphase processes on particle formation and evolution. To
                                                                                                 achieve this goal, the related research was schemed into three cases: (1) the
                                                                                                 formation and evolution of aerosols during fog conditions (i.e., fog case); (2) the
                                                                                                 formation and transformation of aerosols during high relative humidity days and
                                                                                                 the respective impact of multiphase reactions (i.e., high RH case); (3) the
                                                                                                 formation and transformation of aerosols during low humidity days (i.e. low RH
                                                                                                 case). Given the temporal and spatial variations of the air quality in the NCP, one
                                                                                                 intensive eld campaign was performed from 11th November to 24th December
                                                                                                 2018 at the Gucheng site, to capture fog and haze events. The observation was
                                                                                                 equipped with abundant online and offline instruments, allowing to record and
                                                                                                 analyze meteorological parameters as well as variations and properties of aerosol
                                                                                                 and gas species. The instruments and their measured parameters are listed in
                                                                                                 Table 1. Briey, the trace gas instruments (O3, NOx, CO, SO2, NH3) from Chinese
                                                                                                 Academy of Meteorological Sciences (CAMS, see Table 1) were housed in an air-
                                                                                                 conditioned room in a two-story building in the southern part of the Gucheng
                                                                                                 station,17 and the other instruments were installed in two air-conditioned
                                                                                                 containers placed on the north side of the site. To investigate multiphase reac-
                                                                                                 tion kinetics, an environmental chamber system was also employed. The

                                                                                                 This journal is © The Royal Society of Chemistry 2021   Faraday Discuss., 2021, 226, 207–222 | 209
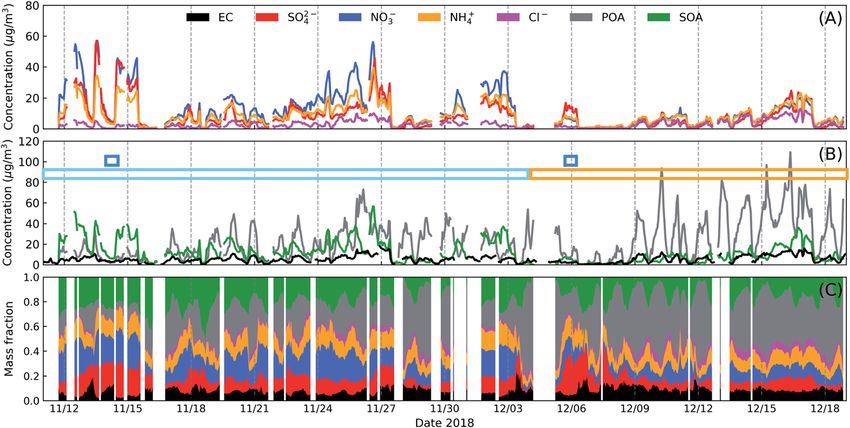
MULTIPHASE CHEMISTRY EXPERIMENT IN FOGS AND AEROSOLS IN THE NORTH CHINA PLAIN (MCFAN): INTEGRATED ANALYSIS AND INTENSIVE WINTER CAMPAIGN 2018
View Article Online
                                                                                                 Faraday Discussions                                                                       Paper
                                                                                                 Table 1 Instrumentation, measurement parameters, and partners involved in the McFAN
                                                                                                 experiment

                                                                                                              Instrument                                 Measured parameter        Organizationa

                                                                                                 Aerosols     Scanning Mobility Particle Sizer (SMPS) Aerosol number size          JNU
                                                                                                                                                      distribution (10–1000
           This article is licensed under a Creative Commons Attribution 3.0 Unported Licence.

                                                                                                                                                      nm)
                                                                                                              Aerodynamic Particle Sizer (APS)        Aerosol number size          JNU
Open Access Article. Published on 05 oktyabr 2020. Downloaded on 26.09.2021 22:52:44.

                                                                                                                                                      distribution (0.5–20
                                                                                                                                                      mm)
                                                                                                              Particle Size Magnier (PSM)            Aerosol number               MPIC
                                                                                                                                                      concentration (1–4 nm)
                                                                                                              Nephelometer                            Aerosol optical              PKU
                                                                                                                                                      properties
                                                                                                              Aethalometer AE33                       Black carbon optical         JNU
                                                                                                                                                      properties
                                                                                                              Aerosol photometer                      Aerosol optical              JNU
                                                                                                                                                      properties
                                                                                                              Capture Vaporizer Time-of-Flight        Aerosol composition          NJU, IAP-CAS
                                                                                                              Aerosol Chemical Speciation Monitor
                                                                                                              (CV-ToF-ACSM)
                                                                                                              OC/EC Aerosol Analyzer                  Aerosol composition          JNU
                                                                                                              Four-channel high-volume aerosol        Aerosol composition          JNU
                                                                                                              sampler
                                                                                                              Cascade impactor                        Aerosol composition          CAMS
                                                                                                              Cloud Condensation Nucleus Counter Aerosol hygroscopicity            JNU
                                                                                                              (CCNC)                                  (combined with DMA)
                                                                                                              Hygroscopic Tandem Differential          Aerosol hygroscopicity       JNU
                                                                                                              Mobility Analyzer (HTDMA)
                                                                                                              Humidied nephelometer                  Aerosol hygroscopicity       PKU
                                                                                                              Single-Particle soot Photometer (SP2) Black carbon                   JNU
                                                                                                              Centrifugal Particle Mass Analyzer      Black carbon density         JNU
                                                                                                              (CPMA)                                  (combined with SP2)
                                                                                                              Ground-based Counterow Virtual         Fog                          JNU
                                                                                                              Impactor (GCVI)

                                                                                                 Trace gases Proton-Transfer-Reaction Mass               VOCs                      JNU
                                                                                                             Spectrometry (PTR-MS)
                                                                                                             Chemical Ionization Mass                    VOCs                      JNU
                                                                                                             Spectrometry (CIMS)
                                                                                                             Model 43i SO2 analyzer                      SO2                       MPIC, CAMS
                                                                                                             Model 42i NOx analyzer                      NOx                       MPIC, CAMS
                                                                                                             Model 49i O3 analyzer                       O3                        MPIC, CAMS
                                                                                                             LOng Path Absorption Photometer             HONO                      JNU
                                                                                                             (LOPAP)
                                                                                                             Monitor for AeRosols and Gases in           Trace gases: HCl, SO2, JNU
                                                                                                             ambient Air (MARGA)                         NH3, HNO3, HONO
                                                                                                             Picarro G2103 gas concentration             NH3                    JNU
                                                                                                             analyzer
                                                                                                             Economical ammonia analyzer (LGR            NH3                       CAMS
                                                                                                             DLT-100)

                                                                                                 210 | Faraday Discuss., 2021, 226, 207–222   This journal is © The Royal Society of Chemistry 2021
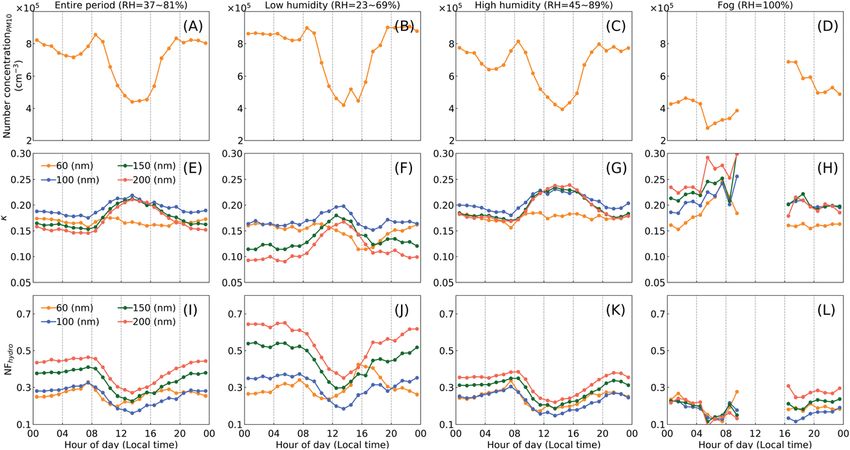
MULTIPHASE CHEMISTRY EXPERIMENT IN FOGS AND AEROSOLS IN THE NORTH CHINA PLAIN (MCFAN): INTEGRATED ANALYSIS AND INTENSIVE WINTER CAMPAIGN 2018
View Article Online
                                                                                                 Paper                                                                   Faraday Discussions
                                                                                                 Table 1   (Contd. )

                                                                                                               Instrument                                Measured parameter        Organizationa

                                                                                                 Multiphase Environmental chamber system                 Multiphase reaction       MPIC
           This article is licensed under a Creative Commons Attribution 3.0 Unported Licence.

                                                                                                 reactions                                               kinetics, sulfate
                                                                                                                                                         formation rate
Open Access Article. Published on 05 oktyabr 2020. Downloaded on 26.09.2021 22:52:44.

                                                                                                 a
                                                                                                   JNU: Jinan University; NJU: Nanjing University; PKU: Peking University; IAP-CAS: Institute
                                                                                                 of Atmospheric Physics Chinese Academy of Sciences; CAMS: Chinese Academy of
                                                                                                 Meteorological Sciences; MPIC: Max Planck Institute for Chemistry.

                                                                                                 chambers were installed on the roof of one container and the associated analyzers
                                                                                                 were located inside the container. Data obtained from the chamber experiments
                                                                                                 are still under analysis, therefore are not presented in this study.
                                                                                                     The Gucheng site was selected to carry out the McFAN campaign. The site is
                                                                                                 100 km southwest of Beijing and 35 km north of Baoding city. It is a suburban
                                                                                                 site located at the Ecological and Agricultural Meteorology Station (39 090 N,
                                                                                                 115 440 E) of the Chinese Academy of Meteorological Sciences.18 It is surrounded
                                                                                                 by agricultural elds (for cultivation of wheat and corn) and the closest residential
                                                                                                 town (Dingxing county) is 1.5 km away. The location of the site minimizes fast
                                                                                                 transition between clean and polluted air masses (e.g., in Beijing), and helps to
                                                                                                 maintain a pollution regime representative for the NCP, making it an ideal
                                                                                                 position to investigate atmospheric chemical processes.

                                                                                                 3. Overview of meteorology, gas and aerosol
                                                                                                 variation
                                                                                                 Fig. 1 shows the observed time series of meteorological parameters, concentra-
                                                                                                 tions of inorganic gas pollutants and PM2.5 during the McFAN campaign. The
                                                                                                 average wind speed observed over the whole campaign was only 0.5 m s1, but
                                                                                                 occasionally it could reach up to 8.5 m s1. For most of the measurement time,
                                                                                                 the wind speed displayed a diel variation with higher values during daytime than
                                                                                                 at nighttime. The level of ambient air relative humidity (RH) for the whole
                                                                                                 campaign can be generally classied into two stages: from 11th November to 03rd
                                                                                                 December, the daily averaged RH covered a high range of 45–89%, deemed as
                                                                                                 high humidity period; from 04th to 24th December, the daily averaged RH was in
                                                                                                 a relatively low range of 23–69%, considered as low humidity period. Moreover,
                                                                                                 two typical fog events (with RH ¼ 100%) were observed during the campaign. All
                                                                                                 these periods are indicated by the colored rectangles in Fig. 1B. The ambient
                                                                                                 temperature (T) ranged from 14  C to 18  C, with an average of 1.3  C. More
                                                                                                 information of the meteorological conditions can be found in the ESI.† The
                                                                                                 campaign-averaged concentrations of key gas pollutants were: 10 ppb for SO2,
                                                                                                 32 ppb for NO2, 28 ppb for NH3 and 7 ppb for O3 (Fig. 1C and D). The mass
                                                                                                 concentration of PM2.5 covered a wide range from 3 to 462 mg m3 (Fig. 1E)
                                                                                                 with an average of 121 mg m3. Additional information about volatile organic
                                                                                                 compounds (VOCs) can be found in Fig. S3.† Fig. 2 shows the variations of

                                                                                                 This journal is © The Royal Society of Chemistry 2021   Faraday Discuss., 2021, 226, 207–222 | 211
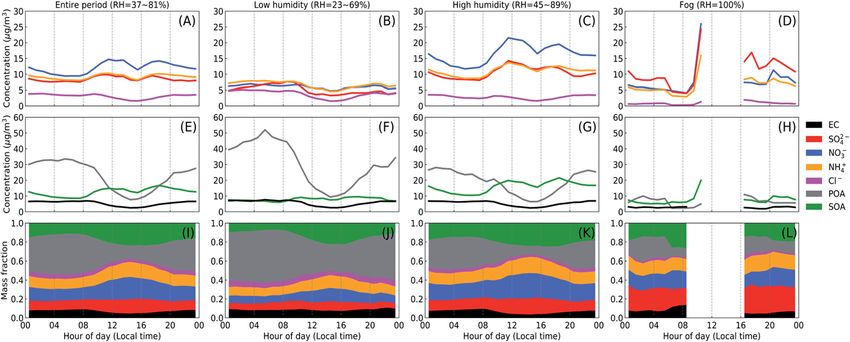
MULTIPHASE CHEMISTRY EXPERIMENT IN FOGS AND AEROSOLS IN THE NORTH CHINA PLAIN (MCFAN): INTEGRATED ANALYSIS AND INTENSIVE WINTER CAMPAIGN 2018
View Article Online
           This article is licensed under a Creative Commons Attribution 3.0 Unported Licence.   Faraday Discussions                                                                       Paper
Open Access Article. Published on 05 oktyabr 2020. Downloaded on 26.09.2021 22:52:44.

                                                                                                 Fig. 1 Time series of meteorological parameters (A and B), inorganic gas pollutants (C and
                                                                                                 D) and mass concentration of PM2.5 (E) during the McFAN campaign. The colored rect-
                                                                                                 angles in panel (B) indicate different characteristic periods: dark blue – fog, light blue –
                                                                                                 high humidity, orange – low humidity. The mass concentration of PM2.5 is obtained by
                                                                                                 summing up elemental carbon (EC) and other non-refractory aerosol components
                                                                                                 measured by the OC/EC analyzer and the CV-ToF-ACSM (Table 1), respectively.

                                                                                                 Fig. 2 Time series of submicron aerosol (PM1) mass concentrations (A and B) and mass
                                                                                                 fractions of different components (C). In panel (B), the colored rectangles have the same
                                                                                                 meaning as in Fig. 1. Positive matrix factorization analysis is employed to classify organic
                                                                                                 aerosol (OA) into various primary OA (POA) factors including hydrocarbon-like OA (HOA),
                                                                                                 cook-related OA (COA), biomass burning OA (BBOA) and coal combustion OA (CCOA),
                                                                                                 and a secondary OA (SOA) factor: oxygenated OA (OOA). More details can be found in
                                                                                                 Fig. 5 and in the work of Sun et al.19

                                                                                                 chemical compositions of submicron particles (PM1). The mean mass concen-
                                                                                                 tration of PM1 was 67 mg m3 with a maximum of 250 mg m3. In the low
                                                                                                 humidity period, the averaged contributions of inorganic components (mainly as

                                                                                                 212 | Faraday Discuss., 2021, 226, 207–222   This journal is © The Royal Society of Chemistry 2021
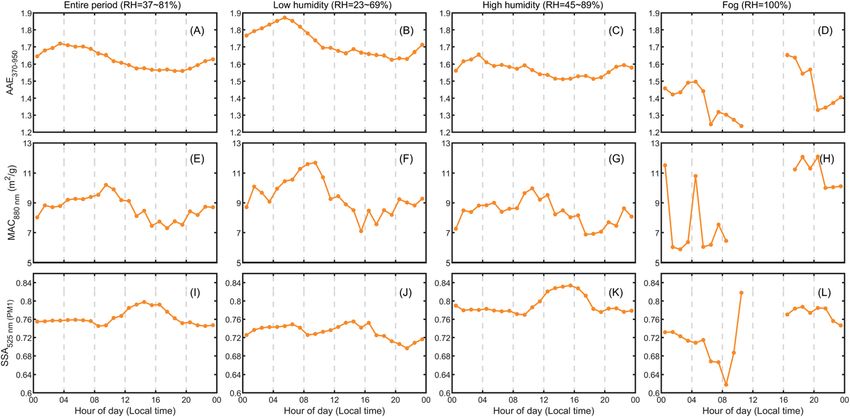
MULTIPHASE CHEMISTRY EXPERIMENT IN FOGS AND AEROSOLS IN THE NORTH CHINA PLAIN (MCFAN): INTEGRATED ANALYSIS AND INTENSIVE WINTER CAMPAIGN 2018
View Article Online
                                                                                                 Paper                                                                   Faraday Discussions
                                                                                                 nitrate, sulfate and ammonium) and organics were 34% and 57%, respectively.
                                                                                                 While in the high humidity period, the contribution of inorganics increased to
                                                                                                 50%, slightly higher than that of the organic aerosols (43%). During fog periods,
                                                                                                 the averaged mass fraction of inorganics reached 59% and the contribution of
                                                                                                 organics dropped to 34%. Among organics, the mass fraction of secondary
           This article is licensed under a Creative Commons Attribution 3.0 Unported Licence.

                                                                                                 organic aerosols (SOA) in total organic aerosols (ACSM-determined) increased
                                                                                                 from 23% in the low humidity period to 47% and 53% in high humidity and fog
Open Access Article. Published on 05 oktyabr 2020. Downloaded on 26.09.2021 22:52:44.

                                                                                                 episodes, respectively.

                                                                                                 4. Impact of multiphase processes on aerosol
                                                                                                 composition and acidity
                                                                                                 4.1. Aerosol chemical composition
                                                                                                 Ambient RH strongly inuences the reaction pathways and their magnitude.20,21
                                                                                                 Under high RH conditions (e.g., during fog and haze episodes), aerosols tend to
                                                                                                 become liquid with increased surface and volume concentrations due to hygro-
                                                                                                 scopic growth while under low RH aerosols become solid or semi-solid particles.
                                                                                                 Thus, we rst compared the aerosol composition between different RH condi-
                                                                                                 tions. Fig. 3 shows the diel variation of the composition of PM1 between three
                                                                                                 cases (as marked in Fig. 1 and 2): low humidity (RH ¼ 23–69%), high humidity
                                                                                                 (RH ¼ 45–89%) and fog (RH ¼ 100%) along with the averages of the entire
                                                                                                 campaign period. For the entire campaign (Fig. 3I), PM1 was on average composed
                                                                                                 of 9% elemental carbon (EC), 11% sulfate, 20% nitrate, 15% ammonium,
                                                                                                 3% chloride, 15% POA and 27% SOA. The inorganic mass fraction
                                                                                                 substantially increased from low humidity to high humidity and to the fog case,
                                                                                                 and SOA also showed a similar but lesser increasing trend even with a decreasing
                                                                                                 contribution of the total OA. Such phenomenon suggests enhanced formation of
                                                                                                 secondary species with increasing RH, potentially due to the multiphase
                                                                                                 processes.22 Interestingly, while the mass fraction of sulfate follows the order of
                                                                                                 low humidity < high humidity < fog periods, for nitrate the order is low humidity <

                                                                                                 Fig. 3 Diel variations of the submicron aerosol (PM1) mass concentrations (A–H) and mass
                                                                                                 fractions (I–L) of the major components of submicron aerosols (PM1) averaged over the
                                                                                                 entire campaign and focus periods with different relative humidity (RH) conditions. The
                                                                                                 solid lines in (A–H) show the mean value of hourly averaged concentrations of each
                                                                                                 component. The displayed RH range relevant to each focus period is based on daily
                                                                                                 averaged data.

                                                                                                 This journal is © The Royal Society of Chemistry 2021   Faraday Discuss., 2021, 226, 207–222 | 213
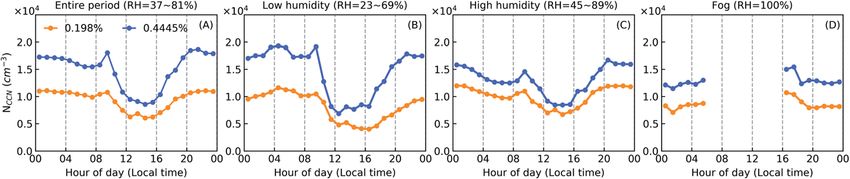
MULTIPHASE CHEMISTRY EXPERIMENT IN FOGS AND AEROSOLS IN THE NORTH CHINA PLAIN (MCFAN): INTEGRATED ANALYSIS AND INTENSIVE WINTER CAMPAIGN 2018
View Article Online
                                                                                                 Faraday Discussions                                                                       Paper
                                                                                                 fog < high humidity (Fig. 3I–L). A clear RH effect is also found on NOR and SOR
                                                                                                 (molar ratio of nitrate or sulfate to the sum of nitrate and NO2 or sulfate and SO2),
                                                                                                 which represents the degree of secondary formation of nitrate and sulfate.2,23 As
                                                                                                 shown in Fig. 4, the variations of SOR and NOR follow the same trend as the mass
                                                                                                 fraction of sulfate and nitrate. These results indicate an important role of high RH
           This article is licensed under a Creative Commons Attribution 3.0 Unported Licence.

                                                                                                 in promoting the formation of SIA and SOA, probably through multiphase reac-
                                                                                                 tions. Information of gases (SO2, NO2, NH3, O3 and VOCs) and PM2.5 concentra-
Open Access Article. Published on 05 oktyabr 2020. Downloaded on 26.09.2021 22:52:44.

                                                                                                 tions can be found in the ESI.†

                                                                                                 4.2. Size dependence of aerosol chemical composition
                                                                                                 Sun et al.19 characterized aerosol composition and sources of organic aerosol (OA)
                                                                                                 during the McFAN campaign in 2018, and also the compositional differences
                                                                                                 between PM1 and PM2.5 by using the CV-ToF-ACSM (Table 1). As depicted in Fig. 5,
                                                                                                 comparable contributions of OA and secondary inorganic aerosol (SIA) were
                                                                                                 found during the high humidity period (RH ¼ 73  24%), while the low humidity
                                                                                                 period (RH ¼ 48  18%) showed a reduced contribution of SIA. OA composition
                                                                                                 was also substantially different with a much higher contribution of secondary OA
                                                                                                 (46–47%) during the high humidity period than the low humidity phase (19–
                                                                                                 21%). In contrast, primary OA from biomass burning, coal combustion, and
                                                                                                 traffic emissions dominated OA (71–73%) during the low humidity period
                                                                                                 (Fig. 5B). These results highlight that meteorological conditions, in particular RH,
                                                                                                 play an important role in secondary aerosol formation in NCP, and hence change
                                                                                                 the contributions of primary and secondary aerosol.
                                                                                                    Sun et al.19 further analyzed the chemical differences between PM1 and PM2.5
                                                                                                 during both high and low humidity periods. As indicated in Fig. 5, aerosol
                                                                                                 composition and OA composition of PM1 and PM2.5 were relatively similar during
                                                                                                 both focus periods, despite the concentration differences by up to 30%. However,
                                                                                                 the decreases in PM1/PM2.5 ratios as a function of RH were also observed for
                                                                                                 secondary organic and inorganic aerosol species, which was likely due to the
                                                                                                 changes in aerosol hygroscopicity and phase states. In contrast, primary aerosol

                                                                                                 Fig. 4 Diel variations of the ratios of nitrate to nitrate plus NO2 (NOR) and sulfate to sulfate
                                                                                                 plus SO2 (SOR) averaged over the entire campaign and focus periods with different relative
                                                                                                 humidity (RH) conditions. The boxes and whiskers indicate percentiles (90th, 75th, 50th
                                                                                                 (median), 25th and 10th).

                                                                                                 214 | Faraday Discuss., 2021, 226, 207–222   This journal is © The Royal Society of Chemistry 2021
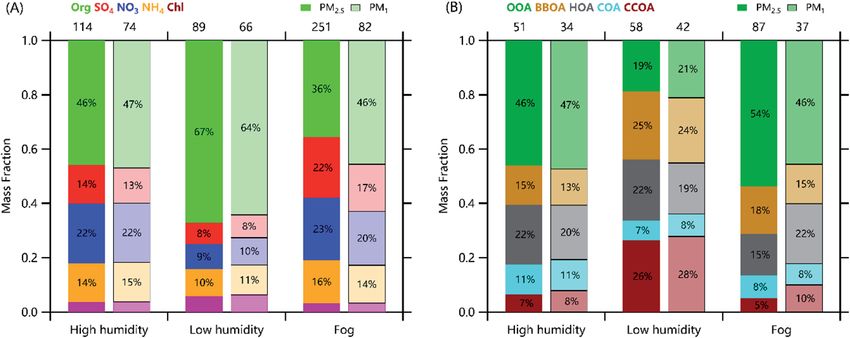
MULTIPHASE CHEMISTRY EXPERIMENT IN FOGS AND AEROSOLS IN THE NORTH CHINA PLAIN (MCFAN): INTEGRATED ANALYSIS AND INTENSIVE WINTER CAMPAIGN 2018
View Article Online
           This article is licensed under a Creative Commons Attribution 3.0 Unported Licence.   Paper                                                                   Faraday Discussions
Open Access Article. Published on 05 oktyabr 2020. Downloaded on 26.09.2021 22:52:44.

                                                                                                 Fig. 5 Average (A) chemical composition of non-refractory PM2.5 and PM1, and (B) OA
                                                                                                 composition during the focus periods with different relative humidity (RH) conditions. The
                                                                                                 numbers on the top of the figures are the average mass concentrations (mg m3) for each
                                                                                                 period. Adopted and modified from Sun et al.19

                                                                                                 species with low hygroscopicity did not show clear RH dependence of PM1/PM2.5
                                                                                                 ratios. Large differences in both mass concentrations and composition were
                                                                                                 observed during fog events. For instance, PM1 on average accounted for 33% of
                                                                                                 PM2.5 due to the rapid hygroscopic growth of aerosol particles under high RH
                                                                                                 levels, and PM2.5 showed largely elevated contributions of SIA (61% vs. 51%) and
                                                                                                 SOA (54% vs. 46%) compared with PM1. Further analysis showed that the
                                                                                                 chemical differences between PM1 and PM2.5 had negligible impacts on predic-
                                                                                                 tions of particle acidity, while they could affect aerosol liquid water content by up
                                                                                                 to 50–70%.

                                                                                                 4.3. Aerosol acidity
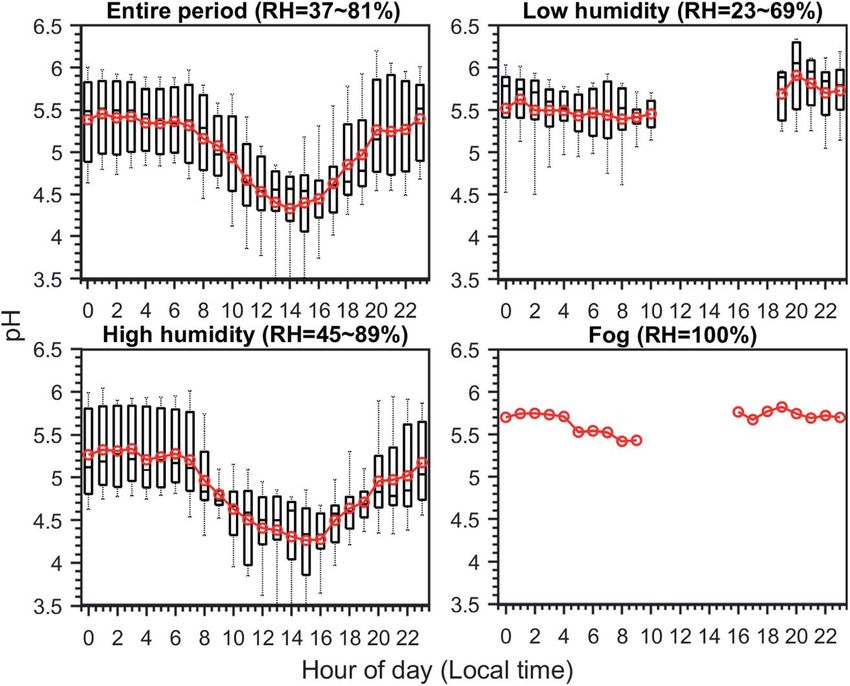
                                                                                                 To examine aerosol acidity during the campaign, we modelled the aerosol pH
                                                                                                 based on the ISORROPIA model24 and observation data. The concentrations of
                                                                                                 sulfate, nitrate, ammonium and chloride were taken from the CV-ToF-ACSM
                                                                                                 measurement, and the ammonia concentrations were taken from observations
                                                                                                 using the Picarro G2103 gas analyzer. Only the data points with RH > 40% are
                                                                                                 used here. Sensitivity studies show that the uncertainty in chloride measurements
                                                                                                 by the ACSM is expected to result in a pH variation of 0.15 to 0.35, while the
                                                                                                 missing measurements of non-volatile species (i.e., Na+, Ca2+, K+ and Mg2+) are
                                                                                                 expected to result in a pH underestimation of 0.07 to 0.35. In general, simulated
                                                                                                 gas–particle partitioning of ammonia agrees well with the observations. As shown
                                                                                                 in Fig. 6, the aerosol pH averaged 5.1  0.9 over the whole observation period. A
                                                                                                 clear diel variation is observed for the entire and high humidity periods, with an
                                                                                                 obvious drop in pH during the daytime, and bottomed around 15:00. This pH
                                                                                                 drop is mainly driven by the diel variation in RH and therefore the aerosol water
                                                                                                 content (AWC) concentrations.25 The diel variation is not complete for low
                                                                                                 humidity and fog periods, as there is no available aernoon data. The absence of
                                                                                                 aernoon data during the low humidity period is due to its low RH (
View Article Online
           This article is licensed under a Creative Commons Attribution 3.0 Unported Licence.   Faraday Discussions                                                                       Paper
Open Access Article. Published on 05 oktyabr 2020. Downloaded on 26.09.2021 22:52:44.

                                                                                                 Fig. 6 Diel variation of aerosol pH averaged over the entire campaign and focus periods
                                                                                                 with different relative humidity (RH) conditions. The boxes and whiskers indicate
                                                                                                 percentiles (90th, 75th, 50th (median), 25th and 10th), and the red circles represent
                                                                                                 arithmetic mean values. Note that the displayed RH ranges for each focus period represent
                                                                                                 daily averages. Due to limited data points at each hour, only mean values are shown for the
                                                                                                 fog period.

                                                                                                 detailed analysis on the drivers of aerosol pH can be found elsewhere (Zheng
                                                                                                 et al., Drivers of aerosol pH during the multiphase chemistry experiment in fogs
                                                                                                 and aerosols (McFAN) experiment in the North China Plain, in preparation).

                                                                                                 5. Impact of multiphase processes on aerosol
                                                                                                 physical properties
                                                                                                 5.1. Aerosol hygroscopicity and phase state
                                                                                                 Fig. 7 shows the diel variations of the measured cloud condensation nuclei (CCN)
                                                                                                 number concentration at two different supersaturation (SS) levels, under the three
                                                                                                 cases. For the entire period, NCCN was lower during daytime (09:00–20:00) than
                                                                                                 at night and this difference became more pronounced at the higher SS value.
                                                                                                 Similar phenomenon has been reported in another study at the same site during
                                                                                                 winter time.26 At larger SS values, particle size tends to be more crucial in affecting
                                                                                                 NCCN.27 The lower NCCN during daytime was likely caused by the varied particle
                                                                                                 number size distribution (see Fig. S8†) and the decreased particle number
                                                                                                 concentration (see Fig. 8A–D). Compared to the low humidity case, NCCN in the
                                                                                                 high humidity case was slightly higher at the lower SS value, which might be due
                                                                                                 to (1) the larger mass fraction of SIA (nitrate, sulfate and ammonium) and SOA

                                                                                                 216 | Faraday Discuss., 2021, 226, 207–222   This journal is © The Royal Society of Chemistry 2021
View Article Online
           This article is licensed under a Creative Commons Attribution 3.0 Unported Licence.   Paper                                                                   Faraday Discussions

                                                                                                 Fig. 7  Diel variations of CCN number concentration at two different supersaturation
Open Access Article. Published on 05 oktyabr 2020. Downloaded on 26.09.2021 22:52:44.

                                                                                                 levels averaged over the entire campaign and focus periods with different relative humidity
                                                                                                 (RH) conditions. The symbols represent the mean value of hourly averaged
                                                                                                 concentrations.

                                                                                                 Fig. 8 Diel variations of particle number concentration in PM10 size range (top row),
                                                                                                 hygroscopicity parameter k (second row) and number fraction of hydrophobic particles
                                                                                                 NFhydro for selected particle sizes (bottom row) averaged over the entire campaign and
                                                                                                 focus periods with different relative humidity (RH) conditions.

                                                                                                 found for the high humidity case in Fig. 3; (2) the increased concentration of
                                                                                                 larger-size particles under high RH. Increasing the fraction of hydrophilic inor-
                                                                                                 ganics and organics in aerosols will enhance their ability to activate into CCN,
                                                                                                 leading to a higher NCCN. However, for the fog period, NCCN was even lower than
                                                                                                 that of the low humidity case. Since fog droplets can efficiently scavenge particles
                                                                                                 with smaller sizes, the observed particle number concentration within fog events
                                                                                                 was much lower than during non-fog periods (Fig. 8). Thus, the low aerosol
                                                                                                 number concentration during fog events might result in the much less NCCN.
                                                                                                     The hygroscopicity parameter k (ref. 28 and 29) showed higher values in
                                                                                                 daytime than at night (Fig. 8E–G), indicating the potential effect of photochem-
                                                                                                 istry in enhancing particles’ hygroscopicity. Based on hygroscopicity and aerosol
                                                                                                 composition measurements during the McFAN campaign, Kuang et al.17 found
                                                                                                 that the hygroscopicity parameter of organic aerosols, kOA, showed a prominent
                                                                                                 diel variation with a peak value present near 14:30 local time. And this diel
                                                                                                 variation was highly and positively correlated with the mass fraction of oxygen-
                                                                                                 ated organic aerosols (OOA), pointing to the important role of photochemical

                                                                                                 This journal is © The Royal Society of Chemistry 2021   Faraday Discuss., 2021, 226, 207–222 | 217
View Article Online
                                                                                                 Faraday Discussions                                                                       Paper
                                                                                                 processing in enhancing kOA. Similar photochemical impact was also reported by
                                                                                                 Wang et al.27 at a suburban site in the central NCP. Moreover, an increase of k
                                                                                                 could be found with increasing ambient RH, i.e., from low humidity to fog case
                                                                                                 (Fig. 8F–H). Meanwhile, an opposite trend was observed for NFhydro, meaning that
                                                                                                 the number fraction of hydrophobic particles is getting less. Along with the
           This article is licensed under a Creative Commons Attribution 3.0 Unported Licence.

                                                                                                 results shown in Fig. 3, we conclude that the enhanced hygroscopicity of aerosols
                                                                                                 is due to the increased hydrophilic fraction which is most likely caused by either
Open Access Article. Published on 05 oktyabr 2020. Downloaded on 26.09.2021 22:52:44.

                                                                                                 high-RH favored multiphase reactions or photochemistry, and the coupling of
                                                                                                 both effects.

                                                                                                 5.2 Aerosol optical properties
                                                                                                 Aerosol optical properties have been found to show a strong RH dependence,
                                                                                                 which may result in a positive feedback and inuence the planetary boundary
                                                                                                 layer (PBL) meteorology and the haze formation.30–32 Fig. 9 shows the optical
                                                                                                 properties of aerosols under the three cases. The diel variation of the Absorption
                                                                                                 Ångström Exponent (AAE) showed higher values during nighttime than during
                                                                                                 daytime with a much higher AAE370–470 (average  std, 1.8  0.35) than AAE880–950
                                                                                                 (0.8  0.1) (Fig. S9†). This implies that, besides black carbon (BC), there existed
                                                                                                 some brown carbon (BrC), which had comparable light-absorbing capacities as
                                                                                                 BC at short wavelengths. Thus, the feature of higher nighttime AAE370–950 in
                                                                                                 Fig. 9A–C might be due to increased levels of BrC generated by domestic heating
                                                                                                 and biomass burning during the night. Signicant differences among different
                                                                                                 RH cases can be found for AAE and the Single Scattering Albedo (SSA). With
                                                                                                 increased RH from the low humidity to the high humidity case, AAE decreased
                                                                                                 from 1.7 to 1.55 and even down to 1.4 under fog conditions. The decreased
                                                                                                 AAE suggests that the fraction of light-absorbing components such as BC and BrC
                                                                                                 is reduced, due to either decreased mass fraction or changed mixing state.33,34 For
                                                                                                 the SSA, however, its values under high humidity were remarkably higher than at
                                                                                                 low humidity, indicating an enhanced fraction of light-scattering components.
                                                                                                 This phenomenon could be due to the boosted formation of SIA (i.e., nitrate,

                                                                                                 Fig. 9 Diel variations of Absorption Ångström Exponent (top row), Mass Absorption Cross
                                                                                                 section (second row), and Single Scattering Albedo (bottom row) averaged over the entire
                                                                                                 campaign and focus periods with different relative humidity (RH) conditions.

                                                                                                 218 | Faraday Discuss., 2021, 226, 207–222   This journal is © The Royal Society of Chemistry 2021
View Article Online
                                                                                                 Paper                                                                   Faraday Discussions
                                                                                                 sulfate and ammonium) and SOA through high-RH-favored multiphase reactions,
                                                                                                 as shown in Fig. 3. For example, Lim et al.35 have reported the important role of
                                                                                                 sulfate in East Asia: it could enhance SSA and also alter the absorption properties
                                                                                                 of aerosols. Moreover, in Fig. 9K, the more prominent enhancement of SSA during
                                                                                                 daytime correlates well with the enhanced formation of nitrate and SOA under the
           This article is licensed under a Creative Commons Attribution 3.0 Unported Licence.

                                                                                                 inuence of solar radiation (Fig. 3K). A recent study at the same site by Kuang
                                                                                                 et al.22 has revealed that rapid OOA formation could be induced by photochemical
Open Access Article. Published on 05 oktyabr 2020. Downloaded on 26.09.2021 22:52:44.

                                                                                                 aqueous-phase reactions. The RH effect on the Mass Absorption Cross-section
                                                                                                 (MAC), however, was negligible, and further investigations on the underlying
                                                                                                 mechanisms may be needed.

                                                                                                 6. Summary
                                                                                                 In this work, we present an overview of the preliminary results obtained from an
                                                                                                 intensive winter campaign in 2018 in the North China Plain, during the McFAN
                                                                                                 experiment. The McFAN experiment aimed at exploring the underlying mecha-
                                                                                                 nisms of haze formation and evolution, especially focusing on the effect of
                                                                                                 multiphase chemistry. The ambient RH conditions during the 45-day campaign
                                                                                                 were separated into two stages, with the rst stage staying at a relatively high RH
                                                                                                 range (daily averages about 45–89%) and the second at a low RH level (daily
                                                                                                 averages about 23–69%). Two typical fog events (RH ¼ 100%) during the obser-
                                                                                                 vation period were captured additionally. Thus, to better elucidate the potential
                                                                                                 inuence of multiphase processes, we generally present and discuss the
                                                                                                 measurement results in terms of three characteristic periods: low humidity, high
                                                                                                 humidity and fog.
                                                                                                    The aerosol composition and OA composition of PM1 and PM2.5 were relatively
                                                                                                 similar during both low and high humidity periods. However, compared with the
                                                                                                 low RH period, both PM1 and PM2.5 showed increased mass fraction of SIA
                                                                                                 (nitrate, sulfate and ammonium) and SOA during high RH and fog episodes. The
                                                                                                 enhanced contribution of SIA and SOA was most likely caused by aqueous-phase
                                                                                                 reactions favored by high RH. Moreover, the rapid growth of nitrate and SOA
                                                                                                 during daytime highlighted the important role of photochemical reactions.
                                                                                                    The change in aerosol composition could drive variations in multiple aerosol
                                                                                                 physicochemical properties. For example, the increased k at high RH reected the
                                                                                                 more hydrophilic feature of aerosols, likely due to the increased fraction of
                                                                                                 hydrophilic SIA and SOA. The calculated aerosol pH displayed a signicant diel
                                                                                                 variation, with lower pH during daytime than at nighttime. Diel variations were
                                                                                                 also found for aerosol optical properties such as AAE and SSA, but with opposite
                                                                                                 trends between the two parameters. The variations found for these parameters
                                                                                                 were most likely driven by varied ambient RH and thereby the changed aerosol
                                                                                                 composition affected by multiphase processes.

                                                                                                 Author contributions
                                                                                                 H.S. and Y.C. conceived and designed this study. H.S., Y.C. and N.M. organized
                                                                                                 the campaign. N.M., G.L., Y.S., Y.G. and G.Z. contributed to data analyses, plots
                                                                                                 and related discussions in the manuscript. S.Z., X.P., N.L. and M.T. helped to
                                                                                                 make plots and provided suggestions on experiment results discussion. J.T., Y.K.,
                                                                                                 Q.W., J.H., Y.Z., U.K., S.Z., X.P., Z.W., P.C., W.X., G.Z., C.Z., B.Y., M.S., A.D., Q.Z.,

                                                                                                 This journal is © The Royal Society of Chemistry 2021   Faraday Discuss., 2021, 226, 207–222 | 219
View Article Online
                                                                                                 Faraday Discussions                                                                       Paper
                                                                                                 P.F. and Y.S. provided measurement data. G.L. and H.S. wrote the manuscript
                                                                                                 with inputs from Y.C., G.Z., U.P. and U.K.

                                                                                                 Conflicts of interest
           This article is licensed under a Creative Commons Attribution 3.0 Unported Licence.

                                                                                                 There are no conicts to declare.
Open Access Article. Published on 05 oktyabr 2020. Downloaded on 26.09.2021 22:52:44.

                                                                                                 Acknowledgements
                                                                                                 We acknowledge the National Key Research and Development Program of China
                                                                                                 (grant no. 2017YFC0210104), the National Natural Science Foundation of China
                                                                                                 (grant no. 91644218) and the support from the Max Planck Society. G. L.
                                                                                                 acknowledges the nancial support from the China Scholarship Council (CSC).
                                                                                                 Open Access funding provided by the Max Planck Society.

                                                                                                 References
                                                                                                  1 Y. Cheng, G. Zheng, C. Wei, Q. Mu, B. Zheng, Z. Wang, M. Gao, Q. Zhang,
                                                                                                    K. He, G. Carmichael, U. Pöschl and H. Su, Sci. Adv., 2016, 2, e1601530.
                                                                                                  2 G. J. Zheng, F. K. Duan, H. Su, Y. L. Ma, Y. Cheng, B. Zheng, Q. Zhang,
                                                                                                    T. Huang, T. Kimoto, D. Chang, U. Pöschl, Y. F. Cheng and K. B. He, Atmos.
                                                                                                    Chem. Phys., 2015, 15, 2969–2983.
                                                                                                  3 Y. Sun, Q. Jiang, Z. Wang, P. Fu, J. Li, T. Yang and Y. Yin, J. Geophys. Res.:
                                                                                                    Atmos., 2014, 119, 4380–4398.
                                                                                                  4 Y. L. Sun, Z. F. Wang, P. Q. Fu, T. Yang, Q. Jiang, H. B. Dong, J. Li and J. J. Jia,
                                                                                                    Atmos. Chem. Phys., 2013, 13, 4577–4592.
                                                                                                  5 M. Li, Q. Zhang, D. G. Streets, K. B. He, Y. F. Cheng, L. K. Emmons, H. Huo,
                                                                                                    S. C. Kang, Z. Lu, M. Shao, H. Su, X. Yu and Y. Zhang, Atmos. Chem. Phys.,
                                                                                                    2014, 14, 5617–5638.
                                                                                                  6 M. Li, Q. Zhang, J. I. Kurokawa, J. H. Woo, K. He, Z. Lu, T. Ohara, Y. Song,
                                                                                                    D. G. Streets, G. R. Carmichael, Y. Cheng, C. Hong, H. Huo, X. Jiang,
                                                                                                    S. Kang, F. Liu, H. Su and B. Zheng, Atmos. Chem. Phys., 2017, 17, 935–963.
                                                                                                  7 R. Zhang, G. Wang, S. Guo, M. L. Zamora, Q. Ying, Y. Lin, W. Wang, M. Hu and
                                                                                                    Y. Wang, Chem. Rev., 2015, 115, 3803–3855.
                                                                                                  8 D. Chen, Z. Liu, J. Fast and J. Ban, Atmos. Chem. Phys., 2016, 16, 10707–10724.
                                                                                                  9 G. Wang, R. Zhang, M. E. Gomez, L. Yang, M. Levy Zamora, M. Hu, Y. Lin,
                                                                                                    J. Peng, S. Guo, J. Meng, J. Li, C. Cheng, T. Hu, Y. Ren, Y. Wang, J. Gao,
                                                                                                    J. Cao, Z. An, W. Zhou, G. Li, J. Wang, P. Tian, W. Marrero-Ortiz, J. Secrest,
                                                                                                    Z. Du, J. Zheng, D. Shang, L. Zeng, M. Shao, W. Wang, Y. Huang, Y. Wang,
                                                                                                    Y. Zhu, Y. Li, J. Hu, B. Pan, L. Cai, Y. Cheng, Y. Ji, F. Zhang, D. Rosenfeld,
                                                                                                    P. S. Liss, R. A. Duce, C. E. Kolb and M. J. Molina, Proc. Natl. Acad. Sci. U. S.
                                                                                                    A., 2016, 113, 13630–13635.
                                                                                                 10 G. Li, N. Bei, J. Cao, R. Huang, J. Wu, T. Feng, Y. Wang, S. Liu, Q. Zhang, X. Tie
                                                                                                    and L. T. Molina, Atmos. Chem. Phys., 2017, 17, 3301–3316.
                                                                                                 11 J. Shao, Q. Chen, Y. Wang, X. Lu, P. He, Y. Sun, V. Shah, R. V. Martin, S. Philip,
                                                                                                    S. Song, Y. Zhao, Z. Xie, L. Zhang and B. Alexander, Atmos. Chem. Phys., 2019,
                                                                                                    19, 6107–6123.
                                                                                                 12 T. Chen, B. Chu, Y. Ge, S. Zhang, Q. Ma, H. He and S.-M. Li, Environ. Pollut.,
                                                                                                    2019, 252, 236–244.

                                                                                                 220 | Faraday Discuss., 2021, 226, 207–222   This journal is © The Royal Society of Chemistry 2021
View Article Online
                                                                                                 Paper                                                                   Faraday Discussions
                                                                                                 13 M. Gen, R. Zhang, D. D. Huang, Y. Li and C. K. Chan, Environ. Sci. Technol.,
                                                                                                    2019, 53, 8757–8766.
                                                                                                 14 J. Wu, N. Bei, B. Hu, S. Liu, M. Zhou, Q. Wang, X. Li, L. Liu, T. Feng, Z. Liu,
                                                                                                    Y. Wang, J. Cao, X. Tie, J. Wang, L. T. Molina and G. Li, Atmos. Chem. Phys.,
                                                                                                    2019, 19, 8721–8739.
           This article is licensed under a Creative Commons Attribution 3.0 Unported Licence.

                                                                                                 15 J. Xue, X. Yu, Z. Yuan, S. M. Griffith, A. K. H. Lau, J. H. Seinfeld and J. Z. Yu,
                                                                                                    Nat. Geosci., 2019, 12, 977–982.
Open Access Article. Published on 05 oktyabr 2020. Downloaded on 26.09.2021 22:52:44.

                                                                                                 16 W. Tao, H. Su, G. Zheng, J. Wang, C. Wei, L. Liu, N. Ma, M. Li, Q. Zhang,
                                                                                                    U. Pöschl and Y. Cheng, Atmos. Chem. Phys. Discuss., 2020, 2020, 1–31.
                                                                                                 17 Y. Kuang, Y. He, W. Xu, P. Zhao, Y. Cheng, G. Zhao, J. Tao, N. Ma, H. Su,
                                                                                                    Y. Zhang, J. Sun, P. Cheng, W. Yang, S. Zhang, C. Wu, Y. Sun and C. Zhao,
                                                                                                    Atmos. Chem. Phys., 2020, 20, 865–880.
                                                                                                 18 W. Xu, Y. Kuang, C. Zhao, J. Tao, G. Zhao, Y. Bian, W. Yang, Y. Yu, C. Shen,
                                                                                                    L. Liang, G. Zhang, W. Lin and X. Xu, Atmos. Chem. Phys., 2019, 19, 10557–
                                                                                                    10570.
                                                                                                 19 Y. Sun, Y. He, Y. Kuang, W. Xu, S. Song, N. Ma, J. Tao, P. Cheng, C. Wu, H. Su,
                                                                                                    Y. Cheng, C. Xie, C. Chen, L. Lei, Y. Qiu, P. Fu, P. Croteau and D. R. Worsnop,
                                                                                                    Geophys. Res. Lett., 2020, 47, e2019GL086288.
                                                                                                 20 A. R. Ravishankara, Science, 1997, 276, 1058–1065.
                                                                                                 21 H. Su, Y. Cheng and U. Pöschl, Acc. Chem. Res., 53, 2034–2043.
                                                                                                 22 Y. Kuang, Y. He, W. Xu, B. Yuan, G. Zhang, Z. Ma, C. Wu, C. Wang, S. Wang,
                                                                                                    S. Zhang, J. Tao, N. Ma, H. Su, Y. Cheng, M. Shao and Y. Sun, Environ. Sci.
                                                                                                    Technol., 2020, 54(7), 3849–3860.
                                                                                                 23 Y. Sun, G. Zhuang, A. Tang, Y. Wang and Z. An, Environ. Sci. Technol., 2006, 40,
                                                                                                    3148–3155.
                                                                                                 24 C. Fountoukis and A. Nenes, Atmos. Chem. Phys., 2007, 7, 4639–4659.
                                                                                                 25 G. Zheng, H. Su, S. Wang, M. O. Andreae, U. Pöschl and Y. Cheng, Science,
                                                                                                    2020, 369, 1374–1377.
                                                                                                 26 Y. Zhang, J. Tao, N. Ma, Y. Kuang, Z. Wang, P. Cheng, W. Xu, W. Yang,
                                                                                                    S. Zhang, C. Xiong, W. Dong, L. Xie, Y. Sun, P. Fu, G. Zhou, Y. Cheng and
                                                                                                    H. Su, Sci. Total Environ., 2020, 719, 137473.
                                                                                                 27 Y. Wang, Z. Li, Y. Zhang, W. Du, F. Zhang, H. Tan, H. Xu, T. Fan, X. Jin, X. Fan,
                                                                                                    Z. Dong, Q. Wang and Y. Sun, Atmos. Chem. Phys., 2018, 18, 11739–11752.
                                                                                                 28 S. M. Kreidenweis, K. Koehler, P. J. DeMott, A. J. Prenni, C. Carrico and
                                                                                                    B. Ervens, Atmos. Chem. Phys., 2005, 5, 1357–1370.
                                                                                                 29 H. Su, D. Rose, Y. F. Cheng, S. S. Gunthe, A. Massling, M. Stock,
                                                                                                    A. Wiedensohler, M. O. Andreae and U. Pöschl, Atmos. Chem. Phys., 2010, 10,
                                                                                                    7489–7503.
                                                                                                 30 Y. F. Cheng, A. Wiedensohler, H. Eichler, J. Heintzenberg, M. Tesche,
                                                                                                    A. Ansmann, M. Wendisch, H. Su, D. Althausen, H. Herrmann, T. Gnauk,
                                                                                                    E. Brüggemann, M. Hu and Y. H. Zhang, Atmos. Environ., 2008, 42, 6373–6397.
                                                                                                 31 A. J. Ding, X. Huang, W. Nie, J. N. Sun, V.-M. Kerminen, T. Petäjä, H. Su,
                                                                                                    Y. F. Cheng, X.-Q. Yang, M. H. Wang, X. G. Chi, J. P. Wang, A. Virkkula,
                                                                                                    W. D. Guo, J. Yuan, S. Y. Wang, R. J. Zhang, Y. F. Wu, Y. Song, T. Zhu,
                                                                                                    S. Zilitinkevich, M. Kulmala and C. B. Fu, Geophys. Res. Lett., 2016, 43, 2873–
                                                                                                    2879.
                                                                                                 32 X. Tie, R.-J. Huang, J. Cao, Q. Zhang, Y. Cheng, H. Su, D. Chang, U. Pöschl,
                                                                                                    T. Hoffmann, U. Dusek, G. Li, D. R. Worsnop and C. D. O’Dowd, Sci. Rep.,
                                                                                                    2017, 7, 15760.

                                                                                                 This journal is © The Royal Society of Chemistry 2021   Faraday Discuss., 2021, 226, 207–222 | 221
View Article Online
                                                                                                 Faraday Discussions                                                                       Paper
                                                                                                 33 Y. F. Cheng, M. Berghof, R. M. Garland, A. Wiedensohler, B. Wehner,
                                                                                                    T. Müller, H. Su, Y. H. Zhang, P. Achtert, A. Nowak, U. Pöschl, T. Zhu,
                                                                                                    M. Hu and L. M. Zeng, J. Geophys. Res.: Atmos., 2009, 114, D00G10.
                                                                                                 34 Y. F. Cheng, H. Eichler, A. Wiedensohler, J. Heintzenberg, Y. H. Zhang, M. Hu,
                                                                                                    H. Herrmann, L. M. Zeng, S. Liu, T. Gnauk, E. Brüggemann and L. Y. He, J.
           This article is licensed under a Creative Commons Attribution 3.0 Unported Licence.

                                                                                                    Geophys. Res.: Atmos., 2006, 111, D20204.
                                                                                                 35 S. Lim, M. Lee, S.-W. Kim and P. Laj, Sci. Rep., 2018, 8, 5172.
Open Access Article. Published on 05 oktyabr 2020. Downloaded on 26.09.2021 22:52:44.

                                                                                                 222 | Faraday Discuss., 2021, 226, 207–222   This journal is © The Royal Society of Chemistry 2021
You can also read