UNICREDIT GROUP DISCLOSURE (PILLAR III) - as at 31 March 2019
←
→
Page content transcription
If your browser does not render page correctly, please read the page content below
UNICREDIT GROUP DISCLOSURE
         (PILLAR III)
     as at 31 March 2019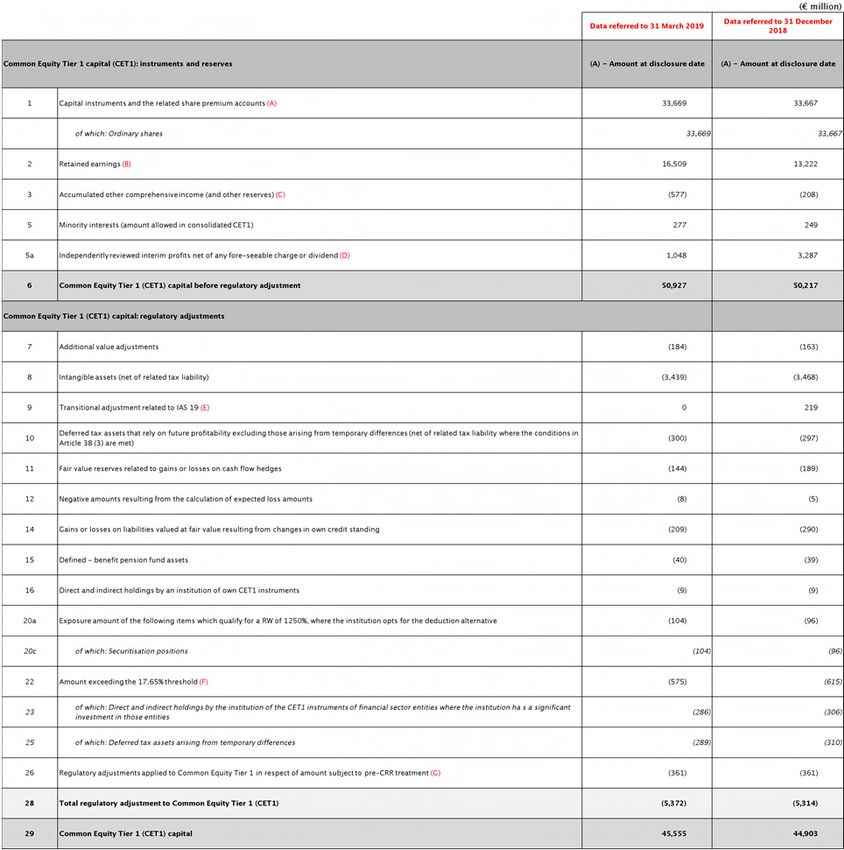
DISCLOURE BY INSTITUTIONS
                            2
AS AT DECEMBER 31, 2014
Contents

Cross reference with the regulatory Disclosure requirements.................................................... 5
Own Funds ............................................................................................................................. 7
Capital requirements .............................................................................................................. 17
Credit Risk ........................................................................................................................... 25
           Credit Risk: RWAs flow statements – IRB method...................................................... 25
           Counterparty Risk exposure: RWAs flow statements – IMM method........................... 26
Market Risks .......................................................................................................................... 29
           RWAs flow statements under the IMA ........................................................................ 29
Liquidity Risk.................. ………………………………………………………………………………31
           Liquidity Coverage Ratio ............................................................................................ 31
           Funding Strategies..................................................................................................... 32
Leverage         .................... ………………………………………………………………………………35
Declaration by the Manager charged with preparing the financial reports …............................ 39
Declaration pursuant to the EBA Guidelines 2016/11 on disclosure requirements
under Part Eight of Regulation (EU) No 575/2013….... ........................................................... 39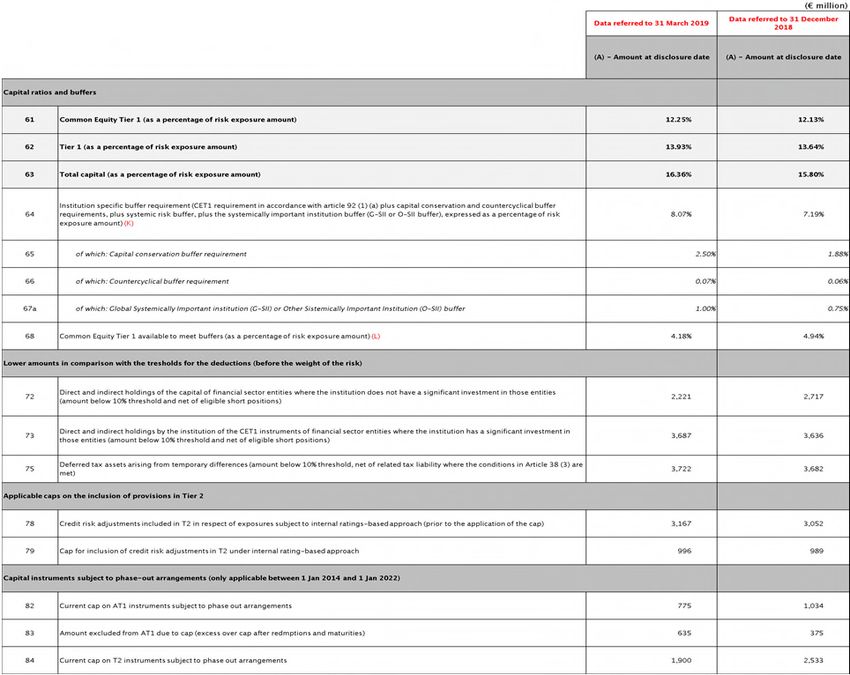
Notes:

All amounts, unless otherwise specified, are expressed in millions of euros.

Data refer to the prudential scope of consolidation.

Any discrepancies between data disclosed in this document are due to the effect of rounding.

With regard to both the standardized approach and the IRB methodology, non-weighted amounts concerning “guarantees given and
commitments to disburse funds” were considered based on the credit equivalent, unless otherwise specified.

Please note that the disclosures to be provided by the systemically important banks were published on the UniCredit group’s website according
to the deadline defined in the relevant regulations (https://www.unicreditgroup.eu/en/investors/financial-reports.html).

The Disclosure by UniCredit Group is prepared in accordance with a formal policy (Internal Regulation) adopted in the application of the CRR
Article 431 (3) that set out the internal controls and procedures.
The key elements of this policy are:
       •     Identification of roles and responsibilities of the corporate bodies, departments and Legal Entities involved in the process of
             producing the disclosure;
       •     Identification of the information to be published (in accordance with EBA GL/2014/14 and EBA GL 2016/11 and CRR Article 432 and
             433);
       •     Instructions for Legal Entities contributions and related controls;
       •     Consolidation of the disclosure contributions and related controls;
       •     Approval by the Board of Directors;
       •     Publication on the UniCredit Group website.

DISCLOURE BY INSTITUTIONS
                                                                                                                                            4
AS AT DECEMBER 31, 2014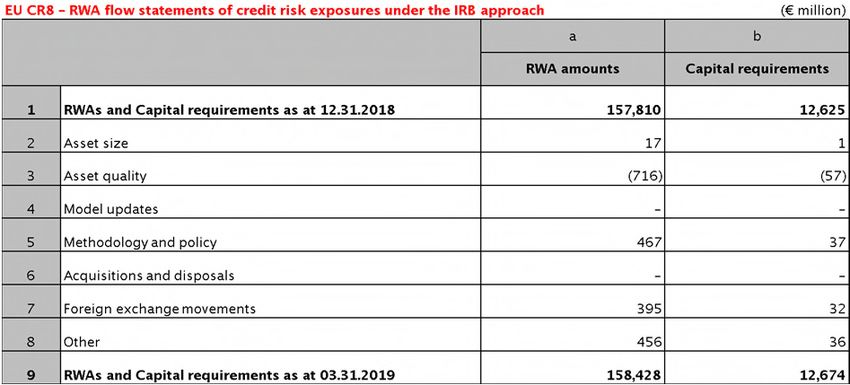
Cross reference with the regulatory
Disclosure requirements
In coherence with the EBA Guidelines “GL/2014/14” 1 and updates reported in the EBA Guidelines “GL/2016/11” 2, the table
below shows the cross reference to the information quarterly required.

Regulatory            Content                   Reference to the chapter in the present            Reference to external documents
requirement CRR                                 UniCredit Group Disclosure

Article 437           Own Funds                 Own Funds                                          UniCredit Group website:
                                                                                                   Full terms and conditions of all capital
                                                                                                   instruments (Article 437, paragraph 1, letter
                                                                                                   c) link
                                                                                                   https://www.unicreditgroup.eu/en/investors/f
                                                                                                   unding-and-ratings/programs/bank-
                                                                                                   capital.html

                                                                                                   Annex 1 Capital instruments main features
                                                                                                   templates
                                                                                                   (in excel format) to link
                                                                                                   https://www.unicreditgroup.eu/en/investors/t
                                                                                                   hird-pillar-basel-two-and-three.html)

Article 438           Capital requirements      Capital requirements

Article 440           Capital buffers           Capital requirements

Article 451           Leverage                  Leverage

“Guidelines on disclosure requirements under Part Eight of Regulation (EU) No 575/2013” (GL/2016/11)

EU OV1                Overview of RWAs          Capital requirements

EU CR8                RWAs flow                 Credit Risk: RWAs flow statements – IRB
                      statements of credit      method
                      risk exposures under
                      the IRB approach

EU CCR7               RWAs flow                 Counterparty Risk exposure: RWAs flow
                      statements of CCR         statements – IMM method
                      exposures under the
                      IMM

EU MR2-B              RWAs flow              Market Risk: RWAs flow statements under the
                      statements of Market   IMA
                      Risk exposures
                      under the internal
                      model approach
Enhancing the risk disclosures of bank Recommendation (EDTF)

                                                Leverage - “Leverage Ratio common
                      New key regulatory
N. 4                                            disclosure” table
                      ratio
                                                Liquidity Risk – “Liquidity Coverage Ratio”
                      Funding - Funding
N. 21                                           Liquidity Risk – “Funding Strategies”
                      strategy

1
  “Guidelines on materiality, proprietary and confidentiality and on disclosure frequency under Articles 432(1), 432(2) and 433 of Regulation
(EU) No 575/2013”.
2
  “Guidelines on disclosure requirements under Part Eight of Regulation (EU) No 575/2013”.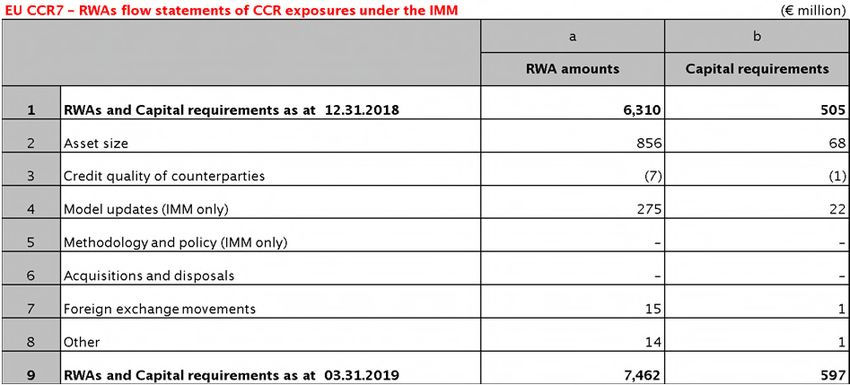
DISCLOURE BY INSTITUTIONS
                            6
AS AT DECEMBER 31, 2014
>> UNICREDIT GROUP DISCLOSURE
Own Funds
Own funds
Starting from 1 January 2014, the calculation of capital requirements keeps into account the regulatory framework known as
“Basel 3”, adopted as a result of the EU Regulation No.575/2013 on prudential requirements for credit institutions and investment
firms (Capital Requirements Regulation - “CRR”) and in the EU Directive 2013/36 on access to the activity of credit institutions and
the prudential supervision of credit institutions and investment firms (Capital Requirements Directive IV - “CRDIV”), also according
to their adoption by Italian Laws.
Such regulation foresees the following breakdown of Own funds:
• Tier 1 Capital (T1), made by:
o Common Equity Tier 1 Capital (CET1) and
o Additional Tier 1 Capital (AT1);
• Tier 2 Capital (T2);
the sum of T1 and T2 generates the Total Own funds (Total Capital).
Capital requirements 3 and buffers for UniCredit Group
The capital requirements applicable as of 31 March 2019 in coherence with CRR article 92 are the following (Pillar 1):
• CET1: 4.50%
• T1: 6.00%
• Total Capital: 8.00%
In addition to such requirements, the Group shall also meet, through CET1 capital, the following additional requirements:
• 2.00%, as Pillar 2 Requirements for 2019 in coherence with SREP results
• 2.50%, as Capital Conservation buffer4 (CCB) according to CRDIV article129
• 1.00%, as Global Systemically Important Institutions (“G-SII”) buffer5
• 0.07%, as Countercyclical Capital buffer6 (CCyB) according to the CRDIV Article 160 (paragraphs from 1 to 4), to be
calculated on a quarterly basis.
Therefore, as at 31 March 2019, the Group shall meet the following overall capital requirements:
• CET1: 10.07%
• T1: 11.57%
• Total Capital: 13.57%
Please find below a scheme of the UniCredit Group capital requirements and buffers which also provides evidences of TSCR
(Total SREP Capital Requirement) and OCR (Overall Capital Requirement) related to the outcome of the SREP process held in
2018 and applicable for 2019:
2019 Capital requirements and buffers for UniCredit Group
REQUIREMENT CET1 T1 TOTAL CAPITAL
A) Pillar 1 Requirements 4.50% 6.00% 8.00%
B) Pillar 2 Requirements 2.00% 2.00% 2.00%
C) TSCR (A+B) 6.50% 8.00% 10.00%
D) Combined capital buffer requirement, of which: 3.57% 3.57% 3.57%
1. Capital Conservation buffer (CCB) 2.50% 2.50% 2.50%
2. Global Systemically Important Institution buffer (G-SII) 1.00% 1.00% 1.00%
3. Institution-specific Countercyclical Capital buffer (CCyB) 0.07% 0.07% 0.07%
E) OCR (C+D) 10.07% 11.57% 13.57%
3
CET1 Systemic risk buffer (aimed at preventing and mitigating long-term, non-cyclical, systemic or macro-prudential risks that are not provided for
by the CRR) is not applicable as of 31 March 2019.
4
On October 2016, Bank of Italy published the update of the Circular No. 285 which provides for a different application of the transitional rules
relating to the capital conservation buffer: such transitional rules ended in 2018 and from 1 January 2019 the capital conservation buffer is at 2.50%.
5
From 1st of January 2019, ended the transitional rules, such requirement is equal to 1.00%. Please note that UniCredit Group was identified by the
Bank of Italy as an O-SII authorized to operate in Italy, and it has to maintain a CET1 capital buffer; such level is equal to 0.50% in 2019 and will be
increased starting by 0.25% on a yearly basis reaching the target of 1.00% from 1 January 2021. Nevertheless, it is worth mentioning that according
to the CRD IV article 131.14, the higher of the G-SII and the O-SII buffer will apply: hence, UniCredit is subject to the application of 1.00% G-SII
buffer for 2019.
6
Amount rounded to two decimal numbers. With reference to 31 March 2019: (I) countercyclical capital rates have generally been set at 0%, except
for the following countries: United Kingdom (1.00%); Czech Republic (1.25%); Hong Kong (2.50%); Iceland (1.25%); Norway (2.00%); Sweden
(2.00%); Slovakia (1.25%); Lithuania (0.50%); Denmark (0.50%); (II) with reference to the exposures towards Italian counterparties, Bank of Italy has
set the rate equal to 0%.
7The following table shows UniCredit Group transitional Capital ratios 7 as of 31 March 2019 compared with previous periods:
1Q19
UniCredit Group 4Q18 3Q18 2Q18 1Q18
Capital ratios8 Delta Delta
Ratios
Q/Q Y/Y
CET1 Capital ratio 12.25% 0.12% -0.87% 12.13% 12.17% 12,57% 13,13%
Tier 1 Capital ratio 13.93% 0.29% -0.79% 13.64% 13.72% 14,12% 14,71%
Total Capital ratio 16.36% 0.56% -0.77% 15.80% 15.97% 16,42% 17,13%
Focus on transitional Capital ratios7 of UniCredit S.p.A.
The following table shows the Capital Ratios of UniCredit S.p.A. as of 31 March 2019 compared with previous periods.
1Q19
UniCredit S.p.A.
4Q18 3Q18 2Q18
Capital ratios8 Delta
Ratios
Q/Q
CET1 Capital ratio 21.86% 0.21% 21.65% 21.43% 22.50%
Tier 1 Capital ratio 24.75% 0.59% 24.16% 23.94% 25.06%
Total Capital ratio 28.63% 1.05% 27.58% 27.46% 28.72%
Consolidated Profit eligible
The profit as of 31 March 2019 equal to €1,387 million is recognized in the Own Funds for €1,048 million, resulting after the
destination, approved by the Board of Directors, to dividends for €339 million. Such amount corresponds to 30% of the Group Net
Profit of the period (€1,129 million), rectified excluding the positive extraordinary impact deriving from real estate disposals for
€258 million. The net profit as of 31 March 2019 is included in CET1 capital following the authorization by the competent Authority
according to CRR Article 26(2).
Deductions connected to investments in financial sector entities and deferred tax assets that rely on future profitability
and arise from temporary differences
With reference to 31 March 2019, UniCredit exceeds the thresholds related to significant investments (SI) in CET1 instruments
issued by financial sector entities and deferred tax assets that rely on future profitability and arise from temporary differences.
In this regard, the deductions applied to the own funds are reflected in the CRR article “Threshold exemptions from deduction from
Common Equity Tier 1 items”. In particular, the deferred tax assets that rely on future profitability and arise from temporary
differences summed up to the direct, indirect and synthetic holdings detained by UniCredit in financial sector entities in which
UniCredit has a significant investment (SI) exceed the threshold of 17.65% of the residual amount of Common Equity Tier 1 items
after applying the adjustments and deductions in CRR Articles 32 to 36 in full.
The amounts of the mentioned deductions are described in detail within the table denominated “Transitional Own funds disclosure
template", included in the section dedicated to the Own Funds.
IFRS9
Starting from 1 January 2018, the IFRS9 accounting standard was adopted, envisaging a new framework for provisioning
computation based on expected loss rather than on incurred loss. Please refer to “Basis of preparation” section of the Press
Release issued on 10 May 2018 for all details on this topic.
UniCredit Group has decided not to apply the transitional arrangements for IFRS9 specified in Article 473a of the CRR. As a
consequence, UniCredit Own Funds, Risk Weighted Assets, Capital Ratios and Leverage Ratios already reflect the full impact of
IFRS9 application.
Atlante Fund and Italian Recovery Fund (ex Atlante Fund II)
As at 31 March 2019, the investment held by UniCredit in the quotes of Atlante Fund and Italian Recovery Fund (ex Atlante Fund
II), for approximately €353 million, is primarily referred to investments in securitization notes related to non-performing loans: the
regulatory treatment of the Fund’s quotes recognized in the UniCredit balance sheet foresees the application of the CRR article
128 (Items associated with particular high risk).
With reference to the residual commitments, for €12 million, the regulatory treatment foresees the application of a Credit
Conversion Factor equal to 100% (“full risk” according to the Annex I of the CRR), for the calculation of the related Risk Weighted
Assets.
7
Starting from 1 January 2019, CET1 Capital is fully loaded, being concluded transitional period related to such capital component.
8
As of 31 March 2019 the transitional adjustments are still applicable with reference to the 30% of the phase out limit for the Additional Tier 1 and
Tier 2 capital instruments subject to Granfathering, in coherence with CRR article 486 (40% for 2018).
UNICREDIT GROUP DISCLOSURE
8
AS AT 31 MARCH 2019>> UNICREDIT GROUP DISCLOSURE
Own Funds
Financial conglomerate
As of 31 March 2019 reporting date, the UniCredit Group is allowed to not be subject to the supplementary supervision, although it
is recognized as a financial conglomerate by the Joint Committee according to the 21 December 2018 communication (ref. JC
2018 68).
1. Common Equity Tier 1 Capital – CET1 Capital
Common Equity Tier 1 Capital mainly includes the following elements:
• Main Common Equity Tier 1 Capital items, recognized as Common Equity Tier 1 only where they are available to the
institution for unrestricted and immediate use to cover risks or losses as soon as these occur: (I) capital instruments,
provided the conditions laid down in CRR Article 28 or, where applicable, Article 29 are met (e.g. ordinary shares); (II)
share premium accounts related to the instruments referred to in point (I); (III) retained earnings; (IV) accumulated other
comprehensive income; (V) other reserves; Common Equity Tier 1 Capital items also include minority interests for the
computable amount recognized by the CRR.
• Prudential filters of Common Equity Tier 1 Capital: (I) filter related to increase in its equity under the applicable
accounting framework that results from securitized assets; (II) filter related to the fair value reserves related to gains or
losses on cash flow hedges of financial instruments that are not valued at fair value; (III) filter related to gains or losses
on liabilities of the institution that are valued at fair value that result from changes in the own credit standing of the
institution; (IV) filter related to all fair value gains and losses arising from the institution's own credit risk related to
derivative liabilities; (V) filter related to additional value adjustments (prudent valuation).
• Deductions from Common Equity Tier 1 items: (I) intangible assets; (II) deferred tax assets (DTA) that rely on future
profitability and do not arise from temporary differences; (III) negative amounts resulting from the calculation of expected
loss amounts when compared with credit risk adjustments (shortfall) for those positions evaluated according to IRB
methods; (IV) defined benefit pension fund assets on the balance sheet of the institution; (V) direct, indirect and
synthetic holdings by an institution of own Common Equity Tier 1 instruments, including own Common Equity Tier 1
instruments that an institution is to purchase under an actual or contingent obligation by virtue of an existing contractual
obligation; (VI) exposures deducted from CET1 as an alternative to the application of 1,250% risk weight; (VII) the
applicable amount of direct, indirect and synthetic holdings by the institution of Common Equity Tier 1 instruments of
financial sector entities where the institution does not have a significant investment in those entities (deducted for the
amount exceeding the thresholds foreseen by the regulation); (VIII) deferred tax assets (DTA) that rely on future
profitability and arise from temporary differences, and the applicable amount of direct, indirect and synthetic holdings by
the institution of the Common Equity Tier 1 instruments of financial sector entities where the institution has a significant
investment in those entities (deducted for the amount exceeding the thresholds foreseen by the regulation).
As of 31 March 2019, CET1 Capital includes ordinary shares issued by UniCredit S.p.A, equal to €20,298 million; among the other
elements, such item does not include €609 million reclassified under Additional Tier 1 Capital, related to the ordinary shares
underlying the Usufruct contract (Cashes).
2. Additional Tier 1 Capital – AT1 Capital
The AT1 positive elements are represented by the following items: (I) capital instruments, where the conditions laid down in CRR
article 52 are met; (II) the share premium accounts related to the instruments referred to in point (I); (III) capital instruments for the
amount computable in Own funds according to the transitional provisions foreseen by the CRR (grandfathering). Furthermore, the
Additional Tier 1 Capital includes also the minority interests for the computable amount not already recognized in the Common
Equity Tier 1 Capital.
3. Tier 2 Capital – T2 Capital
The T2 positive elements are represented by the following items: (I) capital instruments and subordinated loans where the
conditions laid down in CRR Article 63 are met; (II) the share premium accounts related to instruments referred to in point (I); (III)
possible surplus of credit risk adjustments with reference to expected losses for positions evaluated according to IRB methods;
(IV) capital instruments and subordinated loans for the amount computable in Own funds according to the transitional provisions
foreseen by the CRR (grandfathering). The Tier 2 Capital includes also the minority interests for the computable amount not
already recognized in the Tier 1 Capital and the T2 instruments issued by the subsidiaries for the computable amount as defined
by the CRR.
As of 31 March 2019, T2 Capital:
• does not include instruments with maturity of 7 years having a contractual amortization plan starting before the 5th year,
issued after 31 December 2011;
• includes - according to CRR Article 484(5) among grandfathered instruments - the amount of the instruments issued
before 31 December 2011 and subject to the grandfathering provisions.
Refer to Annex 1 for the “Capital instruments main features templates” to link https://www.unicreditgroup.eu/en/investors/third-
pillar-basel-two-and-three.html.
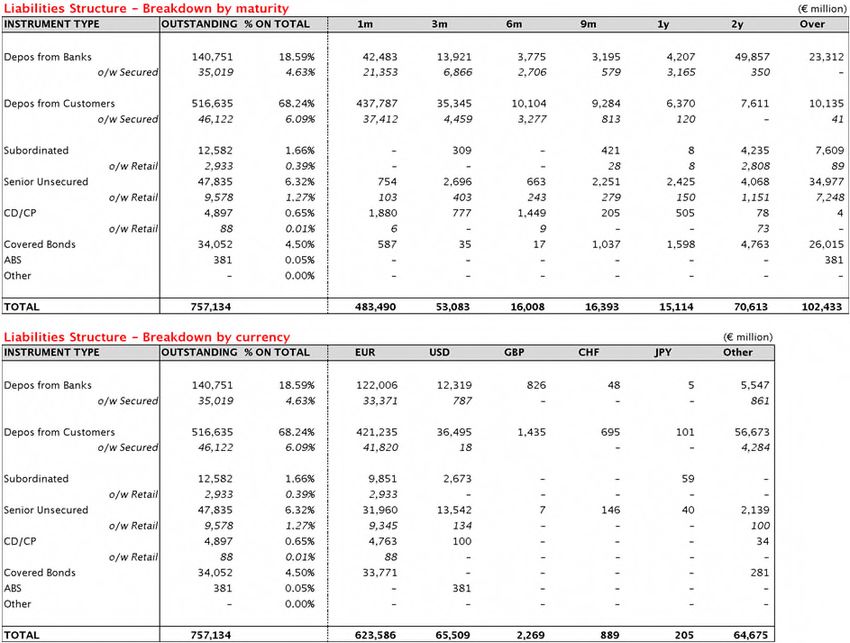
9Own Funds disclosure template (*) - (CRR Article 492, paragraph 3 and 4)
UNICREDIT GROUP DISCLOSURE
10
AS AT 31 MARCH 2019>> UNICREDIT GROUP DISCLOSURE
Own Funds
11(*) Sub-amounts equal to zero or not applicable are not reported.
UNICREDIT GROUP DISCLOSURE
12
AS AT 31 MARCH 2019>> UNICREDIT GROUP DISCLOSURE
Own Funds
Notes to the table “Own Funds disclosure template (CRR Article 492, paragraph 3 and 4)”
Amounts included in the notes below refer to 31 March 2019 if not otherwise specified.
Regarding the transitional adjustments as of 31 March 2019 it is worth mentioning that the transitional adjustment applicable is
30% of the phase-out limit for the Additional Tier 1 and Tier 2 capital instruments subject to Grandfathering in coherence with CRR
article 486 (40% for 2018).
A.
This item does not include €609 million related to the ordinary shares underlying the Usufruct contract (Cashes), reclassified under
item “33. Amount of qualifying items referred to in Article 484 (4) and the related share premium accounts subject to
phase out from AT1”.
B.
The change compared to 31 December 2018 (positive for €3,287 million) mainly reflects the allocation in this item of the profit for
the year 2018 (net of dividends) reclassified in item “5a. Independently reviewed interim profits net of any fore-seeable
charge or dividend”.
C.
The change compared to 31 December 2018 (negative for €369 million) mainly refers to negative change for €488 million related
to the reserve on financial liabilities valued at fair value and actuarial losses partially offset by a positive change related to the
exchanges reserve for €157 million (mainly referred to Russian Ruble).
D.
The profit as of 31 March 2019 equal to €1,387 million is recognized in the Own Funds for €1,048 million, resulting after the
destination, approved by the Board of Directors, to dividends for €339 million. Such amount corresponds to 30% of the Group Net
Profit of the period (€1,129 million), rectified excluding the positive extraordinary impact deriving from real estate disposals for
€258 million. The net profit as of 31 March 2019 is included in CET1 capital following the authorization by the competent Authority
according to CRR Article 26(2).
E.
Starting from 1 January 2019, the revaluation reserves of actuarial net losses – negative for €3,171 million and reported in item “3.
Accumulated other comprehensive income and other reserves” – is not subject to transitional adjustment (positive for €219
million as of 31 December 2018).
F.
With reference to 31 March 2019, the amount reports the excess with respect to the thresholds based to the CRR article 48
“Threshold exemptions from deduction from Common Equity Tier 1 items”. In particular, the deferred tax assets that rely on future
profitability and arise from temporary differences summed up to the direct, indirect and synthetic holdings detained by UniCredit in
financial sector entities in which UniCredit has a significant investments (SI), exceed the threshold of 17.65% of Common Equity
Tier 1 Capital after applying the adjustments and deductions in CRR Articles 32 to 36 in full.
G.
The amount includes the following negative national filters: I) €350 million related to the filter for multiple goodwill redemption
(“affrancamento multiplo dell’avviamento”)9 ; II) €10 million related to the filter for gain on sale of properties mainly used in
operations (“cessione in blocco degli immobili ad uso funzionale”).
H.
The change compared to 31 December 2018 (positive for €992 million) is referred to the issuing of the instrument XS1963834251
with computable amount equal to €992 million.
I.
The amount includes UniCredit SpA instruments subject to grandfathering for €166 million, in addition to the ordinary shares
underlying the Usufruct contract (Cashes) for €609 million (ref. to note A).
J.
The change compared to 31 December 2018 (positive for €888 million) addition to the contractual amortization is mainly referred
to the issuing of the instrument XS1953271225 with computable amount equal to €994 million.
9
The amount of the filter refers to 5/5 of the amount subject to neutralization calculated according to Bank of Italy communication issued on 9 May 2013; the calculation takes
into account the provisions of the Resolution n.55/E of the Italian Revenue Agency (Agenzia delle entrate) issued on 29 May 2015 concerning "Discipline of the tax credit
resulting from the processing of deferred tax assets recorded in the financial statements referred to in Article 2, paragraphs 55 to 58 of Decree-Law 29 December 2010, n.
225" ("Disciplina del credito d'imposta derivante dalla trasformazione di attività per imposte anticipate iscritte in bilancio di cui all'articolo 2, commi da 55 a 58, del decreto
legge 29 dicembre 2010, n.225").
13K.
The amount does not include the Pillar 2 Requirements equal to 2% required for 2019 in coherence with SREP results of 2018.
The change compared to 31 December 2018 reflects the increase of the combined buffer related to the end of transitional period
for the following elements (ref. to section “Own Funds” of this document): I) applicable capital conservation buffer that reached the
target value equal to 2.50% (1.875% in 2018); II) global systemic institutions – GSII buffer, that reached the target value equal to
1.00% (0.75% in 2018).
L.
The amount as of 31 March 2019 is calculated by subtracting from the Common Equity Tier 1 capital ratio at the date (i.e. item 61:
12.25%) the minimum Common Equity Tier 1 capital requirement including the combined capital buffer (i.e. item 64: 8.07%).
Hence, the amount expressed in this item does not include the Pillar 2 Requirements equal to 2% required for 2019 in coherence
with SREP results.
The reduction compared to 31 December 2018 depends on the following items: I) increase in Common Equity Tier 1 Capital for
€653 million; II) increase in risk-weighted assets for €1,559 million; iii) increase in combined capital buffer (ref. to note J).
UNICREDIT GROUP DISCLOSURE
14
AS AT 31 MARCH 2019>> UNICREDIT GROUP DISCLOSURE
Own Funds
15UNICREDIT GROUP DISCLOSURE
16
AS AT 31 MARCH 2019>> UNICREDIT GROUP DISCLOSURE
Capital requirements
Capital requirements
Issuing of new instruments
During the 1Q 2019 UniCredit S.p.A. has placed one more issue of Additional Tier 1 instruments (so-called Non-Cumulative
Temporary Write-Downs) to institutional investors, with a "perpetual" duration (maturity linked to the corporate duration of
UniCredit S.p.A.), in particular:
• On 12 March 2019, with value date 19 March 2019, UniCredit S.p.A. launched a new issuance of Additional Tier 1
notes, denominated in EUR, for a total of €1 billion. The notes pay fixed rate coupons for the first 7 years equal to
7.5% per annum, paid on a semi-annual basis. The notes were allocated to institutional investors, based in the
main financial European venues (UK, Italy and France, etc.).
The coupon payment is fully discretionary. The notes have a 5.125% Common Equity Tier 1 (CET1) trigger, if the
Group or Issuer CET1 at any time falls below the trigger level, the instrument will be temporarily written down to
cure the breach, taking into consideration other instruments with similar write down triggers.
The additional Tier 1 instruments contributed to strengthen the Tier 1 Ratio of UniCredit S.p.A. and to reach the
minimum requirement of 1.50% of AT1. This last transaction has completed the plan of additional Tier 1 issuances
for 2017-19.
On February 2019, UniCredit S.p.A. launched a new issuance of Tier 2 notes:
• the notes were denominated in EUR, for a total of €1 billion. The notes have a legal maturity of 10 years and pay a
fixed rate coupon of 4.875% per annum, paid on an annual basis. The notes have a one-time Issuer's call option
exercisable after 5 years subject to regulatory approval; if not called, the coupon will reset at the prevailing 5 years
EUR mid-swap rate plus the initial spread. The notes were distributed to different institutional investors’ categories,
mainly funds (75%) and banks and insurance companies. The demand has mainly come from France (40%), Italy
(28%) and UK (11%). The notes are listed on the Luxembourg Stock Exchange.
17Credit and counterparty risk (€ million)
A M OU N T S A S A T 0 3 .3 1.2 0 19 A M OU N T S A S A T 12 .3 1.2 0 18
N ON - WEIGHT ED W EIGHT ED C A PIT A L N ON - W EIGHT ED W EIGHT ED C A PIT A L
C R ED IT A N D C OU N T ER PA R T Y R ISKS A M OUN T S A M OU N T S R EQU IR EM EN T A M OU N T S A M OU N T S R EQU IR EM EN T
A . C R ED IT A N D C OU N T ER PA R T Y R ISK 8 4 6 ,145 3 2 1,4 6 4 2 5,717 8 3 7,752 3 18 ,9 18 2 5,513
A .1 St and ard iz ed A p p ro ach 3 52 ,4 00 152 ,8 9 6 12 ,2 3 2 3 6 1,8 3 3 151,2 9 4 12 ,10 3
Exposures with or secured by central governments or central banks 162,638 25,186 2,015 170,857 22,356 1,788
Exposures with or secured by regional administrations and local authorities 26,507 683 55 26,481 737 59
Exposures with or secured by administrative bodies and non-commercial undertakings 6,997 825 66 6,744 853 68
Exposures with or secured by multilateral development banks 1,735 5 0 1,565 0 0
Exposures with or secured by international organizations 1,695 - - 1,463 - -
Exposures with or secured by supervised institutions 11,908 2,751 220 11,412 2,624 210
Exposures with or secured by corporates 60,844 58,734 4,699 63,990 61,588 4,927
Retail exposures 32,332 23,056 1,844 33,852 24,166 1,933
Exposures secured by real estate property 12,070 4,934 395 11,537 4,525 362
Past due exposures 4,456 5,043 403 4,603 5,197 416
High risk exposures 2,272 3,407 273 2,397 3,595 288
Exposures in the form of guaranteed bank bonds (covered bond) 479 130 10 375 78 6
Exposures in the form of Collective Investment Undertakings (CIU) 9 7 1 17 21 2
Short term exposures with corporates 1,895 1,070 86 2,372 1,605 128
Securitization positions 2,386 572 46 2,598 618 49
Equity exposures 6,588 11,689 935 6,311 11,306 904
Other exposures 17,589 14,804 1,184 15,261 12,026 962
A .2 IR B A p p ro ach - R isK A sset s 4 9 3 ,190 16 6 ,9 6 7 13 ,3 57 4 75,4 8 2 16 6 ,4 8 2 13 ,3 19
Exposures with or secured by central administration and central banks 38,123 1,656 132 25,656 1,617 129
Exposures with or secured by supervised institutions, public and territorial entities and other entities 39,643 9,772 782 38,243 9,469 758
Exposures with or secured by corporate - SM E 60,080 25,049 2,004 60,066 25,078 2,006
Exposures with or secured by corporate - Specialised lending 19,221 8,000 640 18,601 7,969 638
Exposures with or secured by corporate - Other 195,753 82,588 6,607 192,691 83,268 6,661
Retail exposures secured by residential real estate property - SM E 5,867 1,215 97 5,846 1,206 96
Retail exposures secured by residential real estate property - non SM E 86,864 21,587 1,727 85,848 21,565 1,725
Retail exposures - qualifying revolving 2,317 233 19 2,332 236 19
Retail exposures - other SM E 16,045 5,013 401 16,363 5,098 408
Retail exposures - other non SM E 14,285 5,973 478 14,171 5,815 465
Securitization positions 14,992 2,572 206 15,667 2,744 219
Other non credit obligation assets 3,309 265 2,419 194
A .3 IR B A p p ro ach - Eq uit y Exp o sures 555 1,6 0 1 12 8 436 1,14 3 91
PD/LGD approach: risk assets 168 323 26 182 354 28
Internal models approach: risk assets - - - - - -
Simple risk weight approach: risk assets 387 1,278 102 254 789 63
Equity exposures - private equity in sufficiently diversified portfolios (weight 190%) 80 152 12 79 150 12
Equity exposures - exchange-traded (weight 290%) 10 28 2 11 32 3
Equity exposures - other (weight 370%) 297 1,098 88 164 607 49
Exposures subject to transitional arrangements in relation to Own Funds requirements - - - - - -
Exposures subject to grandfathering provisions in relation to Own Funds requirements - - - - - -
A .4 Exp o sures wit h o r cent ral co unt erp art ies as p re- f und ed co nt rib ut io ns t o t he d ef ault f und 82 7 81 6
With reference to point A.1 Standardized approach, the amounts shown in the column “Non weighted amounts” include the off
balance exposures post credit conversion factor.
UNICREDIT GROUP DISCLOSURE
18
AS AT 31 MARCH 2019>> UNICREDIT GROUP DISCLOSURE
Capital requirements
Cre dit and counte rparty risk - brea kdown RWA a nd Capital require ments (€ million)
AMOUNTS AS AT 03.31.2019 AMOUNTS AS AT 12.31.2018
CREDIT RISK COUNTERPARTY RISK CREDIT RISK COUNTERPARTY RISK
RWA CAPITAL RWA CAPITAL RWA CAPITAL RWA CAPITAL
CREDIT AND COUNTERPARTY RISK (NET OF IC) REQUIREMENT (NET OF IC) REQUIREMENT ( NET OF IC) REQUIREMENT (NET OF IC) REQUIREMENT
Standard m e thod 150,537 12,043 2,359 189 148,635 11,891 2,658 213
Exposures w ith or secured by central governments or central banks 25,163 2,013 23 2 22,308 1,785 48 4
Exposures w ith or secured by regional administrations and local authorities 657 53 26 2 712 57 25 2
Exposures w ith or secured by administr ative bodies and non- commer cial undertakings 802 64 23 2 826 66 26 2
Exposures w ith or secured by multilateral development banks 5 0 - - 0 0 - -
Exposures w ith or secured by international organizations - - - - - - - -
Exposures w ith or secured by supervised institutions 2,315 185 436 35 2,229 178 395 32
Exposures w ith or secured by Corporates 57,306 4,584 1,428 114 60,163 4,813 1,424 114
Retail exposures 23,051 1,844 5 0 24,001 1,920 165 13
Exposures secured by r eal estate property 4,934 395 - - 4,525 362 - -
Past due exposures 5,036 403 7 1 5,186 415 11 1
High risk exposur es 3,407 273 - - 3,595 288 - -
Exposures in the for m of guaranteed bank bonds (covered bond) 130 10 - - 78 6 - -
Securitization positions 572 46 618 49
Short term exposures with corporates 659 53 411 33 1,040 83 565 45
Exposure in the form of Collective Investment Undertakings (CIU) 7 1 - - 21 2 - -
Equity exposures 11,689 935 - - 11,306 904 - -
Other exposur es 14,804 1,184 - - 12,026 962 - -
IRB 161,001 12,880 7,567 605 160,553 12,844 7,072 566
Foundat ion 10,338 827 254 20 10,353 828 246 20
Exposures w ith or secured by central governments and central banks 119 10 - - 137 11 - -
Exposures w ith or secured by supervised institutions, public and territorial entities and other entities 436 35 23 2 417 33 24 2
Exposures w ith or secured by corporate - SME 2,550 204 12 1 2,620 210 11 1
Exposures w ith or secured by corporate - Specialised lending 921 74 17 1 913 73 15 1
Exposures w ith or secured by corporate - Other 6,311 505 202 16 6,264 501 196 16
Advance d 146,490 11,719 7,313 585 146,314 11,705 6,826 546
Exposures w ith or secured by central governments and central banks 1,434 115 103 8 1,425 114 54 4
Exposures w ith or secured by supervised institutions, public and territorial entities and other entities 6,264 501 3,049 244 5,988 479 3,039 243
Exposures w ith or secured by corporate - SME 21,906 1,752 581 46 21,985 1,759 462 37
Exposures w ith or secured by corporate - Specialised lending 6,437 515 625 50 6,540 523 501 40
Exposures w ith or secured by corporate - Other 73,154 5,852 2,921 234 74,063 5,925 2,744 220
Retail exposures secured by r esidential r eal estate property - SME 1,215 97 - - 1,206 96 - -
Retail exposures secured by r esidential r eal estate property - non SME 21,587 1,727 - - 21,565 1,725 - -
Retail exposures - qualif ying revolving 233 19 - - 236 19 - -
Retail exposures - other SME 5,006 400 7 1 5,092 407 5 0
Retail exposures - other non SME 5,946 476 27 2 5,796 464 19 2
Other non credit obligation assets 3,309 265 2,419 194
Othe r IRB e xpos ure s 4,173 334 - - 3,887 311 - -
PD/LGD approach: risk assets 323 26 354 28
Internal models approach: risk assets - - - -
Simple risk w eight approach: r isk assets 1,278 102 789 63
Equity exposur es - private equity in sufficiently diversified portfolios (w eight 190%)
152 12 150 12
Equity exposur es - exchange-traded (w eight 290%) 28 2 32 3
Equity exposur es - other (w eight 370%) 1,098 88 607 49
Securitization positions 2,572 206 2,744 219
Exposures w ith or ce ntral counte rpartie s as pre- funde d contributions t o the default f und 82 7 81 6
In the “Capital Adequacy” scheme, the weighted amounts regarding securitization exposures are included in the item “A.1.3
Securitization”; while capital requirement regarding securitization exposures is included in the item “B.1 Credit and
counterparty Risk”.
19Capital Adequacy (€ million)
WEIGHT ED
UNWEIGHT ED ASSETS
ASSET S/REQUIREM ENTS
IT EMS/VAL UES 03.31.2019 12.31.2018 03.31.2019 12.31.2018
A. RISK ASSET S
A.1 Credit and counterparty risk 846,145 837,752 321,546 318,999
1. Standardized approach1 350,014 359,236 152,406 150,757
2. IRB approaches 478,753 460,251 165,996 164,881
2.1 Foundation 17,100 16,975 10,592 10,599
2.2 Advanced 461,653 443,276 155,404 154,282
3. Securitizations 17,378 18,265 3,144 3,361
B. CAPITAL REQ UIREM ENT S
B.1 Credit and counterparty risk 25,724 25,520
B.2 Credit valu ation adjustm ent risk 159 158
B.3 Settlem ent risk 1 2
B.4 Market risk 756 806
1. Standard approach 151 123
2. Internal models 605 682
3. Concentr ation Ris k - -
B.5 Operational risk 2,360 2,360
1. Basic indicator approach 219 228
2. Traditional standardized appr oach 284 276
3. Advanced measur ement approach 1,856 1,856
B.6 Other calculation elements 2 739 769
B.7 Total cap ital requirem ents 29,739 29,614
C. RISK ASSET S AND CAPITAL RATIO
C.1 Risk Weighted Assets 371,739 370,180
C.2 Com m on Equity Tier 1 Cap ital / Risk weighted assets (CET1 capital ratio) 12.25% 12.13%
C.3 Tier 1 Cap ital / Risk weighted assets (Tier 1 capital ratio) 13.93% 13.64%
C.4 Total Ow n Funds / Risk weighted assets (Total capital ratio) 16.36% 15.80%
Notes:
1
The weighted amount includes the “Exposures with or central counterparties as pre-funded contributions to the default fund”.
2
Such item includes temporary measures on credit risk internal models (linked to limitations raised by the Supervisor), prudential measure on
operational risk internal model (waiting for the final assessment by the Supervisor) and regulatory requirements for securitisation exposures
under Regulation (EU) 2017/2401.
UNICREDIT GROUP DISCLOSURE
20
AS AT 31 MARCH 2019>> UNICREDIT GROUP DISCLOSURE
Capital requirements
Overview of RWAs
The total amount of RWA as of 1st quarter 2019, equal to €371.7 billion, shows an increase with reference to the previous
quarter for approx. €1.6 billion. In particular, Credit RWA increase for approx. €2.2 billion, mainly due to: i) the component
treated under Standardised approach for €1.6 billion and ii) the Equity IRB component treated according to the Simple risk-
weight method for €0.5 billion.
Market RWA decrease for €0.6 billion, basically for lower requirement coming from VaR and SVaR.
Operational RWA remain basically stable.
EU OV1 - Overview of RWAs (€ million)
CAPITAL
RWA
CATEGORIES REQUIREMENT
03.31.2019 12.31.2018 03.31.2019
1 Credit risk (excluding CCR) 291,309 289,071 23,305
Art 438(c)(d) 2 of which standardised approach 132,881 131,261 10,630
Art 438(c)(d) 3 of which the foundation IRB (FIRB) approach 10,338 10,353 827
Art 438(c)(d) 4 of which the advanced IRB (AIRB) approach 146,812 146,668 11,745
of which Equity IRB under the Simple risk-weight or the
Art 438(d) 5 IMA 1,278 789 102
Art 107, Art 438(c)(d) 6 CCR 12,001 11,782 960
Art 438(c)(d) 7 of which mark to market 1,745 1,758 140
Art 438(c)(d) 8 of which Original exposure - - -
9 of which standardised approach - - -
10 of which internal model method (IMM) 7,462 6,310 597
11 of which: Financial collateral simple method (for SFTs) - - -
of which: Financial collateral comprehensive method (for
12 SFTs) 720 1,662 58
13 of which VaR per le operazioni SFT - - -
of which risk exposure amount for contributions to the
Art 438(c)(d) 14 default fund of a CCP 82 81 7
Art 438(c)(d) 15 of which CVA 1,992 1,971 159
Art 438(e) 16 Settlement Risk 9 19 1
Art 449(o)(i) 17 Securitisation exposures in banking book (after the cap) 3,144 3,361 252
18 of which IRB approach 400 439 32
19 of which IRB Supervisory Formula Approach (SFA) 1,447 1,569 116
20 of which Internal assessment approach (IAA) 725 735 58
21 of which standardised approach 572 618 46
Art 438(e) 22 Market risk 9,455 10,069 756
23 of which standardised approach 1,890 1,543 151
24 of which IMA 7,565 8,526 605
Art 438(e) 25 Large exposures - - -
Art 438(f) 26 Operational risk 29,494 29,506 2,360
27 of which Basic Indicator Approach 2,743 2,853 219
28 of which Standardised Approach 3,546 3,448 284
29 of which Advanced Measurement Approach 23,205 23,205 1,856
Amounts below the thresholds for deduction (subject to
Art 437(2), 48,60 30 250% risk weight) 17,084 16,756 1,367
Art 500 31 Floor adjustment - - -
32 Other calculation elements 9,244 9,616 739
33 Total 371,739 370,180 29,739
The amounts of the rows 1,6,17 and 30 (except to row 15 “of which: CVA”), equals to €321,546 million and matches
with the amount of the line A.1 of the “Capital Adequacy” table.
21Countercyclical capital buffer
The table below shows the “Countercyclical capital buffer” disclosure prepared on the basis of the rates applicable as at 31
March 2019.
Amount of institution-specific countercyclical capital buffer (€ million)
ROW DESCRIPTION COLUMN - 010
10 Total risk exposure amount
371,739
20 Institution specific countercyclical buffer rate 0.068%
30 Institution specific countercyclical buffer requirement
254
Market Risk capital requirement (€ million)
Description
03.31.2019 12.31.2018
Position risk: 690 755
- Assets included in regulatory trading portfolio 690 755
- Assets not included in regulatory trading portfolio - -
Settlement risk for DVP transactions 1 2
Exchange rate risk 66 51
Commodities risk position - -
CVA (Credit Value Adjustment) risk 159 158
Market Risk capital requirement 916 965
The amount of the Market Risk capital requirement, equal to €916 million, is consistent with:
• referring to “Capital Adequacy” table: the sum of points B.2, B.3 and B.4;
• referring to “Overview of RWAs table: the sum of the lines 15, 16 and 22 (“Capital requirements” column).
UNICREDIT GROUP DISCLOSURE
22
AS AT 31 MARCH 2019>> UNICREDIT GROUP DISCLOSURE
Capital requirements
23UNICREDIT GROUP DISCLOSURE
24
AS AT 31 MARCH 2019>> UNICREDIT GROUP DISCLOSURE
Credit Risk
Credit Risk
RWAs flow statements – IRB method
The template presents a quarterly flow statement explaining variations in the credit risk exposures, for which the risk-weighted
amount is determined under the IRB approach (AIRB and/or FIRB).
In the first quarter of 2019, credit risk exposures under IRB approach recorded a €0.6 billion increase vs. December 2018,
driven by regulatory changes (€+0.5 billion impacting mainly Austria and CEE), along with €+0.4 billion increase mainly
explained by Euro depreciation vis à vis US dollar and Russian ruble. Moreover, further €+0.5 billion increase is visible in
“Other” (mostly for fine-tunings on risk parameters calculation). Finally, asset quality shows a decrease of €-0.7 billion
(explained mainly by Italy and Austria).
The amounts as of 31 March 2019 of the row 9 (total RWAs equal to €158,428 million and total capital requirements equal to
€12,674 million) are consistent with the sum of rows 3,4 and 5 of “Overview of RWAs” table.
25Counterparty Risk exposure
RWAs flow statements – IMM method
The template presents a quarterly flow statement explaining changes in the CCR RWAs determined under the IMM10
approach.
In the first quarter of 2019, CCR Exposures under IMM Approach increased by €1.2 billion compared with the last quarter of
2018, mostly in Italy. The increase is explained primarily by the item “Asset size” which registered an increase of €0.9 billion,
partly due to the inclusion under IMM perimeter of repos exposure previously evaluated with standard approach. Moreover,
an increase of €0.3 billion is explained by a methodological change (italian perimeter).
The amounts as of 31 March 2019 of the row 9 (total RWAs equal to €7,462 million and total capital requirements equal to
€597 million) are consistent with the row 10 of “Overview of RWAs” table.
10
IMM: Internal Model Method.
UNICREDIT GROUP DISCLOSURE
26
AS AT 31 MARCH 2019>> DISCLOSURE BY UNICREDIT GROUP
Credit Risk
27UNICREDIT GROUP DISCLOSURE
28
AS AT 31 MARCH 2019>> UNICREDIT GROUP DISCLOSURE
Market Risk
Market Risks
RWAs flow statements under the IMA
Shown below is a summary table about Market Risk RWA under internal models, as prescribed by EBA’s final report
Guidelines on Disclosure Requirements Under Part Eight of Regulation (EU) 575/2013.
The RWA reduction with respect of the fourth quarter in 2018 equal to €961 million, is mainly due to the change in the
exposure to interest rate and exchange rate risk in the trading book of UniCredit Bank AG and to an increase of
diversification benefit, partially offset by an increase of the position subject to the credit spread risk of Republic of Italy in the
trading book of UniCredit S.p.A.
EU MR2-B - RWA flow statements of Market Risk exposures under the internal model approach (€ million)
Total Total capital
VaR SVaR IRC CRM Other RWAs requirements
1 RWAs and capital requirements at 12.31.2018 1,355 4,365 2,807 - - 8,526 682
1a Regulatory adjustment 1,045 3,348 604 - - 4,997 400
RWAs and capital requirements at 12.31.2018 (end of the
1b day) 310 1,016 2,202 - - 3,529 282
2 Movement in risk levels 64 (289) 1,195 - - 969 78
3 Model updates/changes - - - - - - -
4 Methodology and policy - - - - - - -
5 Acquisitions and disposals - - - - - - -
6 Foreign exchange movements - - - - - - -
7 Other - - - - - - -
RWAs and capital requirements at 03.29.2019 (end of the
8a day) 374 727 3,397 4,498 360
8b Regulatory adjustment 811 2,256 - 3,067 245
8 RWAs and capital requirements at 03.29.2019 1,185 2,983 3,397 7,565 605
Notes related to the tables above:
• the amount reported in row 2 explains the change in the RWA shows in row 1b and 8a;
• the total RWA of €7,565 million is coherent with row 24 in Overview RWAs table (column “RWA”).
• the total capital requirements of €605 million is coherent with:
o row 24 in Overview RWAs table (column “Minimal capital requirements”);
o row B.4.2 of the Capital Adequacy table.
29I
UNICREDIT GROUP DISCLOSURE
30
AS AT 31 MARCH 2019>> UNICREDIT GROUP DISCLOSURE
Liquidity Risk
Liquidity Risk
Liquidity Coverage Ratio
The Liquidity Coverage Ratio (LCR), introduced by Basel 3 prudential regulation, is a short time indicator which aims to
ensure that credit institutions maintain an adequate liquidity buffer to cover the net liquidity outflows under severe conditions
of stress over a period of 30 days.
The regulatory framework applied is represented by:
• with reference to the requirements to be met:
o CRR Article 412 “Liquidity coverage requirement”;
o Commission Delegated Regulation (EU) 2016/61 of 10 October 2014 that lays down rules to specify in detail
the liquidity coverage requirement provided for in CRR Article 412(1). In particular, the requirement that all
institutions have to meet is equal to 100%;
o Commission Implementing Regulation (EU) 2016/322 of 10 February 2016 laying down implementing
technical standards with regard to supervisory reporting of institutions of the liquidity coverage requirement,
that is to be applied from 1st October 2016;
• with reference to the disclosure information to be published:
o CRR Article 435 which defines the disclosure requirements for each separate category of risk, including the
key ratios (letter f);
o EDTF (“Enhancing the risk disclosures of banks”) recommendation n° 4 that requires the disclosure of key
ratios (included LCR), once the applicable rules are finalised;
o EBA Guidelines 2017/01, published in March 2017 and applicable from December 31, 2017 relating to the full
set of LCR disclosure.
Therefore, disclosure is made according to the EBA guidelines mentioned above.
The Liquidity Coverage Ratio is calculated according to the Commission Implementing Regulation (EU) 2016/322 applied
from 1 October 2016.
EU LIQ1: LCR disclosure template
31I
Funding Strategies
During the first quarter European repo markets developed in a stable and resilient environment with a strong convergence of
rates toward the level of ECB Deposit Facility. Liquidity conditions remained highly supportive with EONIA and excess of
liquidity mainly ranging respectively between -37/-36 basis points and €1,800/1,900 billion. Liquidity on Italian repo market
remained positive with main part of the activity focused within 3M bucket and the General Collateral curve within 4-5 basis
points up to 1 year maturity (SN -40Bps, 3M -38Bps, 1Y -36Bps). ECB Quantitative Easing end together with the tightening of
BTPs’ spreads led to a decrease of special bonds’ number with an overall convergence of special rates toward GC ones. The
end of QE had a particular impact on core repo markets where repo rates drastically cheapened and curves flattened –
despite they remained negative sloped.
In relation to Medium-Long Term Funding, UniCredit Group maintains a funding strategy based on a balanced and diversified
approach, aimed at ensuring sustainability in terms of market capacity.
The access to multiple sources of liquidity from across various institutional markets in different geographies allows the Group
to maintain a proper level of liquidity while complying with various regulatory requirements.
In particular, during the first quarter of 2019 the Group re-affirmed its ability to access the capital market in different formats
across the capital structure and from different legal entities, leveraging on the strong support by its global fixed income
investor base:
- UniCredit SpA has issued 3 year Yankee Senior Non-Preferred Dual-Tranche for a total combined amount of $3
billion, a 10NC5 Tier 2 Transaction for €1 billion, PerpNC 6/2026 Additional Tier 1 Capital Notes for €1 billion and
15NC10 Yankee Tier 2 Callable Notes for $1.25 billion;
- UniCredit Bank AG has issued a 10 year Fixed Rate Hypothekenpfandbrief, whose oustanding has been
subsequently increased during Q1, for a total amount of €1 billion;
- UniCredit Bank Austria AG has issued a 7 year Pfandbrief for €500 million and a 10 year Pfandbrief for €500
million;
- Yapi Kredi has issued a PerpNC5 Additional Tier 1 transaction for $650 million and 5.5 year Senior Preferred Notes
for $500 million.
With reference to the above figures, the Entities belonging to the Group KOC Finansal Hizmetler - proportionally consolidated in regulatory
perimeter – are included through the full consolidation.
UNICREDIT GROUP DISCLOSURE
32
AS AT 31 MARCH 2019>> UNICREDIT GROUP DISCLOSURE
Liquidity Risk
33I
UNICREDIT GROUP DISCLOSURE
34
AS AT 31 MARCH 2019>> UNICREDIT GROUP DISCLOSURE
Leverage
Leverage
The Basel 3 prudential regulation (BCBS) introduced the requirement of calculation, reporting, and publication of leverage
ratio that is an additional regulatory requirement to risk based indicators.
The main leverage ratio objectives are:
• restricting the build-up of leverage in the banking sector;
• enhancing the capital ratios with a further, simple and not risk based measure.
The ratio is calculated according to the “Commission Delegated Regulation (EU) 2015/62 of 10 October 2014 amending
Regulation (EU) No 575/2013 of the European Parliament and of the Council with regard to the leverage ratio”.
The abovementioned regulation amends CRR article 429, complying with “Basel III leverage ratio framework and disclosure
requirement11”, issued in January 2014.
During In the session of 15 April 2019, the European Parliament approved 3% minimum requirement for the leveraging ratio
in the first pillar. An additional buffer is provided for the G-SII banks, calculated as 50 % of the G-SII buffer rate in
accordance with Article 131 of Directive 2013/36/EU.
The new EU Regulation 575/2013 applies two years after the date of publication in the Official Journal of the European Union
(June 2021). The new G-SIIs requirement shall apply from 1 January 2022.
The present disclosure is performed with the application of the “Commission Implementing Regulation (EU) 2016/200 of 15
February 2016 laying down implementing technical standards with regard to disclosure of the leverage ratio for institutions,
according to Regulation (EU) No 575/2013 of the European Parliament and of the Council”.
Content
CRR article 429 defined the leverage ratio as the Bank’s capital measure divided by the total exposure and it is
expressed ad percentage between:
• Tier 1 Capital;
• the total exposure, calculated as sum of all assets and off-balance sheet items not deducted when determining
the Tier 1 capital measure.
The total exposure includes (the below mentioned Articles refer to CRR):
• Derivatives – calculated according to the Current Exposure Method as per Article 274, or, as an alternative, the
Original Exposure Method as per Article 295; if specific conditions set by the Delegated act are met, received cash
variation margins can be excluded from the exposure. Written Credit Derivatives are calculated by including the
Fully Effective Notional amount, reduced by the fair value changes that have been incorporated in Tier 1 Capital. If
specific conditions are met the resulting exposure value may be further reduced by the effective notional amount of
purchased credit derivatives
• Security Financing Transactions (SFT) 12– calculated as sum of 2 components: the counterparty credit risk
exposure, i.e. the exposure net of collateral (and not including the haircut), and the accounting value of the SFT
asset; if specific conditions are met, it is possible to determine the exposure value of cash receivable and cash
payables on a net basis.
• Off-balance Sheet Exposure – calculated, according to Article 111 as nominal amount not reduced by specific
credit risk adjustments and by applying the Standardized Approach for RWA calculation credit conversion factors.
• Other Asset – calculated, according to Article 111, as accounting value reduced by specific credit risk
adjustments, additional value adjustments and other own funds reductions related to the asset item; if specific
conditions set by the Delegated act are met, cash variation margins provided for derivatives transactions can be
excluded from the exposure.
The following figures refer to the Leverage Ratio calculated by applying the transitional rules.
11
See “Basel III leverage ratio framework and disclosure requirements” http://www.bis.org/publ/bcbs270.htm.
12
Security Financing Transactions are repurchase transactions, securities or commodities lending or borrowing transactions and margin lending
transactions.
35I
Quantitative Information
The following table shows the Leverage Ratio as of 31 March 2019 and the breakdown of the exposure by main categories,
according to CRR Articles 451(1)(a), 451(1)(b) and 451(1)(c).
T ab le LRCom : Leverag e ratio com m on d isclo sure (€ million)
03.31.2019 12.31.2018
On-balance sheet exposures (excludin g derivatives and SFT s)
1 On-balance sheet items (excluding derivatives, SFTs and f iduciary assets, but including collateral) 749,431 749,131
2 (Asset amounts deducted in determining Tier 1 capital) (4,235) (4,128)
To tal on-balance sheet exposures (excluding derivatives, SFTs and fiduciary assets) (sum
3 745,196 745,003
of lin es 1 an d 2)
Derivative exposures
4 Replacement cost associated w ith all derivatives transactions (ie net of eligible cash variation margin) 15,306 14,467
5 A dd-on amounts f or PFE associated w ith all derivatives transactions (mark-to-market method) 19,372 18,227
EU-5a Exposure determined under Original Exposure Method - -
Gross-up f or derivatives collateral provided w here deducted f rom the balance sheet assets pursuant
6 - -
to the applicable accounting f ramew ork
7 (Deductions of receivables assets f or cash variation margin provided in derivatives transactions) (9,506) (7,996)
8 (Exempted CCP leg of client-cleared trade exposures) - -
9 A djusted ef f ective notional amount of w ritten credit derivatives 11,175 14,264
10 (Adjusted ef fective notional of fsets and add-on deductions for w ritten credit derivatives) (8,853) (11,775)
11 To tal derivative exposures (sum of lin es 4 to 10) 27,493 27,187
Securities financin g trans actio n exposures
12 Gross SFT assets (w ith no recognition of netting), af ter adjusting f or sales accounting transactions 89,360 76,167
13 (Netted amounts of cash payables and cash receivables of gross SFT assets) (4,423) (4,488)
14 Counterparty credit risk exposure for SFT assets 14,096 13,680
Derogation for SFTs: Counterparty credit risk exposure in accordance w ith A rticle 429b (4) and 222 of
EU-14a - -
Regulation (EU) No 575/2013
15 A gent transaction exposures - -
EU-15a (Exempted CCP leg of client-cleared SFT exposure) - -
16 To tal securitie s financing transaction exposu res (sum of lines 12 to 15a) 99,034 85,360
Other o ff-balance she et exposures
17 Off -balance sheet exposures at gross notional amount 376,866 356,654
18 (Adjustments for conversion to credit equivalent amounts) (220,578) (216,759)
19 Other off-balance s heet exposures (sum o f lines 17 to 18) 156,288 139,894
Exem pte d exposures in accordan ce w ith CRR Article 429 (7) and (14) (on and off b alance sh eet)
(Exemption of intragroup exposures (solo basis) in accordance w ith A rticle 429(7) of Regulation (EU)
EU-19a - -
No 575/2013 (on and of f balance sheet))
(Exposures exempted in accordance w ith Article 429 (14) of Regulation (EU) No 575/2013 (on and off
EU-19b - -
balance sheet))
Capital and total expos ures
20 Tier 1 cap ital 51,767 50,488
21 To tal le ve rage ratio exposures (s um of lines 3, 11, 16, 19, EU-19a an d EU-19b) 1,028,010 997,445
Leverage ratio
22 Le ve rage ratio 5.04% 5.06%
Choice on transitio nal arrangem ents and amoun t of derecognise d fiduciary item s
EU-23 Choice on transitional arrangements f or the definition of the capital measure Transitional Transitional
A mount of derecognised f iduciary items in accordance w ith Article 429(13) of Regulation (EU) No
EU-24 - -
575/2013
UNICREDIT GROUP DISCLOSURE
36
AS AT 31 MARCH 2019You can also read