Accelerating future mass loss of Svalbard glaciers from a multi-model ensemble
←
→
Page content transcription
If your browser does not render page correctly, please read the page content below
Journal of Glaciology                                Accelerating future mass loss of Svalbard
                                                                glaciers from a multi-model ensemble
                                                                Ward J. J. van Pelt1              , Thomas V. Schuler2,3, Veijo A. Pohjola1
           Article                                              and Rickard Pettersson1
                                                                1
           Cite this article: van Pelt WJJ, Schuler TV,          Department of Earth Sciences, Uppsala University, Uppsala, Sweden; 2Department of Geosciences, University of
           Pohjola VA, Pettersson R (2021). Accelerating        Oslo, Oslo, Norway and 3Arctic Geophysics, University Centre in Svalbard, Longyearbyen, Norway
           future mass loss of Svalbard glaciers from a
           multi-model ensemble. Journal of Glaciology
           67(263), 485–499. https://doi.org/10.1017/
                                                                Abstract
           jog.2021.2                                           Projected climate warming and wettening will have a major impact on the state of glaciers and
                                                                seasonal snow in High Arctic regions. Following up on a historical simulation (1957–2018) for
           Received: 11 September 2020
           Revised: 15 January 2021                             Svalbard, we make future projections of glacier climatic mass balance (CMB), snow conditions
           Accepted: 15 January 2021                            on glaciers and land, and runoff, under Representative Concentration Pathways (RCP) 4.5 and
           First published online: 17 February 2021             8.5 emission scenarios for 2019–60. We find that the average CMB for Svalbard glaciers,
                                                                which was weakly positive during 1957–2018, becomes negative at an accelerating rate during
           Keywords:
           climate change; glacier discharge; glacier mass
                                                                2019–60 for both RCP scenarios. Modelled mass loss is most pronounced in southern
           balance; glacier modelling; seasonal snow            Svalbard, where the equilibrium line altitude is predicted to rise well above the hypsometry
                                                                peak, leading to the first occurrences of zero accumulation-area ratio already by the 2030s. In par-
           Author for correspondence:                           allel with firn line retreat, the total pore volume in snow and firn drops by as much as 70–80% in
           Ward J. J. van Pelt,
           E-mail: ward.van.pelt@geo.uu.se
                                                                2060, compared to 2018. Total refreezing remains largely unchanged, despite a marked change in
                                                                the seasonal pattern towards increased refreezing in winter. Finally, we find pronounced short-
                                                                ening of the snow season, while combined runoff from glaciers and land more than doubles
                                                                from 1957–2018 to 2019–60, for both scenarios.

                                                                Introduction
                                                                Due to sea-ice related feedbacks, the climate on the archipelago of Svalbard, situated at the
                                                                southwestern boundary of wintertime Arctic sea-ice, experiences amplified climate change
                                                                compared to the global mean (AMAP, 2017; IPCC, 2019). During 1971–2017, temperatures
                                                                in Svalbard have risen by 3–5°C (Hanssen-Bauer and others, 2019), with fastest changes in
                                                                northern and eastern Svalbard. At the same time, precipitation trends at weather stations in
                                                                recent decades have not been significant or show moderate positive significant trends
                                                                (Hanssen-Bauer and others, 2019; Førland and others, 2020). Ensemble future projections
                                                                from statistical downscaling and regional climate models (RCMs) indicate a 6–7°C warming
                                                                and a precipitation increase of on average 45% from 1971–2000 to 2071–2100 for a medium
                                                                RCP 4.5 emission scenario. With strongest winter and spring warming, a main characteristic of
                                                                the projected precipitation increase is a substantial rise in frequency and intensity of winter-
                                                                time rainfall events (Hansen and others, 2014; Vikhamar-Schuler and others, 2016; Bintanja
                                                                and Andry, 2017).
                                                                    Air temperature and precipitation trends are the main drivers of glacier mass change.
                                                                Glacier mass change resulting from atmosphere–surface–subsurface interactions is best
                                                                described by the climatic mass balance (CMB), determined by precipitation, moisture fluxes
                                                                and runoff (Cogley and others, 2001). In contrast to surface mass balance (SMB), commonly
                                                                observed using the glaciological method, CMB accounts for internal accumulation, i.e. refreez-
                                                                ing below the previous summer surface. A number of recent modelling studies have quantified
                                                                the past SMB/CMB of all glaciers in Svalbard (Lang and others, 2015b; Aas and others, 2016;
                                                                Østby and others, 2017; Möller and Kohler, 2018; Van Pelt and others, 2019; Noël and others,
                                                                2020), which cover an approximate area of 33 775 km2 or 57% of the total land area (Fig. 1).
                                                                These studies consistently show a close to zero or weakly negative SMB/CMB in recent dec-
                                                                ades, but with a clear negative trend (Schuler and others, 2020). Schuler and others (2020)
                                                                combined observational records from various regions in Svalbard to estimate a total CMB
                                                                of −7 ± 4 Gt a−1 during 2000–2019, and a total glacier mass balance, i.e. including frontal abla-
                                                                tion, of −8 ± 6 Gt a−1.
                                                                    Although many modelling or observational studies present past and current CMB and SMB
                                                                of all Svalbard glaciers, future projections are relatively scarce. Day and others (2012) used a
           © The Author(s), 2021. Published by                  statistical approach to find dramatic increases in precipitation offsetting most of the increase in
           Cambridge University Press. This is an Open
                                                                glacier melting during the 21st century. Lang and others (2015a) used a RCM to simulate SMB
           Access article, distributed under the terms of
           the Creative Commons Attribution licence             evolution up to 2100 under a high-emission RCP 8.5 scenario to find that the entire glacierized
           (http://creativecommons.org/licenses/by/4.0/),       area of Svalbard would be prone to a negative SMB from 2085 onwards. Most recently, RCM
           which permits unrestricted re-use,                   output for the time-slices 1970–2000 and 2070–2100, included in the Climate in Svalbard 2100
           distribution, and reproduction in any medium,        report (Hanssen-Bauer and others, 2019), showed a drop in Svalbard CMB from −14 to −87
                                                                Gt a−1 and an equilibrium line altitude (ELA) increase from 653 to 1067 m a.s.l. between the
           provided the original work is properly cited.

                                                                two periods for the RCP 8.5 scenario.
                                                                    Similar to glacier mass balance, seasonal snow conditions on glacierized and non-
           cambridge.org/jog                                    glacierized terrain in Svalbard depend heavily on trends in temperature and precipitation,

Downloaded from https://www.cambridge.org/core. 25 Nov 2021 at 23:32:30, subject to the Cambridge Core terms of use.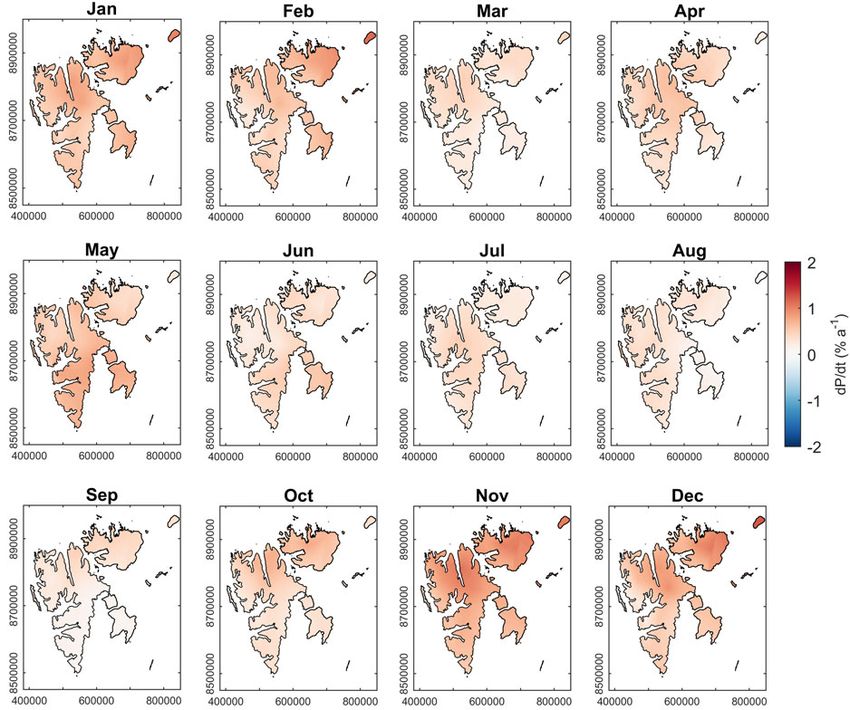
486                                                                                                                                Ward van Pelt and others

                                                                                                   others (2015a) and Hanssen-Bauer and others (2019) used spatial
                                                                                                   resolutions of 25, 10 and 2.5 km respectively.

                                                                                                   Methods
                                                                                                   Model and setup
                                                                                                   A surface energy-balance model coupled with a multilayer snow/
                                                                                                   firn model (EBFM; Van Pelt and others, 2012, 2019) is used to
                                                                                                   simulate the future CMB, seasonal snow and firn conditions,
                                                                                                   and runoff for the entire land-area of Svalbard. Detailed descrip-
                                                                                                   tions of the model physics and numerical implementation can be
                                                                                                   found in Van Pelt and others (2019) and references therein.
                                                                                                       The model uses meteorological input of air temperature, rela-
                                                                                                   tive humidity, cloud cover, precipitation and air pressure, to solve
                                                                                                   the surface energy balance and estimate surface temperature and
                                                                                                   melt. The energy-balance routine determines net solar radiation,
                                                                                                   net thermal radiation, turbulent heat exchange and the subsurface
                                                                                                   heat flux (Van Pelt and others, 2012). A recently updated albedo
                                                                                                   scheme (Van Pelt and others, 2019), based on Bougamont and
                                                                                                   others (2005), introduces the effect of temperature and water con-
                                                                                                   tent dependent ageing of snow on surface albedo. The fraction of
                                                                                                   precipitation falling as snow and rain changes linearly within a ±
                                                                                                   1°C band around a calibrated threshold temperature (0.6°C; Van
                                                                                                   Pelt and others, 2019). The surface model is two-way coupled
                                                                                                   to a subsurface routine, computing the multi-layer evolution of
          Fig. 1. Topographic map of Svalbard. Different colour scales are used for glacier- and
                                                                                                   density, temperature and water content. The subsurface model
          non-glacier areas. The archipelago is split into three regions, with borders given by    simulates densification, due to refreezing and compaction, as
          the brown lines: northwest (NW), northeast (NE) and south (S). UTM easting and           well as temperature changes, due to heat conduction and refreez-
          northing coordinates are in zone 33X. Elevations are extracted from the DEM S0           ing. The model accounts for irreducible water storage, i.e. water
          Terrengmodel Svalbard, provided by the Norwegian Polar Institute (Norwegian
                                                                                                   held in place by capillary forces, while percolating water is trans-
          Polar Institute, 2014). Glacier outlines are extracted from the Global Land Ice
          Measurements from Space (GLIMS) database (König and others, 2014). The orange            ported vertically using a combined bucket-type and deep-
          circle marks the location of the time series shown in Figure 3.                          percolation scheme (Marchenko and others, 2017), and becomes
                                                                                                   runoff if it reaches the base of the vertical domain or if the under-
                                                                                                   lying layers are impermeable ice or soil. Seasonal snow modelling
                                                                                                   in non-glacier terrain became possible with the inclusion of a soil
          which control precipitation type and amount, snowmelt and                                thermal model (Westermann and others, 2011), as described in
          the length of the snow and snow-free season. Modelling studies                           Pramanik and others (2018).
          covering all of Svalbard show that since the 1950s snow arrives                              After earlier applications of the model to single or small sets of
          later in autumn by 1–2 d per decade, while no significant trend                          glacier basins in central Svalbard (e.g. Van Pelt and others, 2012,
          is found for snow disappearance in spring/summer (Van Pelt                               2018; Marchenko and others, 2017) and western Svalbard (e.g.
          and others, 2016a, 2019). Future consequences of projected                               Van Pelt and Kohler, 2015; How and others, 2017; Pramanik
          climate change on snow conditions in Svalbard include, among                             and others, 2018; Winsvold and others, 2018; Köhler and others,
          others, continued snow season shortening, an earlier peak of                             2019), the model has recently been applied to the entire glacier-
          maximum snow depth in spring, increased avalanche risk and                               ized and non-glacierized area of Svalbard (Van Pelt and others,
          an increased frequency and intensity of winter-time rain-on-snow                         2019). In the latter, the model and the downscaling of meteoro-
          events (Hanssen-Bauer and others, 2019).                                                 logical fields were extensively evaluated against in situ stake mass-
              This study is a follow up on a recent study by Van Pelt and                          balance data, weather station records and firn core profiles across
          others (2019), presenting a dataset of CMB, snow conditions                              Svalbard, which helped to reduce model biases and errors.
          and runoff in Svalbard for the period 1957–2018. Here we force                               Here, we use the same calibrated set of parameter values as in
          our simulations by using output from the Arctic CORDEX                                   Van Pelt and others (2019) for future simulations. Using the
          RCMs (Hanssen-Bauer and others, 2019), which downscale sev-                              3-hourly meteorological time series described in the next subsec-
          eral different general circulation model (GCM) simulations. We                           tion, we will perform simulations for the emission scenarios RCP
          extract climate trends and combine them with historical down-                            4.5 and RCP 8.5 covering the period from 1 September 2018 to 31
          scaled reanalysis data to construct a future climate forcing for                         August 2060. Subsurface conditions at the end of the historical
          two emission scenarios (RCP 4.5 and RCP 8.5). With these two                             simulation (31 August 2018) in Van Pelt and others (2019) are
          forcings a coupled energy-balance – snow/firn model (Van Pelt                            used as initial conditions in the current experiments. As in Van
          and others, 2012, 2019) simulates glacier CMB, seasonal snow                             Pelt and others (2019), the model is run with a 3-hourly temporal
          conditions and runoff for the period 2018–60. We employ the                              and 1 × 1-km spatial resolution, and the subsurface model con-
          same spatial resolution (1 × 1 km), fixed geometry, time step                            sists of 50 vertical layers on a Lagrangian grid, extending to max-
          (3-hourly) and parameter setup as in Van Pelt and others                                 imum depths of 5 and 20 m in non-glacier and glacier terrain,
          (2019). The latter has extensively been calibrated against a                             respectively.
          range of observational data across Svalbard (Van Pelt and others,                            As in Van Pelt and others (2019), glacier outlines, extracted
          2019). The 1-km spatial resolution used provides unprecedented                           from the Global Land Ice Measurements from Space (GLIMS;
          spatial detail of future glacier mass change and snow conditions                         König and others, 2014) database, and grid elevations, extracted
          in Svalbard; for comparison, Day and others (2012), Lang and                             from the S0 Terrengmodel Svalbard (Norwegian Polar

Downloaded from https://www.cambridge.org/core. 25 Nov 2021 at 23:32:30, subject to the Cambridge Core terms of use.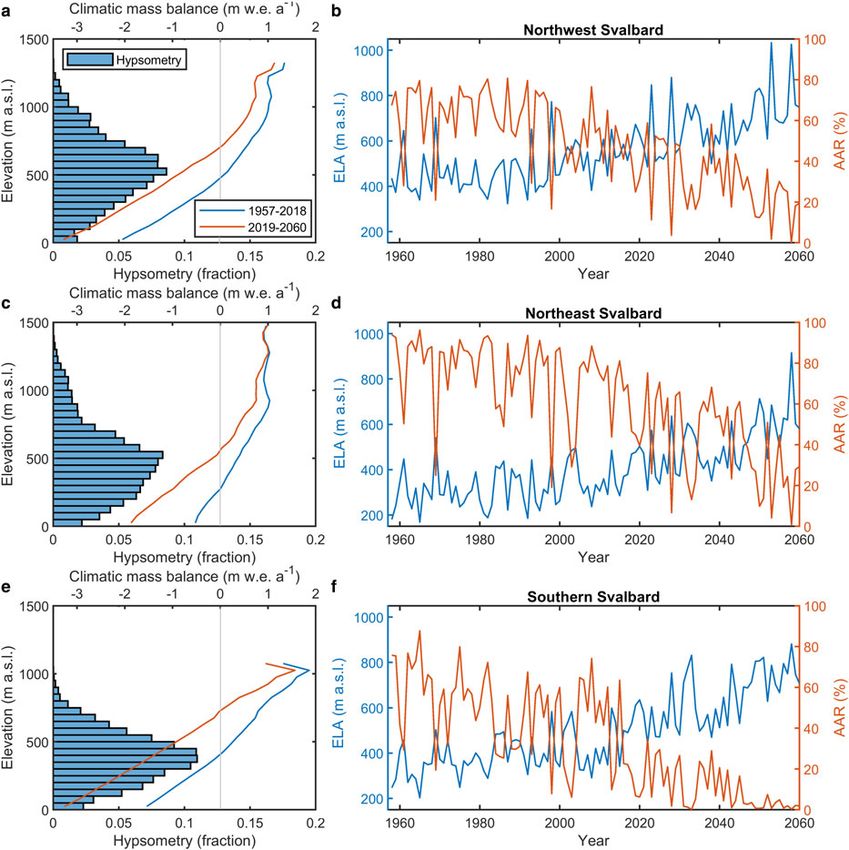
Journal of Glaciology                                                                                                                                                    487

           Institute), are held fixed throughout the simulations. This argu-
           ably has an impact on e.g. simulated CMB and runoff, even
           though the two main effects (glacier thinning and retreat) have
           impacts of opposite sign. To test this, we perform an additional
           sensitivity experiment where the model simulates only large
           (>20 km2) land-terminating glaciers and converts annual CMB
           values into elevation changes using a parameterization given in
           Huss and others (2010) and Huss and Hock (2015). Ice thickness
           is taken from the Svalbard glacier thickness database presented in
           Fürst and others (2018). The simulation is performed for the RCP
           4.5 scenario and covers the period 2018–60; elevations and out-
           lines in 2018 are given by the original (previously fixed) datasets.
           We do not attempt to simulate tidewater glacier retreat, to avoid
           additional uncertainties related to the description of frontal abla-
           tion, and small (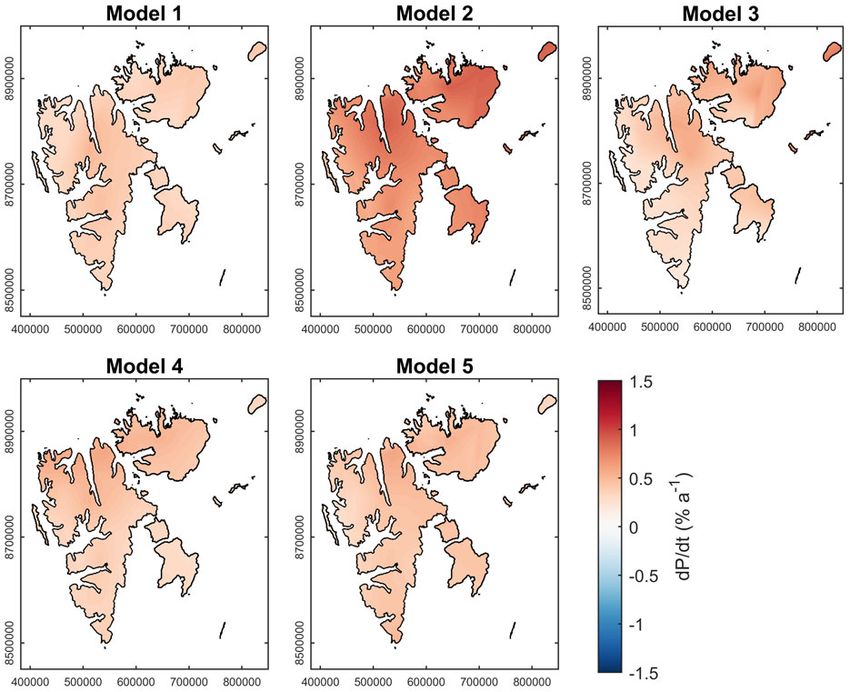
488                                                                                                                               Ward van Pelt and others

          Fig. 3. Time series of air temperature in 1999, 2029 and 2059
          at 520 m a.s.l. on Nordenskiöldbreen in central Svalbard
          (location marked in Fig. 1).

          cloud cover and air pressure), the 1988–2018 time series are dir-                        and compare results with existing output for the period 1957–
          ectly repeated during 2018–48 and 2048–60, and no detrending or                          2018 (Van Pelt and others, 2019). Most emphasis will be given
          long-term trends have been applied. Figure 3 shows an example of                         to the results for the medium-emission RCP 4.5 scenario.
          1-year temperature time series with daily resolution during 1999,                        Finally, we discuss uncertainties and the sensitivity of the results
          2029 and 2059 at a site at 520 m a.s.l. on Nordenskiöldbreen in cen-                     to the use of a fixed glacier geometry.
          tral Svalbard (location marked in Fig. 1), revealing the seasonal
          inhomogeneity in warming.
              This approach, combining short-term historical variability
                                                                                                   Climatic mass balance
          with long-term trends from ensemble RCM output to generate
          future time series, has been used previously by Van Pelt and                             Van Pelt and others (2019) found that the mean CMB for Svalbard
          others (2016b). The technique used here is also similar to the                           was +0.09 m w.e. a−1 for 1957–2018, with a negative trend of
          Statistical Analogue Resampling Scheme (STARS; Orlowsky and                              −0.06 m w.e. a−1 decade−1. Here, we find that for 2019–60 the spa-
          others, 2007; Lutz and Gerstengarbe, 2014). Both methods super-                          tial mean CMB becomes strongly negative with values of −0.82
          impose linear trends on historical variability, but differ in how                        and −1.06 m w.e. a−1 for RCP 4.5 and 8.5 respectively (Fig. 4).
          short-term weather variations are repeated. In general, the main                         This corresponds to a total mass change of −31 and −40 Gt a−1
          advantages of the employed method are that only one run is                               to which mass loss due to frontal ablation needs to be added
          required with the energy balance–snow model per RCP scenario                             (assuming negligible basal melting). Blaszczyk and others (2009)
          (rather than running the model for multiple individual future                            estimated frontal ablation at −0.20 m w.e. a−1 (− 6.8 Gt a−1) for
          RCM realizations), and that potential erroneous short-term                               the period 2003–09. An updated frontal ablation estimate for
          meteorological variability in individual future RCM realizations                         the more recent period 2013–18 is considerably higher, at ∼15
          is not affecting our results since we only extract long-term trends                      Gt a−1 (G. Moholdt and others, manuscript in preparation).
          from the RCM output. A potential drawback is a lack of trends                            Differences between 1957–2018 and 2019–60 CMB for RCP
          in cloud cover, relative humidity and air pressure. Even though                          4.5 (Fig. 4c) show strongest future changes at low elevations in
          there are indications that future cloud cover and relative humid-                        the south and east of Svalbard (down to −2 m w.e. a−1); this spa-
          ity may increase (e.g. Cao and others, 2017), these processes                            tial distribution is in line with the pattern Van Pelt and others
          depend heavily on local circulation patterns and orography                               (2019) found for 1957–2018. Time series of CMB for 1957–
          and as a result no reliable trends could be extracted from the                           2060 (Fig. 5a) reveal an acceleration of mass loss despite linear
          coarse-resolution Arctic CORDEX RCMs. The coarse resolution                              temperature and precipitation trends, illustrating the impact of
          of the Arctic CORDEX RCMs currently also limits the represen-                            a feedback resulting from ablation zone expansion on the
          tation of feedbacks from the surface to the atmosphere over land,                        CMB (Van Pelt and others, 2012; Van Pelt and Kohler, 2015).
          e.g. regarding local atmospheric warming due to albedo reduc-                                The difference in future CMB between the two emission scen-
          tions. Higher-resolution RCM output would facilitate generation                          arios is only 21% of the total change between the historical run
          of more detailed air temperature trend maps, exhibiting more                             and the mean of the RCP 8.5 scenario, which is comparable to
          local variability than in the current maps shown in Appendix                             the relative changes in both temperature and precipitation. It is
          Figures 14 and 16. Finally, by directly repeating historical vari-                       noteworthy that temperature and precipitation discrepancies
          ability in the future, we implicitly assume that the frequency of                        between the two RCP scenarios are small for the period consid-
          weather events remains consistent in time. This could potentially                        ered here compared to projections for 2071–2100, as further
          introduce biases in our model results, e.g. when the frequency of                        discussed in Hanssen-Bauer and others (2019).
          warm spells changes. However, a recent study by Isaksen and                                  Increasingly negative CMB implies a rise in the ELA. On aver-
          others (2016) did not detect a significant change in the frequency                       age for Svalbard, we find an increase in ELA from 372 m a.s.l.
          of ‘warm’ atmospheric circulation types, and ascribed the recent                         (1957–2018) to 581 m a.s.l. for the RCP 4.5 scenario (2019–60).
          warming rather to increased sea surface temperature and a gen-                           When splitting Svalbard into three regions (Fig. 1), we find the
          eral background warming trend.                                                           lowest ELA in northeast Svalbard, which experiences the smallest
                                                                                                   increase, from 324 to 513 m a.s.l., between the historical and
                                                                                                   future periods (Fig. 6). Although the highest ELAs are in north-
          Results and discussion                                                                   west Svalbard, the strongest increase is in southern Svalbard
                                                                                                   (from 394 to 644 m a.s.l.). The mean 2019–60 ELA for southern
          In this section, we present, analyse and discuss the results from                        Svalbard lies way above the peak in hypsometry (Fig. 6e), while
          two future simulations for the scenarios RCP 4.5 and RCP 8.5,                            for NW and NE Svalbard the ELA is at or just above the

Downloaded from https://www.cambridge.org/core. 25 Nov 2021 at 23:32:30, subject to the Cambridge Core terms of use.
Journal of Glaciology                                                                                                                                            489

           Fig. 4. Spatial distribution of CMB, averaged over the periods 1957–2018 (a) and 2019–60 (b) for the RCP 4.5 emission scenario. The difference between the two
           periods (Δ) is shown in panel (c).

                                                                                                     hypsometry peak (Figs 6a, c). As argued by Noël and others
                                                                                                     (2020), the hypsometry of Svalbard glaciers, which lies predomin-
                                                                                                     antly at relatively low elevations, increases their sensitivity to
                                                                                                     future climate warming. With increasing ELA the accumulation-
                                                                                                     area ratio (AAR), i.e. the ratio of the accumulation zone area to
                                                                                                     the total glacier area, declines. This effect is most noticeable in
                                                                                                     southern Svalbard, and is amplified by the comparatively sharp
                                                                                                     peak in hypsometry. Our results suggest that the AAR is likely
                                                                                                     to reach zero with increasing frequency from the 2030s onwards,
                                                                                                     leading to negative CMB for the entire glacier area. The higher
                                                                                                     elevations of NW and NE Svalbard mean that zero AAR values
                                                                                                     occur later, in the 2050s. The higher climate sensitivity of CMB
                                                                                                     in low-elevation ablation zones compared to high-elevation accu-
                                                                                                     mulation areas (Van Pelt and others, 2012) explains the general
                                                                                                     steepening of the mass-balance gradient (Fig. 6a, c, e), which is
                                                                                                     most pronounced in NE Svalbard.

                                                                                                     Glacier snow and firn conditions

                                                                                                     Rising ELA implies that the firn line retreats to higher elevations,
                                                                                                     while the remaining firn densifies as an indirect response to
                                                                                                     higher melt rates and increased significance of refreezing. Both
                                                                                                     firn line retreat and snow/firn densification affect the amount of
                                                                                                     pore volume, i.e. the amount of air, in snow and firn across
                                                                                                     Svalbard, which we use here as a parameter for further analysis.
                                                                                                     Here, pore volume is defined between the surface and a depth
                                                                                                     of 12 m below the surface. Annual snapshots of pore volume,
                                                                                                     expressed in m3 m−2, in 2018 and 2060 (Fig. 7a, b), show a
                                                                                                     complete loss of pore volume in southern Svalbard by 2060
                                                                                                     for the RCP 4.5 scenario, and dramatic pore volume reductions
                                                                                                     on Holtedahlfonna and Austfonna Ice Caps in northwest
                                                                                                     and northeast Svalbard, respectively; only high-elevation
                                                                                                     Lomonosovfonna Ice Cap in central Svalbard maintains a sub-
                                                                                                     stantial firn area by the end of the simulation. Time series of
           Fig. 5. Annual time series of total CMB (a) and porespace (b) on glaciers, together
           with total runoff (c) and refreezing (d) for glacier and non-glacier areas. Time series
                                                                                                     pore volume (Fig. 5b) show a rapid reduction in pore volume,
           are shown for the historical run (1957–2018) and for the RCP 4.5 and 8.5 future scen-     dropping from 68 km3 in 2018 to 21 km3 (RCP 4.5) or 14 km3
           arios (2018–60).                                                                          (RCP 8.5) in 2060.

Downloaded from https://www.cambridge.org/core. 25 Nov 2021 at 23:32:30, subject to the Cambridge Core terms of use.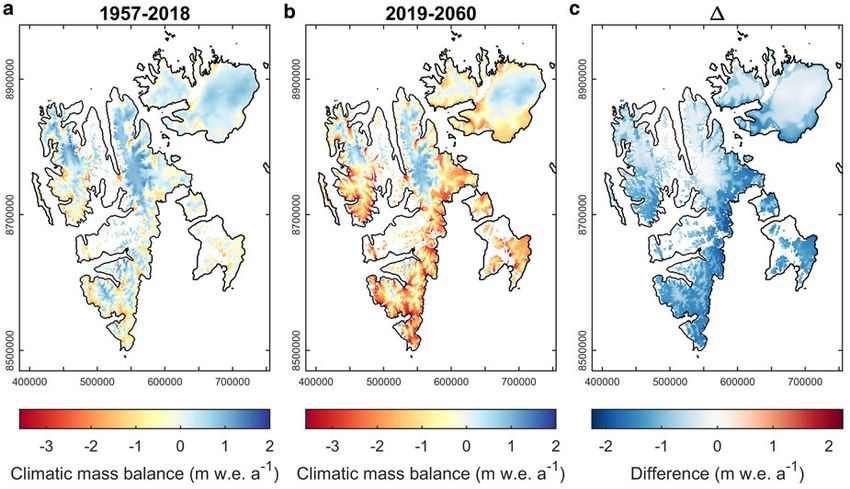
490                                                                                                                                             Ward van Pelt and others

          Fig. 6. Left: Elevation profiles of glacier hypsometry and CMB for northwest (a), northeast (c) and south Svalbard (e) for the RCP 4.5 scenario. Right: Time series of
          ELA and AAR for northwest (b), northeast (d) and south Svalbard (f) for the RCP 4.5 scenario. The regions (NW, NE and S) are indicated in Figure 1.

              Refreezing has been shown to be most prominent in the accu-                            in early years of the future simulation are explained by the fact
          mulation zones on Svalbard (e.g. Østby and others, 2017; Van Pelt                          that after removing the linear trend the winters from 1990 to
          and others, 2019). Despite predicted reductions in the accumula-                           1994 in the reference period remain above-average warm, with a
          tion area and pore volume, refreezing does not show a significant                          relatively high frequency of winter warm spells; repeating these
          upward or downward trend (Fig. 5d) in either of the future scen-                           time series with future climate trends applied to them yield relatively
          arios. Total refreezing for all of Svalbard changes from 12.5 Gt a−1                       high melt, rainfall and refreezing rates during 2020–24 compared to
          for 1957–2018 to 12.2 Gt a−1 for both RCP scenarios, and refreezing                        the surrounding years.
          on glaciers alone increases weakly from 8.6 to 9.0 Gt a−1. On glaciers,                        With a reduction in firn areal extent, the potential for deep
          a combination of factors explains the absence of a clear trend. On                         water storage in perennial firn aquifers (PFAs) is reduced. PFAs
          the one hand, there is reduced potential for refreezing in snow                            have been observed in western Svalbard, on Holtedahlfonna Ice
          and firn due to (1) less potential for water storage in (denser)                           Cap (Christianson and others, 2015) and on Lomonosovfonna
          snow and firn, and (2) less pronounced cooling of snow and firn                            Ice Cap in central Svalbard (Uppsala University; unpublished
          during winter reducing the potential for refreezing at the start of                        data), and develop in locations where continuously temperate
          the following melt season. On the other hand, an increased fre-                            and deep firn prevails (Kuipers Munneke and others, 2014),
          quency of winter melt and rainfall events across Svalbard (Fig. 8a)                        and where runoff is slow. Although temperate firn conditions at
          increases the potential for winter-time refreezing. The above factors                      12-m depth are a common feature in the present (Fig. 9a), a con-
          appear to compensate each other in a future climate. One conse-                            siderable reduction in the extent of temperate firn zones is pro-
          quence is that the seasonal distribution of refreezing, as shown in                        jected (Fig. 9b). At locations with PFAs, water tables are likely
          Figure 8b for all of Svalbard, changes markedly, revealing reduced                         to reach closer to the surface in the near future, possibly becoming
          refreezing during the melt season and increased refreezing during                          surface lakes in local depressions. The latter effect is the combined
          the cold season. Comparatively high winter-time refreezing rates                           result of increased melt water supply and reduced pore volume.

Downloaded from https://www.cambridge.org/core. 25 Nov 2021 at 23:32:30, subject to the Cambridge Core terms of use.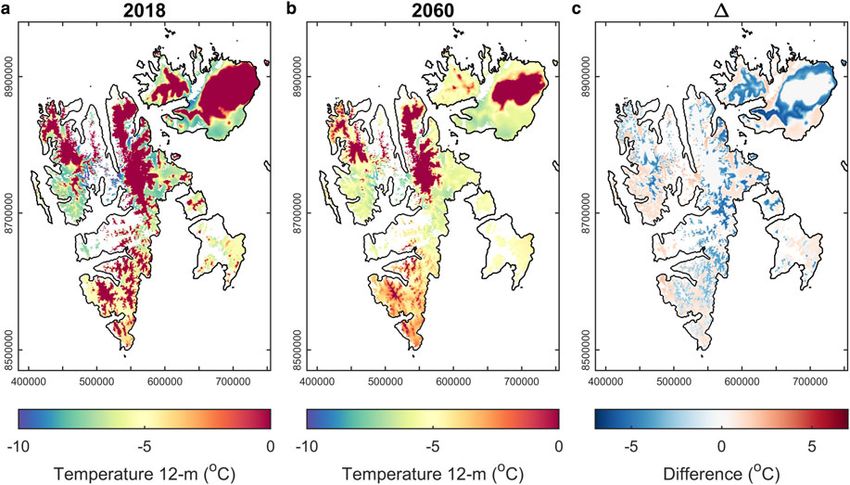
Journal of Glaciology                                                                                                                                                      491

           Fig. 7. Spatial distribution of snow/firn pore volume on glaciers in 2018 (a) and 2060 (b) for the RCP 4.5 scenario. The difference between the two distributions (Δ) is
           shown in panel c.

           Fig. 8. Diagrams showing monthly melt and rain (a), refreezing (b) and runoff (c) for the RCP 4.5 scenario and averaged for the entire land area of Svalbard.

           Runoff and snow season length
                                                                                                       2019–60, including contributions from glacier and non-glacier
           Increased glacier melt and rainfall, and a negligible change in                             terrain, amounts to 97 (RCP 4.5) or 109 (RCP 8.5) Gt a−1,
           refreezing, lead to a strong positive trend in runoff from glacier-                         which is more than two times the amount of 46 Gt a−1 during
           ized areas in Svalbard (Fig. 10). The average total runoff during                           1957–2018 (Fig. 5c). The relative contribution of runoff from non-

Downloaded from https://www.cambridge.org/core. 25 Nov 2021 at 23:32:30, subject to the Cambridge Core terms of use.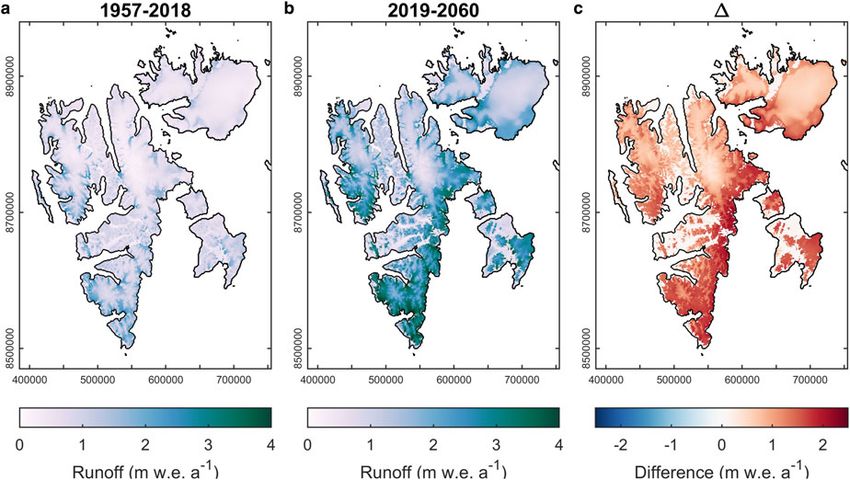
492                                                                                                                                          Ward van Pelt and others

          Fig. 9. Spatial distribution of subsurface temperature at 12-m depth on glaciers in 2018 (a) and 2060 (b) for the RCP 4.5 scenario. The difference between the two
          distributions (Δ) is shown in panel (c).

          Fig. 10. Spatial distribution of runoff, averaged over the periods 1957–2018 (a) and 2019–2060 (b) for the RCP 4.5 scenario. The difference between the two periods
          (Δ) is shown in panel (c).

          glacierized areas drops from 31% during 1957–2018 to 20% (RCP                             the end of the future simulation, with major spikes that mostly
          4.5) or 19% (RCP 8.5) during 2019–60. As for CMB, the largest                             represent large winter rainfall events.
          changes are expected at the lower elevations on glaciers in southern                          Changes in snowfall and runoff affect the duration of the snow
          Svalbard, which leads to runoff increases between the historical and                      and snow-free season in the glacier ablation zones and in non-
          future periods that in some locations exceed 2 m w.e. a−1 (Fig. 10c).                     glacier terrain. The spatial mean snow-free season length is
          The seasonal signature of runoff (Fig. 8c) shows an increased dur-                        found to increase from 37 d in 1957–2018 to 87 d (RCP 4.5) or
          ation and intensity of the runoff peak in summer, caused by the                           102 d (RCP 8.5) in 2019–60. The spatial distribution of the snow-
          combined effects of increased melt and rainfall (Fig. 8a) and                             free season length for the two periods for the RCP 4.5 scenario
          reduced summer-time refreezing (Fig. 8b). Furthermore, although                           reveals that largest changes are projected for southeastern
          winter and spring runoff is negligible in the first decades of the his-                   Svalbard with local changes exceeding 150 d, i.e. more than
          torical run, it becomes increasingly significant, particularly towards                    5 months, while the remaining firn zones in 2060 experience a

Downloaded from https://www.cambridge.org/core. 25 Nov 2021 at 23:32:30, subject to the Cambridge Core terms of use.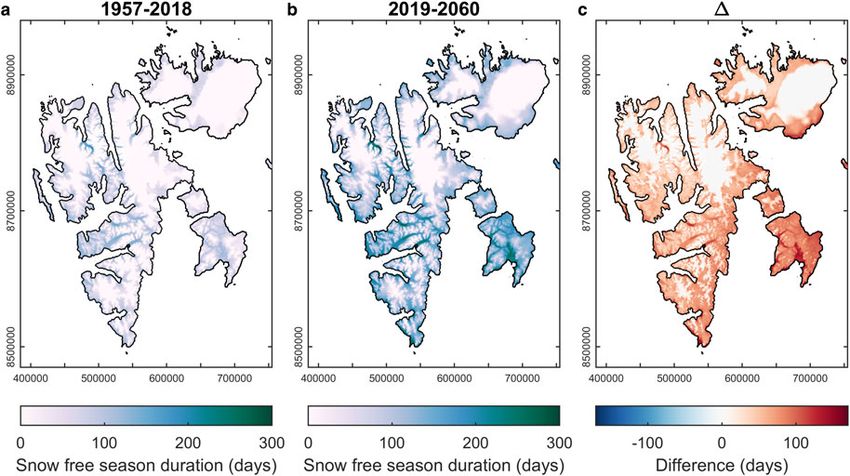
Journal of Glaciology                                                                                                                                                       493

           Fig. 11. Spatial distribution of the snow-free-season duration, averaged over the periods 1957–2018 (a) and 2019–60 (b) for the RCP 4.5 scenario. Differences
           between the two periods (Δ) are shown in panel (c).

           zero change (Fig. 11c). The seasonal distribution of snow cover
           fraction (Fig. 12), defined as the fraction of the total land area in
           Svalbard covered with >0.01 m w.e. of snow, which shows that earl-
           ier snow disappearance in spring and later snow onset in autumn
           both contribute to the increased snow-free season duration. This is
           different to the results of Van Pelt and others (2019), who found
           that snow onset came later in autumn, but that there was a negli-
           gible change in snow disappearance date. Figure 12 further shows
           that the minimum snow cover fraction in August nearly halves
           from 58 to 33% (RCP 4.5) or 31% (RCP 8.5) from 1957–2018 to
           2019–60, while occasional snow-free conditions may occur locally
           during November to March in a future climate.

           Uncertainties

           A discussion of uncertainties affecting the results for the historical
           run (1957–2018) was given in Van Pelt and others (2019), and                             Fig. 12. Monthly snow cover fraction for the RCP 4.5 scenario during 1957–2018 and
                                                                                                    2019–60. Here, the snow cover fraction is defined as the fraction of the total land-area
           included a description of uncertainty induced by the use of a                            covered with >1 cm w.e. of snow. Monthly values are determined as the mean of daily
           fixed glacier geometry, the uncertainty of the climate forcing,                          snow cover fraction values.
           and modelling errors. In the ‘Methods’ section we have described
           the choice for the approach to generate future climate forcing, in
           which advantages and drawbacks are mentioned. For more dis-                                  To quantify the impact of ignoring changes in glacier geom-
           cussion on this the reader is referred to Van Pelt and others                            etry, we performed a sensitivity experiment as described in the
           (2016b), where a similar method to construct a future meteoro-                           ‘Methods’ section. In the experiment, volume changes of all
           logical forcing was first used. In the remainder of this section,                        large (>20 km2) land-terminating glaciers in Svalbard are mod-
           we discuss the impact of using a fixed geometry for the glaciers                         elled over the period 2019–60 for the RCP 4.5 scenario. Glacier
           in our simulations.                                                                      geometries evolve by applying annual CMB values to update sur-
               The use of a constant glacier geometry implies that potential                        face heights at the end of every mass-balance year (31 August)
           changes in glacier area and elevation are ignored. As discussed                          according to a relation by Huss and others (2010). A comparison
           in Van Pelt and others (2019), this means that our model output                          of total runoff and CMB with and without evolving geometry is
           is calculated for a so-called ‘reference surface’ (Elsberg and others,                   shown in Figure 13. We find that the compensating effects of
           2001). A drawback of this is that, in case the actual surface and                        thinning-enhanced surface melting and the melt reduction fol-
           reference surface start to deviate much, that the calculated values                      lowing retreat of glacier fronts have a nearly balancing effect on
           no longer represent nature, but rather become virtual quantities.                        both runoff and CMB. By the end of the simulation in 2060,
           An advantage is that the effect of climate trends on glacier mass                        when largest discrepancies prevail, runoff increased from 16.9
           change can be isolated, i.e. that the results do not show the                            Gt a−1 for a static surface to 17.6 Gt a−1 for a dynamic surface,
           mixed signature of climate-induced trends and trends induced                             equivalent to a 4% increase. For comparison, with a dynamic
           by geometric changes.                                                                    geometry the total volume of the considered glaciers drops by

Downloaded from https://www.cambridge.org/core. 25 Nov 2021 at 23:32:30, subject to the Cambridge Core terms of use.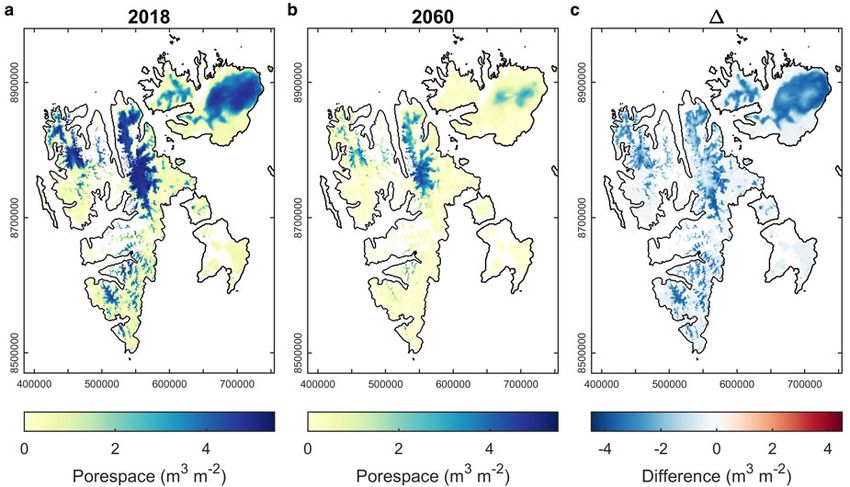
494                                                                                                                                      Ward van Pelt and others

                                                                                                   with increasingly frequent rainfall events, and lower refreezing
                                                                                                   in summer due to a reduction in the cold content. With shrinking
                                                                                                   temperate firn zones and the aforementioned loss of firn pore vol-
                                                                                                   ume in a future climate, the extent and volume of PFAs is
                                                                                                   expected to decline. For seasonal snow on glaciers and in non-
                                                                                                   glacier terrain, we project a more than doubling of the snow-free
                                                                                                   season length from 1957–2018 to 2019–60, with comparable con-
                                                                                                   tributions from earlier snow disappearance in spring and later
                                                                                                   snow arrival in autumn. Total runoff is found to increase mark-
                                                                                                   edly from 46 to 97 (RCP 4.5) or 109 (RCP 8.5) Gt a−1, with an
                                                                                                   increasing relative contribution from glacier-covered areas.
                                                                                                   Finally, a sensitivity experiment with dynamic glacier geometry
                                                                                                   for large land-terminating glaciers was performed, which suggests
                                                                                                   that assuming constant glacier geometry only has a limited impact
                                                                                                   on the simulated runoff and CMB.

                                                                                                   Data
                                                                                                   The data shown in Figures 2–13 and Appendix Figures 14–17 are
                                                                                                   published in the online data repository (Van Pelt and others,
          Fig. 13. Time series of total runoff (a) and CMB (b) for simulations of large land-      2021). A complete list of available model output variables at
          terminating glaciers with a fixed and dynamic surface for the RCP 4.5 scenario.
          Additionally, total glacier volume is shown on the right axis in panel (b).
                                                                                                   daily temporal and 1-km spatial resolution can be found at
                                                                                                   http://www.wardvanpelt.com/model_output.txt. These data are
                                                                                                   provided on request by contacting the main author.
          as much as 24% in 2060 between the two experiments (Fig. 13b),
                                                                                                   Acknowledgments. We thank the Norwegian Meteorological Institute for
          while the glacier area shrinks by 14%. It should be noted that the
                                                                                                   giving access to the HIRLAM regional climate model output. Ward van Pelt
          sensitivity experiment above only applies to a limited sample of                         receives funding support from the Swedish National Space Agency (project
          glaciers in Svalbard, comprising 18% of the total present-day gla-                       no. 189/18).
          cier volume in Svalbard, and that potentially different sensitivities
          may apply for tidewater glaciers and small land-terminating gla-
          ciers. This could not be quantified here, and ideally requires coup-                     References
          ling of the current model with an ice flow model, which is left for
          future study.                                                                            Aas KS and 6 others (2016) The climatic mass balance of Svalbard glaciers: a
                                                                                                      10-year simulation with a coupled atmosphere–glacier mass balance model.
                                                                                                      The Cryosphere 10, 1089–1104. doi: 10.5194/tc-10-1089-2016.
                                                                                                   AMAP (2017) Snow, water, ice and permafrost in the Arctic (SWIPA). Arctic
          Conclusions                                                                                 Monitoring and Assessment Programme (AMAP), Oslo, Norway, ISBN
          We presented projections of future CMB, snow conditions and                                 978-82-7971-101-8.
          runoff for Svalbard. With a coupled energy balance–subsurface                            Bintanja R and Andry O (2017) Towards a rain-dominated Arctic. Nature
          model simulations for two emission scenarios (RCP 4.5 and                                   Climate Change 7(4), 263–267, ISSN 17586798. doi: 10.1038/nclimate3240.
                                                                                                   Blaszczyk M, Jania JA and Hagen JO (2009) Tidewater glaciers of Svalbard:
          RCP 8.5) were performed and output for 2019–60 is compared
                                                                                                      recent changes and estimates of calving fluxes. Polish Polar Research 30, 85–
          against previously published results in Van Pelt and others                                 142.
          (2019) for the period 1957–2018. Meteorological input for the                            Bougamont M, Bamber JL and Greuell W (2005) A surface mass balance
          future simulations is constructed from a combination of long-                               model for the Greenland Ice Sheet. Journal of Geophysical Research: Earth
          term trends, extracted from a set of future RCM simulations,                                Surface 110(F04018), 1–13. doi: 10.1029/2005JF000348.
          and historical short-term variability.                                                   Cao Y and 5 others (2017) Enhanced wintertime greenhouse effect reinforcing
              We find that the average CMB for Svalbard glaciers, which was                           Arctic amplification and initial sea-ice melting. Scientific Reports 7(8462),
          weakly positive during 1957–2018, becomes negative at an accel-                             1–9. doi: 10.1038/s41598-017-08545-2.
          erating rate during 2019–60 for both scenarios. A major factor                           Christianson K, Kohler J, Alley RB, Nuth C and van Pelt WJJ (2015)
                                                                                                      Dynamic perennial firn aquifer on an Arctic glacier. Geophysical Research
          contributing to this mass loss acceleration is the ELA to lie at
                                                                                                      Letters 42, 1418–1426. doi: 10.1002/2014GL062806.
          or even above the peak elevation band in the glacier hypsometry,
                                                                                                   Cogley JG and 10 others (2001) Glossary of glacier mass balance. Technical
          which makes glacier CMB more sensitive to climate trends. This                              report, UNESCO-IHP. doi: 10.2172/776739.
          effect is most strongly seen in southern Svalbard, where the                             Day JJ, Bamber JL, Valdes PJ and Kohler J (2012) The impact of a seasonally
          model predicts the strongest ELA rise and where the hypsometry                              ice free Arctic Ocean on the temperature, precipitation and surface mass
          peak is most narrow. As a result of rising ELA, the AAR is                                  balance of Svalbard. The Cryosphere 6, 35–50. doi: 10.5194/tc-6-35-2012.
          expected to reach zero for the first time in the 2050s in northern                       Elsberg DH, Harrison WD, Echelmeyer KA and Krimmel RM (2001)
          Svalbard, while in southern Svalbard, zero AAR is predicted to                              Quantifying the effects of climate and surface change on glacier mass bal-
          occur already in the 2030s. This has a major impact on the                                  ance. Journal of Glaciology 47, 649–658. doi: 10.3189/172756501781831783.
          state of snow and firn; by 2060 the total snow and firn pore                             Førland EJ and 7 others (2020) Measured and modeled historical precipita-
                                                                                                      tion trends for Svalbard. Journal of Hydrometeorology 21(6), 1279–1296.
          space in the upper 12 m of the model is found to be reduced by
                                                                                                      doi: 10.1175/jhm-d-19-0252.1.
          70% (RCP 4.5) or 80% (RCP 8.5) relative to 2018, with the
                                                                                                   Fürst JJ and 25 others (2018) The ice-free topography of Svalbard.
          only significant remaining firn area to be found on                                         Geophysical Research Letters 45(21), 11,760–11,769. doi: 10.1029/
          Lomonosovfonna Ice Cap in central Svalbard. We further find                                 2018gl079734.
          that although annual refreezing in seasonal snow and firn remains                        Hansen BB and 8 others (2014) Warmer and wetter winters: characteristics and
          largely unchanged, its seasonal distribution changes markedly,                              implications of an extreme weather event in the High Arctic. Environmental
          with higher refreezing rates in winter and spring in connection                             Research Letters 9(11), 114021. doi: 10.1088/1748-9326/9/11/114021.

Downloaded from https://www.cambridge.org/core. 25 Nov 2021 at 23:32:30, subject to the Cambridge Core terms of use.
Journal of Glaciology 495
Hanssen-Bauer I and 5 others (2019) Climate in Svalbard 2100 – a knowledge Orlowsky B, Gerstengarbe FW and Werner PC (2007) A resampling scheme
base for climate adaptation. ISSN 2387-3027. for regional climate simulations and its performance compared to a dynam-
How P and 9 others (2017) Rapidly changing subglacial hydrological path- ical RCM. Theoretical and Applied Climatology 92, 209–223. doi: 10.1007/
ways at a tidewater glacier revealed through simultaneous observations of s00704-007-0352-y.
water pressure, supraglacial lakes, meltwater plumes and surface velocities. Østby TI and 5 others (2017) Diagnosing the decline in climatic mass balance
The Cryosphere 11, 2691–2710. doi: 10.5194/tc-11-2691-2017. of glaciers in Svalbard over 1957–2014. The Cryosphere 11, 191–215. doi: 10.
Huss M and Hock R (2015) A new model for global glacier change and sea-level 5194/tc-11-191-2017.
rise. Frontiers in Earth Science 3(54), 1–22. doi: 10.3389/feart.2015.00054. Pramanik A, Van Pelt WJJ, Kohler J and Schuler TV (2018) Simulating cli-
Huss M, Jouvet G, Farinotti D and Bauder A (2010) Future high-mountain matic mass balance, seasonal snow development and associated freshwater
hydrology: a new parameterization of glacier retreat. Hydrology and Earth runoff in the Kongsfjord basin, Svalbard (1980–2016). Journal of Glaciology
System Sciences 14(5), 815–829. doi: 10.5194/hess-14-815-2010. 64, 943–956. doi: 10.1017/jog.2018.80.
IPCC (2019) Summary for policy makers. In Pö rtner H.-O. Roberts D.C. Masson- Reistad M and 5 others (2011) A high-resolution hindcast of wind and waves
Delmotte V. Zhai P. Tignor M. Poloczanska E. Mintenbeck K. Alegría A. for the North Sea, the Norwegian Sea, and the Barents Sea. Journal of
Nicolai M. Okem A. Petzold J. Rama B. and Weyer N.M. eds. IPCC Special Geophysical Research 116(C5), 1–18. doi: 10.1029/2010JC006402.
Report on the Ocean and Cryosphere in a Changing Climate, In press. Schuler TV and 12 others (2020) Reconciling Svalbard glacier mass
Isaksen K and 5 others (2016) Recent warming on spitsbergen – influence of balance. Frontiers in Earth Science 8(156), 1–16. doi: 10.3389/feart.2020.
atmospheric circulation and sea ice cover. Journal of Geophysical Research: 00156.
Atmospheres 121(20), 11913–11931. doi: 10.1002/2016jd025606. Uppala SM and 45 others (2005) The ERA-40 re-analysis. Quarterly
Köhler A, Maupin V, Nuth C and van Pelt W (2019) Characterization of sea- Journal of the Royal Meteorological Society 131, 2961–3012. doi: 10.1256/
sonal glacial seismicity from a single-station on-ice record at Holtedahlfonna, qj.04.176.
Svalbard. Annals of Glaciology 60(79), 23–36. doi: 10.1017/aog.2019.15. Van Pelt WJJ and 5 others (2012) Simulating melt, runoff and refreezing on
König M, Nuth C, Kohler J, Moholdt G and Pettersen R (2014) A Digital Nordenskiöldbreen, Svalbard, using a coupled snow and energy balance
Glacier Database for Svalbard. In Kargel J et al., eds. Global Land Ice model. Cryosphere 6, 641–659. doi: 10.5194/tc-6-641-2012.
Measurements from Space. Berlin, Heidelberg: Springer Praxis Books. doi: Van Pelt WJJ and 6 others (2016a) Multidecadal climate and seasonal snow
10.1007/978-3-540-79818-7_10. conditions in Svalbard. Journal of Geophysical Research: Earth Surface 121
Kuipers Munneke P, Ligtenberg SRM, van den Broeke MR, van Angelen JH (11), 2100–2117. doi: 10.1002/2016JF003999.
and Forster RR (2014) Explaining the presence of perennial liquid water Van Pelt WJJ and 6 others (2018) Dynamic response of a High Arctic glacier
bodies in the firn of the Greenland Ice Sheet. Geophysical Research to melt and runoff variations. Geophysical Research Letters 45, 4917–4926.
Letters 41(2), 476–483. doi: 10.1002/2013gl058389. doi: 10.1029/2018GL077252.
Lang C, Fettweis X and Erpicum M (2015a) Future climate and surface mass Van Pelt W and 10 others (2019) A long-term dataset of climatic mass bal-
balance of Svalbard glaciers in an RCP8.5 climate scenario: a study with the ance, snow conditions, and runoff in Svalbard (1957–2018). The
regional climate model MAR forced by MIROC5. The Cryosphere 9, 945– Cryosphere 13, 2259–2280. doi: 10.5194/tc-13-2259-2019.
956. doi: 10.5194/tc-9-945-2015. Van Pelt WJJ and Kohler J (2015) Modelling the long-term mass balance and
Lang C, Fettweis X and Erpicum M (2015b) Stable climate and surface mass firn evolution of glaciers around Kongsfjorden, Svalbard. Journal of
balance in Svalbard over 1979–2013 despite the Arctic warming. The Glaciology 61, 731–744. doi: 10.3189/2015JoG14J223.
Cryosphere 9(1), 83–101. doi: 10.5194/tc-9-83-2015. Van Pelt WJJ, Pohjola VA and Reijmer CH (2016b) The changing impact of
Lutz J and Gerstengarbe FW (2014) Improving seasonal matching in the snow conditions and refreezing on the mass balance of an idealized Svalbard
STARS model by adaptation of the resampling technique. Theoretical and glacier. Frontiers in Earth Science 4(102). doi: 10.3389/feart.2016.00102.
Applied Climatology 120, 751–760. doi: 10.1007/s00704-014-1205-0. Van Pelt WJJ, Schuler TV, Pohjola VA and Pettersson R (2021) Accelerating
Marchenko S and 6 others (2017) Parameterizing deep water percolation future mass loss of Svalbard glaciers from a multi-model ensemble
improves subsurface temperature simulations by a multilayer firn model. [Dataset]. Zenodo. doi: 10.5281/zenodo.4442615.
Frontiers in Earth Science 5(16), 1–20. doi: 10.3389/feart.2017.00016. Vikhamar-Schuler D and 6 others (2016) Changes in winter warming events
Möller M and Kohler J (2018) Differing climatic mass balance evolution in the Nordic Arctic Region. Journal of Climate 29, 6223–6244. doi: 10.
across Svalbard glacier regions over 1900–2010. Frontiers in Earth Science 1175/jcli-d-15-0763.1.
6(128), 1–20. doi: 10.3389/feart.2018.00128. Westermann S, Boike J, Langer M, Schuler TV and Etzelmüller B (2011)
Noël B and 10 others (2020) Low elevation of Svalbard glaciers drives high mass Modeling the impact of wintertime rain events on the thermal regime of
loss variability. Nature Communications 11(4597), 1–8. doi: 10.1038/s41467- permafrost. The Cryosphere 5, 945–959. doi: 10.5194/tc-5-945-2011.
020-18356-1. Winsvold SH and 5 others (2018) Using SAR satellite data time series for
Norwegian Polar Institute (2014) Terrengmodell Svalbard (S0 Terrengmodell) regional glacier mapping. The Cryosphere 12, 867–890. doi: 10.5194/
[Data set]. Norwegian Polar Institute. doi: 10.21334/npolar.2014.dce53a47. tc-12-867-2018.
Downloaded from https://www.cambridge.org/core. 25 Nov 2021 at 23:32:30, subject to the Cambridge Core terms of use.496 Ward van Pelt and others
Appendix
See Figures 14–17.
Fig. 14. Spatial distribution of temperature trends (1988–2060) for five models in the Arctic CORDEX ensemble for the RCP 4.5 emission scenario. More details about
the RCMs and Arctic CORDEX can be found in Hanssen-Bauer and others (2019) or at http://climate-cryosphere.org/activities/polar-cordex/arctic. Model 1 =
CCCma-CanESM2_SMHI-RCA4_v1; Model 2 = ICHEC-EC-EARTH_SMHI-RCA4_v1; Model 3 = ICHEC-EC-EARTH_DMI-HIRHAM5_v1; Model 4 =
MPI-M-MPI-ESM-LR_SMHI-RCA4_v1; Model 5 = NCC-NorESM1-M_SMHI-RCA4_v1.
Downloaded from https://www.cambridge.org/core. 25 Nov 2021 at 23:32:30, subject to the Cambridge Core terms of use.Journal of Glaciology 497
Fig. 15. Spatial distribution of precipitation trends (1988–2060) for five models in the Arctic CORDEX ensemble for the RCP 4.5 emission scenario. Model 1 =
CCCma-CanESM2_SMHI-RCA4_v1; Model 2 = ICHEC-EC-EARTH_SMHI-RCA4_v1; Model 3 = ICHEC-EC-EARTH_DMI-HIRHAM5_v1; Model 4 =
MPI-M-MPI-ESM-LR_SMHI-RCA4_v1; Model 5 = NCC-NorESM1-M_SMHI-RCA4_v1.
Downloaded from https://www.cambridge.org/core. 25 Nov 2021 at 23:32:30, subject to the Cambridge Core terms of use.498 Ward van Pelt and others
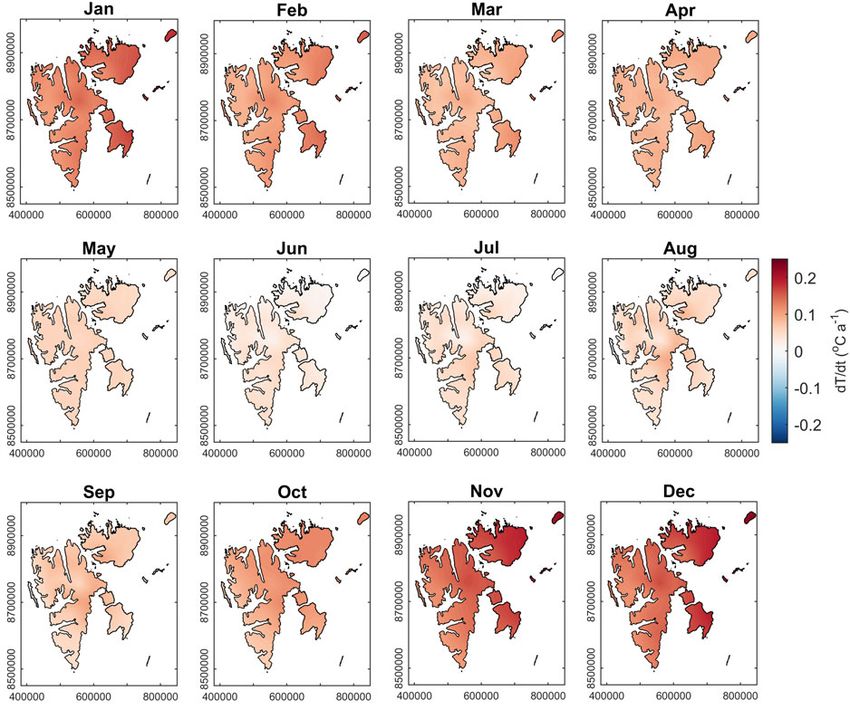
Fig. 16. Spatial distribution of RCP 4.5 temperature trends (1988–2060) for individual months.
Downloaded from https://www.cambridge.org/core. 25 Nov 2021 at 23:32:30, subject to the Cambridge Core terms of use.Journal of Glaciology 499
Fig. 17. Spatial distribution of RCP 4.5 precipitation trends (1988–2060) for individual months.
Downloaded from https://www.cambridge.org/core. 25 Nov 2021 at 23:32:30, subject to the Cambridge Core terms of use.You can also read