On the optimal layout of a dining room in the era of COVID-19 using mathematical optimization
←
→
Page content transcription
If your browser does not render page correctly, please read the page content below
On the optimal layout of a dining room in the era of
                                                COVID-19 using mathematical optimization
                                                                                              ∗(1)                        †(2)
                                                                       Claudio Contardo              and Luciano Costa
                                                                     (1)
                                                                      ESG UQAM and GERAD, Montreal, Canada.
                                                   (2)
                                                         Tecnology Department, Federal University of Pernambuco, Caruaru, Brazil.
arXiv:2108.04233v1 [cs.OH] 7 Aug 2021

                                                                                             Abstract

                                                      We consider the problem of maximizing the number of people that a dining room can accom-
                                                  modate provided that the chairs belonging to different tables are socially distant. We introduce
                                                  an optimization model that incorporates several characteristics of the problem, namely: the
                                                  type and size of surface of the dining room, the shapes and sizes of the tables, the positions of
                                                  the chairs, the sitting sense of the customers, and the possibility of adding space separators to
                                                  increase the capacity. We propose a simple yet general set-packing formulation for the problem.
                                                  We investigate the efficiency of space separators and the impact of considering the sitting sense
                                                  of customers in the room capacity. We also perform an algorithmic analysis of the model, and
                                                  assess its scalability to the problem size, the presence of (or lack thereof) room separators, and
                                                  the consideration of the sitting sense of customers.

                                        Keywords:            Social distancing, facility layout, COVID-19, integer programming.

                                        1        Introduction

                                        The current pandemic has posed major challenges to multiple economic sectors. In particular, the
                                        tourism sector is one of the most affected by the multiple restrictions imposed by health organi-
                                        zations and governments aiming at protecting the public from a rapid and uncontrolled spread of
                                        the disease known as COVID-19 [4]. Vaccination and social distancing are perhaps the two most
                                        efficient mechanisms to reduce the propagation of the disease. In the past few months, a global
                                        vaccination campaign has proven efficient at reducing its spread, but remains insufficient as an
                                        isolated mechanism to mitigate its impact.
                                           Chile is a remarkable example of such attempt. According to data from the Ministry of Health
                                        of Chile [11], even with vaccinations attaining global maximums in July/2021 (almost 75% of the
                                        population is fully vaccinated, meaning that they received either a single-dose vaccine, or the two
                                        doses of a two-dose vaccine), the spread of the disease did not decrease at the same pace. The
                                        rapid relaxation of social distancing measures by the local health authorities has been named as
                                        one of the main factors to explain a continuing increase in hospitalizations (Figure 1), despite the
                                            ∗
                                                C. Contardo: https://orcid.org/0000-0001-7595-3904 / claudio.contardo@gerad.ca
                                            †
                                                L. Costa: https://orcid.org/0000-0002-6324-6556 / luciano.ccosta@ufpe.br

                                                                                                     1
On the optimal layout of a dining room in the era of COVID-19 using mathematical optimization
success of the vaccination campaign (Figure 2). In certain countries, the lack of a strong vaccination
campaign or the resistance of the population to get vaccinated leaves social distancing as the main
mechanism to control the spread of the disease.
Figure 1: Comparison between the number of available and occupied hospital beds in Chile
Figure 2: Percentage of the target population that is fully vaccinated in Chile
Additionally, it has become apparent that the environmental conditions play a role in defining
social distancing rules. Cold and temperate climates are more favorable to the spread of the virus,
as compared to warmer climates [1]. Outdoors gatherings are also less favorable for the spread
capabilities of the virus as compared to indoors [10]. In this context, the presence or absence
of wind is also believed to be relevant in determining the spread capabilities of the virus [8]. In
closed areas, the ventilation capabilities of rooms seem to also correlate negatively with the spread
capabilities of the virus [3, 16].
In the presence of constraints arising from social distancing, finding the best disposition for
tables in the dining room of a restaurant can be a challenging task. In trying to satisfy social
distancing, restaurants may end by not efficiently using part of the available dining room area.
Think for instance of the case where a decision maker imposes a distance of two meters or more
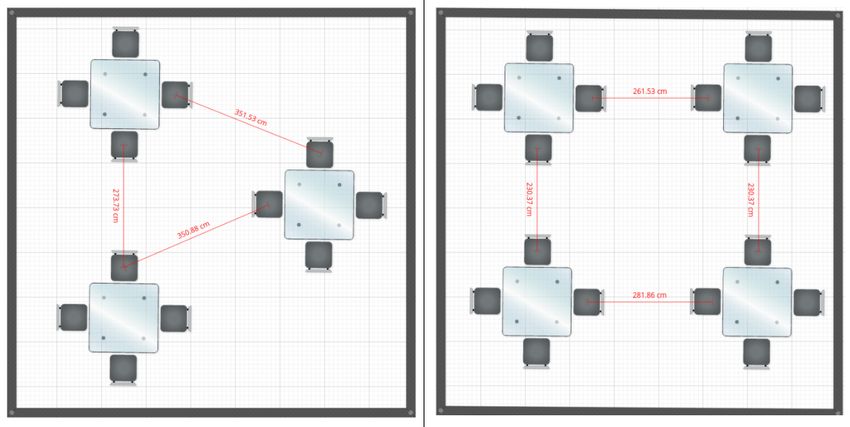
between any two chairs belonging to different tables. Figure 3 provides two examples of layouts
over the same area for which social distancing using this rule is respected, but for which in one of
them (left layout), the available area is not efficiently occupied.
In a small example, like the one presented in Figure 3, at a first glance, locating tables to sit as
many people as possible in the space available may seem easy. However, when we consider larger
areas, which might not always be defined over rectangular surfaces (Figure 4), and that sometimes
may present some physical obstacles (e.g. stairs and/or support columns), the task of positioning
tables adequately may become very difficult.
2On the optimal layout of a dining room in the era of COVID-19 using mathematical optimization
Figure 3: Example of tables layout
(a) Rectangular surface (b) Non-rectangular surface
Figure 4: Examples of surfaces
In the case where dining rooms layouts do not use all the available space, businesses may
experience a drastic reduction in their profit margins, which may cause them to possibly even going
bankrupt [4]. At the same time, restaurant owners cannot simply disregard safety measures in an
attempt to increase dining rooms capacities, as customers’ perception may be negative impacted
by crowded spaces, which may affect customers’ choice behavior [13]. Therefore, being capable of
efficiently positioning tables in a given area, or to adequately adopt safety measures is critical from
a business perspective. In this context, decision support systems based on optimization techniques
may arise as suitable tools to solve the problem of finding efficient layouts for restaurant dining
rooms, while still satisfying social distancing constraints. Optimization methods are capable of
efficiently tackling complex problems that are subject to different types of requirements such as the
ones emerging in times of COVID-19. As a matter of fact, recently, several optimization approaches
have been developed to help to cope with some of the new challenges imposed by the pandemic.
In this paper, we address the problem of designing optimal dining room layouts using mathe-
matical optimization. Our contribution is threefold. First, we present a simple yet very generic
optimization model to maximize the number of people that a dining room can accommodate. Our
model aims at finding the best way to place tables in a dining room by taking into account multiple
attributes relevant in practice: the configuration of tables, the presence of (or lack thereof) obsta-
cles, the shape of the dining room, and the sitting sense of the customers, all of which are fully
integrated in our model. Second, we perform a thorough computational analysis to understand the
impact of certain attributes —such as the sitting sense of customers, or the installation of plexiglass
divisions— in the room capacity. Third, in an attempt to contribute to the tourism sector in the
process of having to accommodate their dining rooms layouts during the current pandemic, we
provide an open-source Julia package for public download and use.
The remainder of the paper is structured as follows. In Section 2 we review the scientific
literature on the use of quantitative tools —with a particular emphasis on optimization— during
3On the optimal layout of a dining room in the era of COVID-19 using mathematical optimization
the current pandemic. In Section 3 we provide a detailed description of the problem and present the
proposed formulation. In Section 4, we generate instances for the problem, analyze the scalability
of our model, and provide some managerial insights. Finally, in Section 5, we present some final
remarks and draw some conclusions regarding the use of our approach in the context of COVID-19.
2 Literature review
In this section we review the scientific literature on recent attempts to use optimization and other
quantitative tools to help decision makers make better decisions during the current pandemic.
Duque et al. [7] introduce a mathematical model to allow policymakers make decisions regarding
when to relax and when to enforce social distancing in the city of Austin, USA. The model provides
optimal thresholds that, if attained, would serve as triggers to indicate when social distancing should
be relaxed or enforced. Even if social distancing is one of the most effective measures to slow down
the propagation of COVID-19, it may incur high costs for the society. In this context, the authors
claim that the thresholds in the model are established in such a way to minimize the number of
days in which (expensive) social distancing is required, while still guaranteeing that the capacity
of hospitals is not exceeded with hospitalized people.
Pacheco and Laguna [12] implement a Tabu Search heuristic to solve a routing problem arising
in the context of urgent delivery operations of face shields in the province of Burgos (Spain). In
the considered problem, vehicles and drivers are part of different volunteer organizations. For this
reason, routes may be open, i.e., they can start and end at different points. Routes in the problem
include delivering raw materials to produce the masks, collecting face shields, and delivering them to
the demand points. Given that drivers are volunteers, routes should be generated in such a way the
working time among them is as similar possible. Hence, the objective considered in the problem was
the minimization of the longest route generate. Despite simple, the proposed method contributed
significantly to the combat of the pandemic in the province. The routing system deployed has
allowed Burgos to have a relative number of face shields in comparison with the population of the
province of 10.5%, whereas in the rest of Spain this value was inferior to 1.5%.
Seccia [15] and Zucchi et al. [19] propose mathematical models to tackle the problem of finding
balanced personnel schedules in contexts where COVID-19 imposes additional constraints. Seccia
[15] solve a nurse rostering problem where the number of nurses is insufficient to meet the demand.
To face this problem, the model allows nurses to work more than one shift per day. Yet, to
reduce the psychological stress (in excess) to which nurses might be exposed, the model aims to
balance the overall number of working hours assigned to all nurses. Zucchi et al. [19] address a
personnel scheduling problem motivated by a real-life application found in an Italian pharmaceutical
distribution company. Before the pandemic, workers used to work in different sectors throughout
the working day. However, during the pandemic, in an attempt to reduce the risk of contagion,
the company has decided to define mutually exclusive groups of workers, who should always work
together. These groups are defined so as the total deviation between the total contractual hours
and the worked hours is the minimum possible.
Ugail et al. [17] propose a decision-support tool to enable the optimal configuration of a given
space in the presence of social distancing requirements. The authors model the problem of locating
a series of points in a two-dimensional region as a circle-packing problem [5]. The model is specific
to the region under consideration, leading to different models depending if the region is circular,
triangular, or rectangular, for instance, and therefore less susceptible to generalizations to arbitrary
4On the optimal layout of a dining room in the era of COVID-19 using mathematical optimization
areas. The authors show that their models can handle air flows as the ones induced by ventilation
systems with little effort, as well as the positions of windows and doors.
Fischetti et al. [9] present a mathematical model for the problem of fitting facilities (e.g., cus-
tomers and beach umbrellas) into a given area while respecting social distancing constraints. The
authors adopt a formulation initially proposed for farm layout optimization problems, in relying
on the similarity between both problems. The proposed model selects from a set of predefined po-
sitions the ones where facilities should be placed while ensuring a minimum distance between the
facilities and minimizing infection risk. In the study, the infection risk is assessed through different
exposure measures which are a function of the Euclidean distance. When considering two types of
areas – 1- and 2-dimensional areas –, exposure indicators defined as being inversely proportional
to the squared or the cubic power of the Euclidean distance yielded the most satisfactory layouts.
Despite representing a good alternative to tackle the problem of locating facilities in a given area,
the proposed methodology has two limitations that may result in solutions that do not use all the
available area. First, in the approach, the maximum number of facilities is a parameter of the
model, which may not be the largest possible, and hence may entail sub-optimal solutions. Second,
the method does not consider topology and physical characteristics of the different components of
the problem (tables sizes, sitting positions, sitting sense, surface topology). This aspect may be
very important in situations in which the available space is small, such as a restaurant dining room,
and we intend to use the available area to its extent.
Wang et al. [18] employ a DAST framework [14] to assess how environmental factors – crowd-
edness (numbers of persons in a service environment) and restaurant safety measures – affect cos-
tumers consume choices and their perceptions during the COVID-19 pandemic. In the study, USA
(country highly impacted by the COVID-19) and Australian (country known to have effectively
controlled the spread of the disease) residents were interviewed. The results have shown that US
residents are more sensitive to crowdedness, even moderate. According to the study, US residents
are less likely to eat in restaurants than Australians during the pandemic. This is probably due
to the low perceived severity of the pandemic in Australia. Regarding restaurant safety measures,
both Americans and Australians seem to prefer social distancing over the use of partition screens.
The latter may require an initial investment, thus, for the restaurant, it may be perceived as more
expensive. Moreover, this measure may reduce the flexibility of changing the setting of tables and
the restaurant layout. Yet, this approach allows restaurants to increase the capacity of their dining
rooms.
3 The proposed model
In this section, we describe how we model the problem of finding optimal layouts for dining rooms
as a set-packing problem while still assuring that social distancing constraints are satisfied. This
section is structured as follows. In Sub-section 3.1 we describe our modeling of the room topology,
including several features that are relevant in practice, such as the existence of (or lack thereof)
obstacles. In Sub-section 3.2, we detail how we encode into the variable definition of our formulation
the several characteristics (topology and physical aspects) associated with the surface over which we
intend to determine the optimal layout. In Sub-section 3.3, we present how we impose social distance
requirements in our model. Finally, in Sub-section 3.4, we present the set-packing formulation that
we adopt to solve our layout problem.
5On the optimal layout of a dining room in the era of COVID-19 using mathematical optimization
3.1 Room topology
We consider a discretization of a physical space in the form of a grid, which is not required to
be rectangular. Each block in the grid represents a position in the surface where we may (or not)
locate a table. Some blocks in the grid may be marked as soft obstacles, this is, objects that prevent
the location of tables, but do not stop the circulation of air particles through them (think of plants
or flowers, for instance). Some other blocks in the grid may be marked as hard obstacles which
not only prevent the location of tables but also the passing of air particles through them (think of
instance of plexiglass or other type of walls). In Figure 5, we depict an example of such grid, where
soft obstacles are marked in solid gray while hard obstacles are marked as thin dashed rectangles.
Figure 5: Surface with the representation of physical obstacles
3.2 Sitting configuration
We assume that each sitting configuration uses a certain number of blocks in that grid (the finer
the grid, the larger the number of blocks each sitting configuration will use), and are not allowed
to overlap with any type of obstacle. In Figure 6, we illustrate two possible sitting configurations:
1) a single square table capable of accommodating two persons sitting along a vertical orientation
axis; 2) two tables in a row, capable of accommodating four persons, who sit along a horizontal
orientation axis. Note that these two configurations are presented only for illustration purposes.
The model that we will present can handle arbitrary types of tables provided that they are defined
in advance.
⇓
⇒ ⇐
⇑
⇒ ⇐
Figure 6: Example of two sitting configurations
3.3 Social distancing restrictions
Similar to the strategy that we employ to model physical/topological aspects associated with the
surface over which we solve our problem, the approach that we adopt to impose social distancing
6On the optimal layout of a dining room in the era of COVID-19 using mathematical optimization
requirements in our model is also very generic. We represent distancing constraints by means of
a conflict graph. The representation that conflict graphs assume in our study is richer than that
found in Fischetti et al. [9]. In Fischetti et al.’s model, an edge in the conflict graph indicates
that two positions in an area are not located far enough from each other. In our case, edges in
the conflict graph correspond to incompatible sitting configurations. Two sitting configurations are
said to be compatible if:
1. they do not overlap; and
2. for every pair of chairs in different tables, either:
(a) they are more than two meters (equivalently six feet) distant from each other; or
(b) they are separated by a hard obstacle (a wall); or
(c) they are oriented back to back forming an angle of 180◦ [3].
Every pair of sitting configurations that do not comply with this condition is marked as incompati-
ble, meaning that the two sitting configurations cannot appear simultaneously in a feasible solution
of the problem.
3.4 Mathematical formulation
We now present a mathematical model to find the layout that maximizes the number of people that
the dining room can accommodate. Let G = (V, E) be the conflict (undirected) graph mentioned
in Section 3.3. The node set V corresponds to all possible sitting configurations in the grid.
The edge set E contains all possible pairs of possible sitting configurations that are not pairwise
compatible. For a given sitting configuration u ∈ V , let zu be a binary variable indicating whether
the configuration u is chosen, and let su be the number of persons it may accommodate. The
following set-packing problem maximizes the number of persons that may sit in the dining room:
X
max s u zu (1)
u∈V
subject to
zu + zv ≤ 1 {u, v} ∈ E (2)
zu ∈ {0, 1} u∈V (3)
The objective function (1) aims at maximizing the total number of persons sitting in the dining
room. Constraints (2) are pairwise conflict constraints enforcing that two incompatible sitting
configurations cannot be selected simultaneously in the solution. Finally, constraints (3) define the
domain of the variables.
4 Computational experiments
In this section we present a computational campaign aiming at: 1) analyzing the impact of two
attributes in the room capacity; and 2) analyzing the scalability of the model to some attributes
and parameters of the problem. In Sub-section 4.1, we describe the computational environment
7On the optimal layout of a dining room in the era of COVID-19 using mathematical optimization
used throughout our campaign. In Sub-section 4.2, we describe the problem instances used in our
experiments. In Sub-section 4.3 we describe four variants of our model that will help at assessing
its performance on a variety of scenarios. In Sub-section 4.4 we analyze the effect on the room
capacity of i) installing plexiglasss divisions, and ii) considering the sitting sense of customers in
the distancing requirement. In Sub-section 4.5, we present an algorithmic analysis of the scalability
of the proposed model.
4.1 Computational environment
We have implemented the proposed mathematical model using Julia 1.4 [2] with JuMP as mod-
eling language [6]. The implemented code has been made available at https://github.com/
lucianoccosta/OptimalDiningLayout.jl. We use CPLEX 12.10 as general-purpose MILP solver.
Our experiments have been executed on an Intel Xeon E5-2637 v2 @ 3.50 GHz with 128 GB of
RAM.
4.2 Proposed instances
To assess the applicability and the performance of our model, we propose grid instances with
rectangular-shaped areas like the one depicted in Figure 4a. We point out that our approach
can also handle non-rectangular-shaped areas such as the ones in Figure 4b. However, since the
conclusions drawn from some preliminary analyses are similar to those obtained for rectangular-
shaped areas, we limit our experiments to the solution of rectangular-shaped problems only.
As described in Section 3.1, we consider a discretization of the physical space. Hence, each
instance is associated with one grid. Each grid is composed of squares of 0.70 m × 0.70 m. The
choice for this value is due to the fact that 0.70 m is the typical size of the side of a restaurant
table. Hence, since we assume that tables occupy blocks of the grid (Section 3.2), we presume that
a square table (to sit two people) occupies one square of the grid, whereas a rectangular table (to
sit four people) occupies two squares (Figure 6). We generate six classes of square-shaped instances
n × n, which differ by the number n of squares on each side of the grid. The number of squares
considered in the instances are n ∈ {5, 10, 15, 20, 25, 30}. Each instance is denoted n n nowalls.
In our experiments, we assess the effect on the room capacity of installing plexiglass walls
(hard obstacles). To establish the location of the walls in the room, we consider two approaches:
1) locating the walls horizontally/vertically at random positions in the room (Figure 7a) and 2)
distributing the walls uniformly vertically (equivalent to locating them horizontally) throughout
the room (Figure 7b). To generate instances with plexiglass walls located at random, we proceed as
follows. For each instance class n × n, with n ∈ {10, 15, 20, 25, 30}, we generate w ∈ {5, 10, 15, 20}
plexiglass, with lengths 0.7t, t ∈ {1, 2, 3, 4}. Hence, by combining each possible value of w and
t, for each instance class, we can generate up to 16 different settings. To take advantage of the
randomness of our process, for each setting, we generate 100 instances. Therefore, in total, we
generate 1,600 instances. Each instance generated is denoted by n n t w id, with id being the
index of the instance. To decide where to locate a plexiglass wall, at first we randomly generate
a point (x1 , y1 ) located at the midpoint of one of the sides of a square in the grid. Then, to
generate the point where the other extremity of the plexiglass wall will be placed, we select an
angle θ ∈ {0, 0.5π, π, 1.5π} at random, and make (x2 , y2 ) = (x1 + 0.7t cos θ, y1 + 0.7t sin θ). If
(x2 , y2 ) is placed within the bounds of the dining room, we keep the plexiglass wall, otherwise, we
reject it and restart the process. We repeat the process until w plexiglass walls have been generated.
8On the optimal layout of a dining room in the era of COVID-19 using mathematical optimization
Figure 7: Examples of random and uniform plexiglass divisions
(a) Random placement (b) Uniform placement
Finally, we describe the procedure that we adopt to generate instances where plexiglass walls are
uniformly distributed throughout the room. Here, we do not control the number of walls that are
placed. For each instance class n×n, with n ∈ {10, 15, 20, 25, 30} and lengths 0.7t, t ∈ {1, 2, 3, 4}, we
try to place as many walls as possible, provided that both extremities of the segment corresponding
to the plexiglass wall are placed within the boundaries of the room, and that two segments are not
placed in neighbor grid blocks, otherwise, since tables are only placed in the blocks of the grid,
it would not be possible to place any table between two plexiglass walls. Moreover, as depicted
in Figure 7b, we leave an space of 0.7m (enough to place a table) between two rows of walls. As
described previously, we generate instances where plexiglass walls are placed leaving a room of
0.35m from the wall (Figure 7b). These problems are denoted n n uni t.
4.3 Model variants
Throughout or computational campaign and to support the different analysis regarding the effi-
ciency of our modeling approach, we consider the following four settings for our model:
Baseline no plexiglass divisions are used, and the sitting sense of the customers is ignored to relax
the distancing requirements,
Plexiglass plexiglass divisions are used, and the sitting sense of the customers is ignored to relax
the distancing requirements,
SittingSense no plexiglass divisions are used, and the sitting sense of the customers is considered
to relax the distancing requirements.
Plexiglass+SittingSense plexiglass divisions are used, and the sitting sense of the customers is
considered to relax the distancing requirements.
4.4 Two attributes that affect the room capacity
In this section, we assess the impact of two attributes in the room capacity: i) of installing plexiglass
divisions; and ii) of considering the sitting sense of the customers to relax the distancing constraint
when the sitting senses of two customers form an angle of 180◦ . For the sake of conciseness, we
limit our analysis to the problems of class 15 × 15, which are the largest problems that our model
can consistently solve with little computational effort.
9On the optimal layout of a dining room in the era of COVID-19 using mathematical optimization
In our first experiment, we analyze the impact of installing plexiglass divisions on a square area,
for different number and sizes of the plexiglass walls. In the case of the problem 15 15 nowalls,
the Baseline setting provides an optimal solution of 66 people sitting in the room. In the box plot
of Figure 8 we report, for each t ∈ {1, 2, 3, 4} an for every w ∈ {5, 10, 15, 20}, the median value
of the capacity, lower and upper quartiles, the minimum and maximum values, and the outliers
when considering our model with setting Plexiglass for the same problem. Let us recall that
100 different random placements are considered for each setting. We observe that the plexiglass
divisions are effective at increasing the capacity, as the median values range often between 70 and
78. However, when one looks at the bottom outliers, we also observe that a careless placement of
the divisions may result in no increase of the capacity at all. But also this plot suggests a positive
result, which is that a careful placement of the divisions may result in a substantial increase of the
room capacity (in this case, we observe an increase in the capacity of up to a 33% with respect to
the Baseline setting). We remark that in these problems, the walls have been placed at random,
which suggests that an even more careful placement of the divisions may result in an even higher
occupancy. This is a matter that definitely deserves further investigation. In Figure 9, we plot the
two optimal solutions provided by the Baseline and Plexiglass settings for this problem, the
former capable of sitting 66 people, while the latter attaining a maximum occupancy of 88 guests.
Figure 8: Capacity after installing plexiglass divisions on problem of size 15 × 15
In our second experiment we analyze the impact of considering the sitting sense of the customers
in the room capacity. For this, we consider settings Baseline and SittingSense on the same
problem of size 15 × 15. In Figure 10 we illustrate the optimal solution attained for the setting
SittingSense, which results in an optimal occupancy of 84 guests, comparable to the effect of
installing the plexiglass divisions. This is more than a 27% larger than the maximum occupancy
attained in the Baseline regime.
Our third experiment aims at combining the installation of plexiglass divisions and the consid-
eration of the sitting sense of customers in the distancing requirements to assess if the maximum
occupancy can be increased further. We consider then the setting Plexiglas+SittingSense and
compare it against the Plexiglass and the SittingSense variants. Figure 11 reports a box plot of
the occupancy attained for the various random placements of the divisions. The result of combining
these two features make the occupancy less sensitive to the location of the plexiglass divisions, and
produces an increase in the medians that now range between 84 and 88. The maximum, however,
is attained for the largest number and size of walls, of value 96. This is more than a 9% superior
10On the optimal layout of a dining room in the era of COVID-19 using mathematical optimization
Figure 9: Different layouts produced by the Baseline vs Plexiglass settings
(a) Baseline – Instance 15 15 (b) Best layout by Plexiglass – Instance 15 15
Figure 10: SittingSense – Instance 15 15
to the largest occupancy achieved by the Plexiglass and SittingSense settings separately. This
shows that it is indeed relevant to consider these two features simultaneously when designing the
layout of restaurant dining rooms. In Figure 12 we plot the best possible layout (of value 96) found
by the Plexiglass+SittingSense variant of the problem.
Our last experiment in this section aims at motivating further studies in the problem of locating
plexiglass divisions. We consider the problem resulting from locating five plexiglasss divisions on
four rows each, for a total of 20 plexiglass divisions, on a grid of size 15 × 15, using the uniform
11On the optimal layout of a dining room in the era of COVID-19 using mathematical optimization
Figure 11: Plexiglass+SittingSense
Figure 12: Best layout found by Plexiglas+SittingSense – Instance 15 15
12On the optimal layout of a dining room in the era of COVID-19 using mathematical optimization
distribution of walls as described in Section 4.2. One would expect that, because of being more
uniformly distributed, they would entail better occupancies than the problems in which divisions are
randomly placed. The truth is, this is only true on average, but the best possible random placement
results in a better occupancy than the one obtained from the uniform placement. The former attains
maximums of 88 and 96, respectively for the settings Plexiglass and Plexiglass+SittingSense,
while the latter attains occupancies of 84 and 92 guests for the same settings. This does not
mean that the random placement is always better, as these comparisons are only valid for the best
solution found among all possible random placements, but suggests that the subject of locating
plexiglass divisions in the best optimal way is not as simple as following an uniform placement as
the one described in Section 4.2.
4.5 Scalability of the model
In this section, we analyze the scalability of the proposed model to three features, namely: 1) the
size of the grid; 2) the presence or absence of plexiglass divisions; and 3) to the consideration of
(or lack thereof) the sitting sense of customers in the scalability of our model.
Tables 1 and 2 show the performance of the model when solving problems representing rooms
with no plexiglass divisions. We compare the impact of taking into account the sitting sense of the
customers. For this, we consider the model settings Baseline and SittingSense. The results are
presented in Tables 1 and 2. For each problem, we provide the number of rows and columns in the
grid (# rows grid and # cols grid), the number of persons sitting in the room (# persons),
the CPU time required to solve the model (T(s)), and the number of variables and constraints (#
vars and # edges) in the corresponding model. The information of these two last columns gives
us an idea about the size of the conflict graph associated with the problem.
Regarding the results, as one might expect, the setting SittingSense allows more people to be
placed in each room. Moreover, allowing people to sit closer to each other yields a smaller conflict
graph, which is due to the smaller number of incompatibilities. This aspect impacts the CPU time
required to solve each problem. The model that is solved over the conflict graph associated with
SittingSense was capable of solving all the instances in less than 4 min. In turn, the model arising
from Baseline required almost 15h of computing time for a grid of 20 rows and 20 columns, and
was uncapable of handling the problem of size 30 × 30. In addition, we also observe that the grid
size substantially affects the computing times for the Baseline model as we perceive an increase
of orders of magnitude in the computing times when passing from a grid of size 15 × 15 to one of
size 20 × 20. This sensitivity is substantially reduced when one considers the sitting sense of the
customers in the modeling.
Table 1: Results obtained by considering SittingSense
Instance name # rows grid # cols grid # persons T(s) # vars # edges
5 5 nowalls 5 5 12 0.4 90 2,997
10 10 nowalls 10 10 48 0.5 380 19,902
15 15 nowalls 15 15 84 1.8 870 51,557
20 20 nowalls 20 20 144 197.5 1,560 97,962
25 25 nowalls 25 25 234 10.0 2,450 159,117
30 30 nowalls 30 30 328 50.6 3,540 235,022
The bar plot depicted in Figure 13 reports the computing times (in seconds) required by our
algorithm to solve the model associated with the problem setting Plexiglass. Please recall that
13On the optimal layout of a dining room in the era of COVID-19 using mathematical optimization
Table 2: Results obtained by considering Baseline
Instance name # rows grid # cols grid # persons T(s) # vars # edges
5 5 nowalls 5 5 12 0.2 90 3,281
10 10 nowalls 10 10 36 0.5 380 22,576
15 15 nowalls 15 15 66 12.2 870 59,021
20 20 nowalls 20 20 114 53538.6 1,560 112,616
25 25 nowalls 25 25 182 52833.7 2,450 183,361
30 30 nowalls 30 30 256 86405.7∗ 3,540 271,256
∗
Instance R 30 30 0 0 nowalls 1 could not be solved within the time limit of 24h.
Figure 13: Average computing times for Plexiglass
6
4
2
0
rd 1 5
rd 1 10
rd 1 15
rd 1 20
rd 2 5
rd 2 10
rd 2 15
rd 2 20
rd 3 5
rd 3 10
rd 3 15
rd 3 20
rd 4 5
rd 4 10
rd 4 15
rd 4 20
the computing time taken by the Baseline setting for this instance was of 12.2 seconds. In this
bar plot, we observe that the average times of all different configurations require between two and
six seconds. The computing times are lower, but of the same order of magnitude than those taken
by the Baseline model.
5 Conclusions
We have introduced a mathematical modeling for the problem of designing the optimal layout of a
restaurant dining room under several attributes relevant in practice, such as the arbitrary topology
of the dining room, an arbitrary configuration of the tables, the sitting sense of customers, and the
presence of (or lack thereof) plexiglass divisions. The model introduced is extremely simple, as it
relies on some basic concepts from the mathematical optimization literature. Therefore, it can be
easily implemented and adapted to other settings. Our model was capable of handling quite large
problems, on grids of up to 30 × 30 squares, within low computing times provided that the sitting
sense of the customers was not ignored.
We have also performed two types of analysis, one aiming at assessing the impact of some of the
attributes in the room capacity, and another aiming at assessing the computational behavior of our
model. Our findings suggest that the installation of plexiglass divisions and the consideration of
the sitting sense of customers explicitly in the modeling can entail increases of more than a 30% of
14On the optimal layout of a dining room in the era of COVID-19 using mathematical optimization
the capacity of the dining room. Moreover, both attributes, when considered simultaneously, can
help at increasing the room capacity even further. Our analysis also allowed us to conclude that an
uniform placement of the plexiglass divisions is not necessarily optimal, leaving room for a future
study on the optimal placement of plexiglass divisions. From the computational standpoint, we
have showed that our model scales well when plexiglass divisions and when the sitting sense of the
customers are explicitly considered, as opposed to a baseline variant of our model in which those
attributes are not present, and where our model’s scalability is much worse.
Acknowledgments
This work was supported by the Natural Sciences and Engineering Research Council (NSERC) of
Canada [Discovery grant 2020-06311]. This support is gratefully acknowledged.
References
[1] Araujo, M.B., Naimi, B., 2020. Spread of SARS-CoV-2 coronavirus likely to be constrained
by climate. medRxiv .
[2] Bezanson, J., Edelman, A., Karpinski, S., Shah, V.B., 2017. Julia: A fresh approach to
numerical computing. SIAM Review 59, 65–98.
[3] Dbouk, T., Drikakis, D., 2020. On coughing and airborne droplet transmission to humans.
Physics of Fluids 32, 053310.
[4] Dube, K., Nhamo, G., Chikodzi, D., 2021. COVID-19 cripples global restaurant and hospitality
industry. Current Issues in Tourism 24, 1487–1490.
[5] Dubejko, T., Stephenson, K., 1995. Circle packing: Experiments in discrete analytic function
theory. Discrete & Computational Geometry 22, 19–39.
[6] Dunning, I., Huchette, J., Lubin, M., 2017. JuMP: A modeling language for mathematical
optimization. SIAM Review 59, 295–320.
[7] Duque, D., Morton, D.P., Singh, B., Du, Z., Pasco, R., Meyers, L.A., 2020. Timing social
distancing to avert unmanageable COVID-19 hospital surges. Proceedings of the National
Academy of Sciences of the United States of America 117, 19873–19878.
[8] Feng, Y., Marchal, T., Sperry, T., Yi, H., 2020. Influence of wind and relative humidity on
the social distancing effectiveness to prevent COVID-19 airborne transmission: A numerical
study. Journal of Aerosol Science , 1–19.
[9] Fischetti, M., Fischetti, M., Stoustrup, J., 2021. Safe distancing in the time of COVID-19.
European Journal of Operational Research , 1–25.
[10] Freeman, S., Eykelbosh, A., 2020. COVID-19 and outdoor safety: Considerations for use of
outdoor recreational spaces. National Collaborating Centre for Environmental Health .
[11] Ministry of Health of Chile, 2021. URL: https://www.gob.cl/coronavirus/
cifrasoficiales/. accessed at July 21, 2021.
15On the optimal layout of a dining room in the era of COVID-19 using mathematical optimization
[12] Pacheco, J., Laguna, M., 2020. Vehicle routing for the urgent delivery of face shields during
the COVID-19 pandemic. Journal of Heuristics 26, 619–635.
[13] Park, I.J., Kim, J., Kim, S.S., Lee, J.C., Giroux, M., 2021. Impact of the COVID-
19 pandemic on travelers’ preference for crowded versus non-crowded options. Tourism
Management 87, 104398. URL: https://www.sciencedirect.com/science/article/pii/
S0261517721001175, doi:https://doi.org/10.1016/j.tourman.2021.104398.
[14] Roggeveen, A.L., Grewal, D., Schweiger, E.B., 2020. The DAST Framework for Retail Atmo-
spherics: The Impact of In- and Out-of-Store Retail Journey Touchpoints on the Customer
Experience. Journal of Retailing 96, 128–137. Understanding Retail Experiences and Customer
Journey Management.
[15] Seccia, R., 2020. The Nurse Rostering Problem in COVID-19 emergency scenario. URL:
http://www.optimization-online.org/DB_FILE/2020/03/7712.pdf.
[16] Somsen, G.A., van Rijn, C., Kooij, S., Bem, R.A., Bonn, D., 2020. Small droplet aerosols in
poorly ventilated spaces and SARS-CoV-2 transmission. The Lancet. Respiratory Medicine .
[17] Ugail, H., Aggarwal, R., Iglesias, A., Howard, N., Campuzano, A., Suárez, P., Maqsood,
M., Aadil, F., Mehmood, I., Gleghorn, S., Taif, K., Kadry, S., Muhammad, K., 2021. Social
distancing enhanced automated optimal design of physical spaces in the wake of the COVID-19
pandemic. Sustainable Cities and Society 68.
[18] Wang, D., Yao, J., Martin, B.A., 2021. The effects of crowdedness and safety measures
on restaurant patronage choices and perceptions in the COVID-19 pandemic. International
Journal of Hospitality Management 95, 102910.
[19] Zucchi, G., Iori, M., Subramanian, A., 2021. Personnel scheduling during COVID-19 pandemic.
Optimization Letters 15, 1385–1396.
16You can also read