Mediterranean Marine Science - eJournals
←
→
Page content transcription
If your browser does not render page correctly, please read the page content below
Mediterranean Marine Science

Vol. 19, 2018

                                                                       Spatial distribution of suspended solids during
                                                                     short-term high river discharge in the Bay of Koper,
                                                                                    northern Adriatic Sea

                                                                     SOCZKA MANDAC ROK           Harpha sea, d.o.o. Koper
                                                                     ŽAGAR DUŠAN                 University of Ljubljana,
                                                                                                 Faculty of civil and geodetic
                                                                                                 engineering,
                                                                     https://doi.org/10.12681/mms.2141

                   Copyright © 2018

 To cite this article:

 SOCZKA MANDAC, R., & ŽAGAR, D. (2018). Spatial distribution of suspended solids during short-term high river
 discharge in the Bay of Koper, northern Adriatic Sea. Mediterranean Marine Science, 19(1), 36-47.
 doi:https://doi.org/10.12681/mms.2141

                          http://epublishing.ekt.gr | e-Publisher: EKT | Downloaded at 20/03/2020 05:25:56 |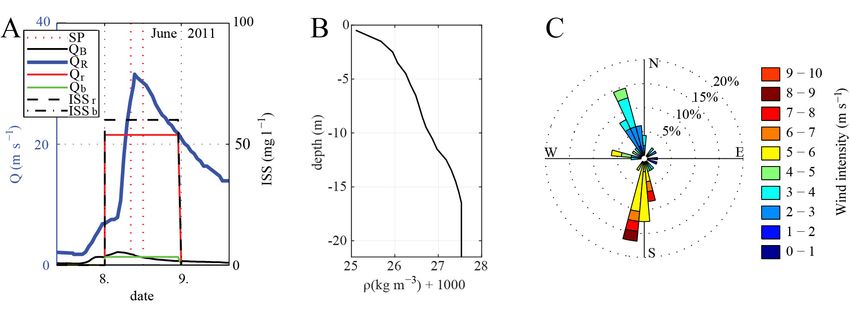
Research Article
Mediterranean Marine Science
Indexed in WoS (Web of Science, ISI Thomson) and SCOPUS
The journal is available online at http://www.medit-mar-sc.net
DOI: http://dx.doi.org/10.12681/mms.2141

          Spatial Distribution of Suspended Solids During Short-Term High River Discharge
                              in the Bay of Koper, Northern Adriatic Sea

                                          ROK SOCZKA MANDAC1 and DUŠAN ŽAGAR2
                                       1
                                         Harpha sea, d.o.o. Koper, Čevljarska ulica 8, 6000 Koper, Slovenia
                      2
                          Faculty of Civil and Geodetic Engineering, University of Ljubljana, Jamova cesta 2, p.p. 3422,
                                                            1000 Ljubljana, Slovenia

                                                    Corresponding author: rok@harphasea.si
                                                    Handling Editor: Aristomenis Karageorgis

                              Received: 4 April 2017; Accepted: 9 December 2017; Published on line: 26 April 2018

Abstract
The Bay of Koper located in the Gulf of Trieste (northern Adriatic Sea) is subject to a variety of anthropogenic influences; pollut-
ants from inland are transported to the sea by local rivers. The impact of high river discharge on suspended solids distribution was
assessed by analysing the results of an extensive measurement campaign conducted during two episodes of river flooding. The
spatial analysis indicated the area influenced by fresh water and the distribution of inorganic suspended solids (ISS). The results
were used to calibrate the PCFLOW3D model and to simulate two episodes. Statistical analyses confirmed significant agreement
between the measurements and short-term simulations in the bay. The results suggest the methods and the model used in this study
are appropriate for studying suspended solids processes in coastal areas.

Keywords: River plume, spatial distribution, inorganic suspended solids, PCFLOW3D model, Bay of Koper, northern Adriatic
Sea.

Introduction                                                              Biology Station – National Institute of Biology (MBS –
                                                                          NIB) within the programme of the Barcelona Convention
    In estuarine and coastal environments of the Gulf of                  (Turk et al., 2011; Turk et al., 2012; Turk et al., 2013;
Trieste, river inflows significantly impact thermohaline                  Turk et al., 2014), the Rižana river was mentioned as an
properties, as well as the transport and distribution of flu-             important source of inland pollutants.
vial suspended solids (Faganeli & Turk, 1989; Covelli et                      Due to the highly variable discharge (and impact)
al., 2007). The freshwater impact on salinity is mostly                   of the Rižana river, water quality monitoring at a single
noted through density currents in the sea surface layer,                  sampling site on a monthly basis performed by MBP
while the suspended solids affect turbidity in the water                  – NIB (Turk et al., 2011; Turk et al., 2012; Turk et al.,
column. High turbidity is considered a stress factor for                  2013; Turk et al., 2014) is insufficient for evaluating the
benthic organisms (Orpin et al., 2004). Furthermore, the                  influence of the river inflow in such a wide-open bay. On
suspended matter brought into the sea, can, when set-                     the other hand, uncertain weather forecasts and river dis-
tled to the bottom, destabilize the substrate and bury the                charge rate oscillation as well as the sea conditions during
benthos (Wolanski, 2007). Numerous authors (Stone &                       river floods limit the possibilities of extended measure-
Droppo, 1994; Covelli et al., 2007) have identified sus-                  ments campaigns in conditions with the highest sediment
pended solids as the transport mechanism for nutrients                    inflow. Recently, a two-year campaign of extended spa-
and pollutants through adsorption and flocculation. The                   tial surveys was performed in the Bay of Koper (Soczka
river Rižana is the main source of fluvial water and sed-                 Mandac et al., 2014), which revealed the spatio-temporal
iment for the Bay of Koper (Faganeli and Turk, 1989),                     influence of the Rižana and Badaševica rivers at vari-
the easternmost part of the Gulf of Trieste in the north-                 ous discharge rates. Total suspended solids distribution
ern Adriatic Sea (Ogorelec et al., 1987). Pollutants from                 and deposition rate were addressed (Soczka Mandac &
industry and the densely inhabited inland area are also                   Faganeli, 2015). Unfortunately, even such an extended
transported by the river Badaševica (Lipej et al., 2006).                 measurement strategy did not satisfy the need for infor-
The selected study site is subject to high anthropogen-                   mation at the studied site, particularly during events of
ic pressure (Orlando Bonaca et al., 2008), visible in the                 short duration (river plumes).
heavily modified coast and river estuary (Ogorelec et                         Sediment transport modelling in the wider area was
al., 1987). In recent reports on monitoring water qual-                   addressed by using Princeton Ocean Model (POM)-based
ity and pollution from inland conducted by the Marine                     models in the Adriatic Sea (Wang et al., 2007) and in the

Medit. Mar. Sci., 19/1, 2018, pp-pp                                                                                                   1

                      http://epublishing.ekt.gr | e-Publisher: EKT | Downloaded at 20/03/2020 05:25:56 |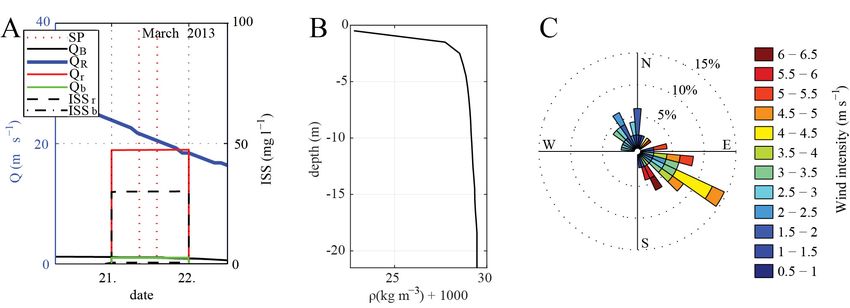
Gulf of Trieste (Malačič & Petelin, 2006). In the Bay of 2. Calibration and validation of the PCFLOW3D mod-
Koper these processes were simulated using various mod- el by comparing the results to an extended set of in
els (Malačič et al., 2009; Malačič et al., 2010; Žagar et situ measured data.
al., 2012); however, none of the models was adequately 3. Analysis of spatial distribution of inorganic sus-
calibrated or validated using measured data from the en- pended solids (ISS) during high river discharge
tire modelling domain. Furthermore, the impact of wind events simulated by the sediment transport module
and navigation on resuspension was studied, but none of of the PCFLOW3D model.
the previous studies in the Bay of Koper included the in-
fluence of the rivers Rižana and Badaševica, which un- Materials and Methods
doubtedly affected the obtained results. Previous numeri-
cal modelling of particle bound pollutants in the area was Site description
limited to mercury pollution caused by the Soča/Isonzo
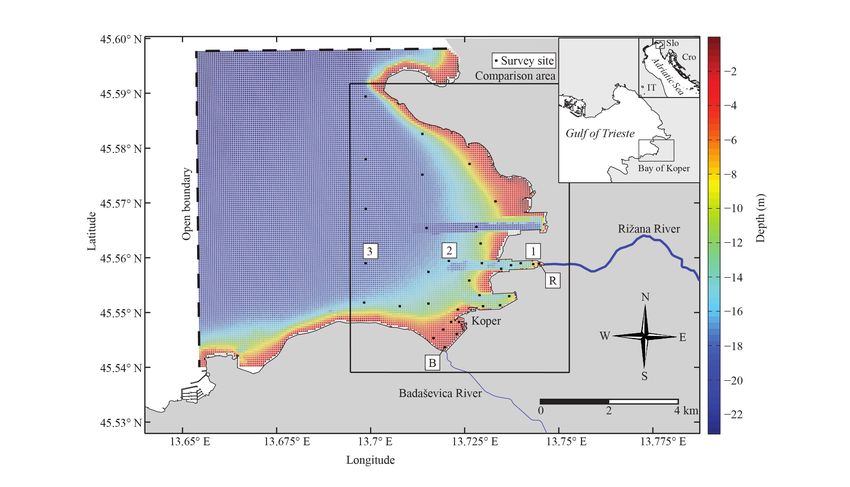
River inflow (Rajar et al., 2000; Žagar et al., 1999) and The Bay of Koper (BoK) is a wide open bay with an
mostly performed in relatively coarse resolution with- average depth of 16 m, covering about 35 km2 (Ogorelec
in the modelling studies of the Gulf of Trieste (Rajar et al., 1987). The depth decreases linearly from 23 m at
et al., 2000). Data from recent measurements (Soczka the western open boundary to 1 m in the coastal zone.
Mandac et al., 2014; Soczka Mandac & Faganeli, 2015) Three dredged canals (average depth 16 m) intended for
should, however, represent a satisfactory and represent- maritime traffic connect the open part of the bay to the
ative source for calibration and evaluation of the model port basins. Circulation is mainly forced by tide (range
PCFLOW3D, which has been used in several previous of ±0.6 m) and wind, in particular the easterly Bora wind
modelling studies within the Mediterranean Sea (Rajar et (Malačič et al., 2014). The mouth of the Rižana river is
al., 2004b; Žagar et al., 2007 and the references therein). located at the east side of the bay in the second port basin
Such a procedure is fundamental for development of ad- (port of Koper), while the first port basin (the southern-
equate modelling tools that can be used for simulation of most of the three basins) is situated in the vicinity of the
episodic events (e.g., high river discharges). Therefore, town of Koper (Fig. 1).
the main aims of the present study were: The Rižana is a small river with a variable mean flow
rate of 4 m3 s-1. The river estuary is highly stratified with
1. Spatial analysis of inorganic suspended solid con- a short mean fresh water replacement time of less than 1
centrations within two episodes of high river dis- day (Faganeli & Turk, 1989). A discharge from Koper’s
charge. municipal waste water treatment plant is located ~400
Fig. 1: Bay of Koper situated in the Gulf of Trieste (northern Adriatic Sea). The PCFLOW3D model grid in 40×40 m resolution
with the related bathymetry. The rectangle depicts the area with three comparison profiles P1, P2 and P3. The dashed lines indicate
the open boundaries.
37 Medit. Mar. Sci., 19/1, 2018, pp-pp
http://epublishing.ekt.gr | e-Publisher: EKT | Downloaded at 20/03/2020 05:25:56 |
m west, upriver, from the mouth. Spatial distribution of In the horizontal plane the DIVA (Data-interpolating
fluvial water and particulate suspended matter (turbidi- Variational Analysis) interpolation (Troupin et al., 2012)
ty) in the BoK is affected by various factors, primarily was used to provide spatial grid maps of variables at the
by wind (meteorological) and river discharge rate (hy- sea surface and estimated error in a grid of 560×403 cells
drological), as well as maritime traffic (Ogorelec et al., with ~10×10 m cell resolution. The average error calcu-
1987; Malačič et al., 2014). The Slovenian Environment lated from the obtained maps, was estimated at ~20%,
Agency (ARSO) records the hydrological and meteoro- which was found to be acceptable with regard to the dis-
logical data. The flow rate of Rižana river has been mon- tance between the measurement sites and to the adopted
itored since 1966 at the gauge station Kubed (located 13 interpolation method (Soczka Mandac & Faganeli, 2015).
km upstream from the river mouth), and that of the river The highest discrepancies were evident in the third basin
Badaševica at Šalara (located 3.2 km upstream from the (the northernmost part of the port, Fig. 1), where meas-
river mouth) (ARSO, 2014a). Other freshwater inputs to urements were omitted due to restricted access.
the BoK are storm water runoffs located around the bay,
which were not included in the study. The meteorological The PCFLOW3D model
data was measured in the port zone (at height 2 m) by the
ARSO meteorological station (ARSO, 2014b). The PCFLOW3D model and its modules have been
described in numerous publications. The model was used
In Situ measurements and sampling for computation of circulation, transport of dissolved and
particulate pollutants, and basic mercury transformations
Twenty-eight campaigns were performed at 34 sites in the northern Adriatic Sea, the entire Mediterranean
in the BoK (Fig. 1) between June 2011 and June 2013 in and Minamata Bay (Četina, 1992; Rajar & Četina, 1997;
monthly intervals during periods of low maritime traffic Četina et al., 2000; Rajar et al., 2000; Rajar et al., 2004;
(Soczka Mandac et al., 2014). The water column was pro- Kovšca, 2007; Žagar et al., 2007). Simulations of sedi-
filed using a conductivity, temperature and depth (CTD) ment re-suspension, transport and deposition were also
probe (Hydrolab datasonde model 4a) with an optical tur- carried out using the model (Žagar, 1999; Rajar et al.,
bidity sensor (ISO 7027 compliant), which measures the 2000). A study of circulation and environmental condi-
light back scatters at a wave length of 860 nm ±10 nm. tions in the Bay of Koper and the port of Koper (Malačič
The probe was lowered manually from the water surface et al., 2009; Malačič et al., 2010; Žagar et al., 2012, Žagar
to the sea bed, recording temperature, conductivity and et al., 2014) employed the PCFLOW3D and ECOMSED
turbidity at the rate of 1 Hz. All variables were averaged models to simulate the sediment resuspension due to the
vertically in 0.5 m intervals. Bora wind and navigation in the vicinity of the port.
Water samples for total suspended solids (TSS) were The PCFLOW3D model is a non-steady state 3D hy-
collected at the surface (0.5 m deep) at 19 sampling sites drodynamic baroclinic z-coordinate numerical model.
in the bay and at sites near the Rižana and Badaševica riv- It consists of hydrodynamic, transport-dispersion, sedi-
er mouths using 10 l Niskin samplers. The water samples ment-transport and biogeochemical modules and can be
(1 l) were immediately stored in polyethylene bottles at 5 used for simulations of circulation, transport and dis-
°C and filtered within four hours. One litre of water sam- persion of dissolved and particle bound pollutants, and
ple was filtered through a pre-weighed 47 mm diameter mercury transformation simulations in an aquatic envi-
Whatman GF/F glass-fibre filter with approximately 0.7 ronment. A detailed description of the structure and func-
μm pores pre-ignited at 480 ºC for 3 hours. The filters with tionality of the PCFLOW3D model is given in the litera-
particles were washed several times with MiliQ water to ture (Rajar & Četina, 1997; Četina et al., 2000; Žagar et
remove salt and dried at 60 ºC in an oven (Aurodent typ al., 2007). In the present study we adopted the Smago-
830 nf). They were freeze-dried and the net weight (TSS) rinsky turbulence models in both horizontal and vertical
was recorded. For suspended organic matter (SOM) anal- directions, as described in Kovšca (2007). The equations
ysis, the filters were successively ignited in an oven (Au- for horizontal and vertical coefficients of turbulent vis-
rodent typ 830 nf) at 480 °C for 4 h and weighed. The cosity (and turbulent diffusion, taking into account an ap-
difference between TSS and residue following ignition propriate Prandtl-Schmidt number) are as follows:
was noted as SOM. Inorganic suspended solids (ISS) de-
scribed in equation (1) represent the difference between ∂u 1 ∂u ∂v ∂v
2 2 2
1
2
TSS and SOM. The acquired regression model between N h CsmaH ∆x∆y + + +
=
∂x 2 ∂y ∂x ∂y
NTU and TSS is described in detail in Soczka Mandac &
Faganeli (2015); the relation (Eq. 1) was obtained from 1
∂u 1 ∂u
2 2
2
measurements and sampling campaigns conducted dur- N= CsmaV ∆x∆z +
v, x 2 ∂z
ing low and high river discharge at numerous sampling ∂x
sites within the Bay of Koper. 1
∂v 2 1 ∂v 2 2
N= CsmaV ∆y∆z +
v, y
ISS =0.87 × NTU + 0.12 ∂y 2 ∂z
Medit. Mar. Sci., 19/1, 2018, pp-pp 38
http://epublishing.ekt.gr | e-Publisher: EKT | Downloaded at 20/03/2020 05:25:56 |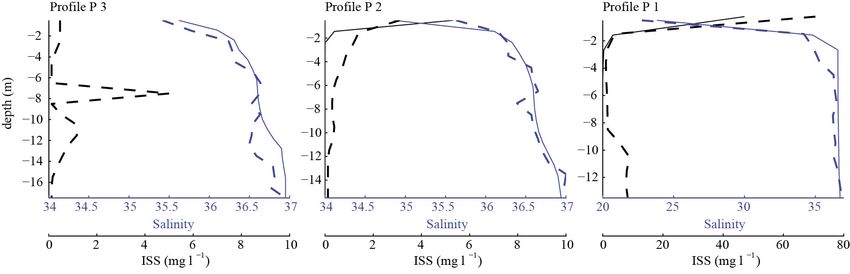
The topography and bathymetry of the BoK (Fig. 1)                    Short-term simulations (24 h) were performed for two
were described using a rectangular 183×158 grid with                events with relatively high river discharge (8th June 2011
40×40 m resolution in the horizontal plane, while in the            and 21st March 2013). The daily mean river discharges
vertical direction the domain was divided into 22 lay-              Rižana – Qr and Badaševica – Qb (Hydrological data in
ers with equal thicknesses of 1 m. The influence of tide            Table 1) were calculated from data measured by the Slo-
was not taken into account; all simulations of sediment             venian Environment Agency at stations Kubed 2 (Riža-
transport were performed in 24-hour intervals, which cor-           na – QR) and Šalara (Badaševica – QB) (ARSO, 2014a),
respond approximately to a full diurnal tidal cycle. We             and used in the simulations. Wind speed and direction
adopted the clamped open-boundary condition (OBC) at                (ARSO, 2014b) in the performed simulations were aver-
both open boundaries.                                               aged over 24-hour intervals (meteorological data in Table
                                                                    1) and used as constant in time and uniformly distributed
Model input data                                                    over the bay. Measured riverine temperature (T), salinity
                                                                    (S) and turbidity data (concentration of TSS - inorganic)
    In the present study the PCFLOW3D model simula-                 from sampling sites R and B (Fig. 1 and Table 1) were
tions were performed using seasonal and peak river in-              also used in simulations.
puts of the Rižana and Badaševica rivers and calibrated                 During the first event, Rižana river discharge rate
for two high river discharge events. Furthermore, the               (Fig. 2A) showed a rapid increase of river discharge
results were validated according to seasonal salinity and           with a peak QR = 31.1 m3 s-1 between 8th and 9th June
turbidity data obtained from previous studies at the site           2011, which occurred during the survey campaign. The
(Soczka Mandac et al., 2014; Soczka Mandac & Fagane-                estimated daily mean river discharge was 21.5 m3 s-1 and
li, 2015). Evaporation, precipitation and other freshwater          the mean river discharge during the survey was (30 m3
inputs were neglected either due to short duration of sim-          s-1), slightly below the maximum. During the survey pe-
ulations or the lack of representative data. The input data         riod, the Badaševica river mean discharge was Qb =1.6
is presented in Table 1.                                            m3 s-1 with 2.2 m3 s-1 peak before the start of the survey

Table 1. Meteorological and hydrological input data for the PCFLOW3D model

                               Wv      Wd         Qr      Qb       ISSr        ISSb        Tr    Tb      Sr     Sb
                   date       (m s )
                                  -1
                                        (°)     (m s ) (m s )
                                                  3 -1     3 -1
                                                                  (mg l )-1
                                                                              (mg l )-1
                                                                                          (°C)   (°C)
                 8 June
                  th
                               1.72    188       21.5     1.4       60          20        19.3   19.4    14     14
                  2011
                   21st
                  March        1.45    221       18.9      1        30         0.5         9      9      14     14
                  2013
                                              Data source: ARSO and Harpha Sea, d.o.o. Koper.

Fig. 2: Rižana and Badaševica river hourly (QR and QB) and daily mean (Qr and Qb) discharge with related inflow concentrations of
ISS (ISSr and ISSb) (a). Density profile (b) and wind direction and velocity applied (average wind velocity of 1.7 m s-1 188°) during
the high-discharge event 8th June 2011 (c) (ARSO, 2014a).

39                                                                                                 Medit. Mar. Sci., 19/1, 2018, pp-pp

                       http://epublishing.ekt.gr | e-Publisher: EKT | Downloaded at 20/03/2020 05:25:56 |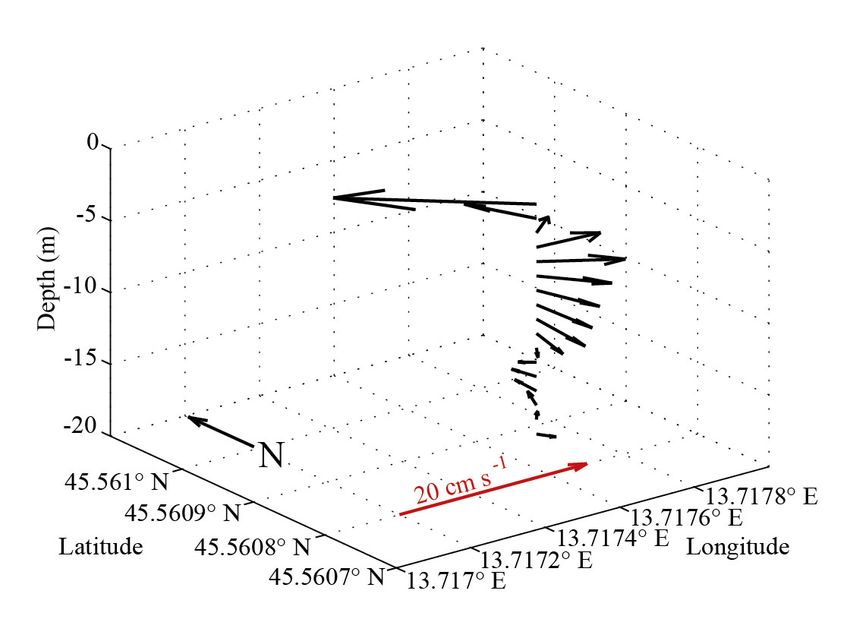
(Fig. 2A). The Badaševica daily mean discharge was 1.4
m3 s-1 (Fig. 2A) and the evaluated ISS inputs of Rižana             Table 2. Vertical profiles of temperature (T) and salinity (S) in
(ISSR) and Badaševica (ISSB) were 60 mg l-1 and 20 mg               each layer.
l-1 (Table 1), respectively. The density profile (Fig. 2B)
shows the water column stratification obtained from the                       Date         8th June 2011    21st March 2013
T and S (Table 2) used as input values in the model. Dur-
ing the survey (4 h) the mean wind force was 5.3 m s-1                     Depth (m)      T (°C)      S     T (°C)       S
and mean direction 256°. Slightly different wind direc-                        0.5        20.34     35.58 10.26       29.77
tion (188°) and speed (6 m s-1) were used as input values
                                                                               1.5        19.76     36.12    10.11    36.03
for the model (Table 1 and Fig. 2C). During the episode
of 21st March 2013, the maximum Rižana river discharge                         2.5        19.31     36.32 10.01       37.02
was QR= 26 m3 s-1, lower than the June 2011 episode. The                       3.5        18.99     36.36    9.93     37.24
river discharge dynamics were also different; Fig. 3A                          4.5        18.61     36.48    9.80     37.41
shows a decreasing river discharge rate (QR) before and
after the measurement campaign. In the model we used                           5.5        18.38     36.54    9.69     37.50
the daily mean rates Qr = 18.9 m3 s-1 and Qb = 1 m3 s-1 pro-                   6.5        18.04     36.59    9.62     37.57
vided by ARSO (2014a) (Fig. 3A). During the survey, the                        7.5        17.76     36.6     9.58     37.63
wind velocity reached 3 m s-1 with direction 218°, while                       8.5        17.49     36.61    9.56     37.68
the daily mean wind velocity was 1.5 m s-1 with direction
221° (Fig. 3C). Strong stratification was present in the top                   9.5        17.19     36.63    9.56     37.71
3 m of the water column (Fig. 3B).                                             10.5       16.71     36.66    9.56     37.76
    Particle grain size parameters for the sediment trans-                     11.5       16.39     36.71    9.56     37.80
port module were acquired on 21st March 2013 from a water
                                                                               12.5       15.78     36.80    9.56     37.84
sample taken at the mouth of the Rižana River, when the
TSS mass on the filter was sufficient to perform the grain                     13.5       15.58     36.90    9.55     37.90
size analysis. The mean particle diameter D50 = 6.8 μm and                     14.5       15.20     36.91    9.52     37.95
the diameters D16 = 1.9 μm; D84 = 37.4 μm and D90 = 70 μm                      15.5       14.94     36.93    9.51     37.96
were used in performed simulations. The density of dry sed-
                                                                               16.5       14.74     36.95    9.51     38.00
iment taken into account was 2760 kg m-3, and the adopted
average porosity in the top sediment layer was 0.5.                            17.5       14.74     36.95    9.51     38.06
    High stratification with a pronounced pycnocline (Δρ=                      18.5       14.74     36.95    9.56     38.12
2.5 kg m-3) is evident in the surface layers (0.5 to 4.5 m).                   19.5       14.74     36.95    9.56     38.12
The initial temperature (T) and salinity (S) data for indi-
vidual layers were obtained from horizontally averaged                         20.5       14.74     36.95    9.56     38.12
data in the vertical profiles of spatial measurements on                       21.5       14.74     36.95    9.56     38.12
the selected days (Table 2); thus, different but uniform                       Data source: Harpha Sea, d.o.o. Koper.
distribution of salinity and temperature in the model lay-
ers were used as the initial data.

Fig. 3: Rižana and Badaševica river hourly (QR and QB) and daily mean (Qr and Qb) discharge with related inflow concentrations of
ISS (ISSr and ISSb) (a). Density profile (b) and wind direction and velocity applied (average wind velocity of 1.5 m s-1 221°) during the
high-discharge event 21st June 2013 (c) (ARSO, 2014a).

Medit. Mar. Sci., 19/1, 2018, pp-pp                                                                                                 40

                    http://epublishing.ekt.gr | e-Publisher: EKT | Downloaded at 20/03/2020 05:25:56 |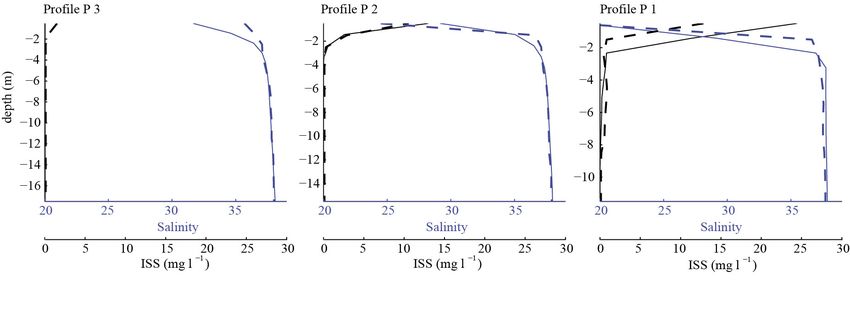
Model calibration and validation                                 Results

    The main goal of the performed simulations was to            8th June 2011 episode
obtain spatial distribution of riverine suspended solids
concentrations after the short flood-events (24 h). We                Surface velocity fields in the simulation of high riv-
used the quasi-steady state approach, which has been ap-         er discharge (Fig. 4B) clearly reveal the impact of river
plied in similar simulations (Četina et al., 2000; Žagar et    inflow on surface currents. The inflow-driven currents
al., 2001; Žagar et al., 2007). The model was calibrated at     are evident within the second port basin, near the basin’s
two river discharge rates, on 8th June 2011 and 21st March       mouth. They are less prominent but still visible at the
2013, when the discharges of the Rižana reached 21.5 m3          Badaševica river mouth. These currents are not signifi-
s-1 and 18.9 m3 s-1, respectively. The ISS concentrations at     cantly affected by relatively weak wind forcing (average
the river mouth on 8th June 2011 and on 21st March 2013          wind speed
Fig. 4: ISS distribution in the surface layer on 8th June 2011: measurements (a) and model simulation – average velocities and ISS
distribution (b). Spatial map of discrepancies between model and measurements (c) and ranging of cells with regard to discrepan-
cies (d); ΔMIN and ΔMAX depict minimum and maximum discrepancy, respectively.
Fig. 5: Velocity profile at comparison site 2 after a 24-hour simulation on 8th June 2011.
Medit. Mar. Sci., 19/1, 2018, pp-pp 42
http://epublishing.ekt.gr | e-Publisher: EKT | Downloaded at 20/03/2020 05:25:56 |Fig. 6: Salinity and ISS profiles after 24-hour simulation at the comparison sites (P1- right, P2-center and P3-left); the event on
8th June 2011.
Fig. 7: ISS distribution in the surface layer on 21st June 2013: measurements (a) and model simulation – average velocities and ISS
distribution (b). Spatial map of discrepancies between model and measurements (c) and ranging of cells with regard to discrepan-
cies (d); ΔMIN and ΔMAX depict minimum and maximum discrepancy, respectively.
43 Medit. Mar. Sci., 19/1, 2018, pp-pp
http://epublishing.ekt.gr | e-Publisher: EKT | Downloaded at 20/03/2020 05:25:56 |Fig. 8: Salinity and ISS profiles after 24-hour simulation at comparison sites (P1- right, P2-center and P3-left); the event on 21st
June 2013.
low r = 0.54 and R2 = 0.23 in P3 but acceptable NSE and tion is plume shaped in comparison to the measurements
PBIAS values in all profiles. Maximum ISS difference limited within the region of fresh water influence. Com-
(33 mg l-1) was observed in the surface layer near the riv- parison of ISS in individual cells (Fig. 7D) again reveals
er mouth in the profile P1. Increased ISS concentrations an underestimation of concentrations (PBIAS > 0) with
below 8 m in P1 and the peak in the 6-8 m layer in P3 are the majority of cells’ discrepancy ranging between -5
most probably an aftermath of another event (e.g., mar- and 0 mg l-1, and the rest mostly within 0 and 10 mg l-1.
itime traffic) that increased turbulence at that depth. At Maximum discrepancies (~-30 mg l-1) were found in the
P2 the agreement of ISS at the surface is excellent (ΔISS second basin near the river mouth and in the north-eastern
< 0.3 mg l-1) with the mean difference along the water part (third basin) of the port (-13 mg l-1, Fig. 7C). About
column ~0.8 mg l-1. Good agreement of salinity was also 10 mg l-1 higher concentrations in comparison to mea-
found in P2 (Fig. 6, Table 3). surements were observed in the central part of the sim-
ulated river plume. The NSE = 0.83 and PBIAS ~ 26%
21st March 2013 episode values together with lower r = 0.64 and R2 = 0.41 reveal
somewhat lower, but still acceptable, agreement of the
The spatial analysis of ISS distribution (Fig. 7A) modelling results. Better agreement between the salinity
shows lower concentrations (Discussion good agreement with measurements, except for the up-
permost layer. Nonetheless, the observed discrepancies
As mentioned in Materials and Methods, the third of all parameters in the surface layer may be a conse-
port basin was restricted and unavailable for taking meas- quence of the dynamics of water masses stemming from
urements. There, the DIVA interpolation method showed previous meteorological events, which cannot be taken into
the largest discrepancies, due to the increased distance account in short-term simulations. Evaluation of the model
between measurement locations (Soczka Mandac and Fa- using the statistical analyses in the surface layer revealed
ganeli, 2005). Higher discrepancies in this part of the port acceptable model efficiency (NSE > 0.8) and the aforemen-
were observed in simulations of both events. The major tioned underestimation of ISS concentrations (PBIAS > 0).
error evaluated in the third port basin exceeded 25% due Figs 4C and 7C depict the area with the highest discrepan-
to limited measurements in this zone. The observed dif- cies in the vicinity of the river mouth while the number of
ferences to the model results in this part (Fig. 4C and 7C) cells with underestimated ISS is visible from Fig.s 4D and
were also relatively high (~20 mg l-1); this could be con- 7D. In their vast majority, the underestimation by the model
nected to the DIVA extrapolations’ higher concentrations is less than 5 mg l-1.
near the NE coast. Nonetheless, as suggested by Soczka Qualitatively, the trend of the simulated salinity and
Mandac & Faganeli (2015), the results were found to be ISS in profiles fits the measurements at all sites in both
acceptable for application in studies connected to sedi- examples. Quantitative agreement within a factor of 2,
ment transport in the Bay of Koper. considering the intricate processes within the study site,
Concentrations of nearly cohesive suspended sed- is encouraging for a simplified sediment transport model
iment are difficult to measure; particularly in high-dis- performing short-term simulations. Statistically, five of
charge and coincident heavy weather conditions. Fewer the six profiles show acceptable agreement between mea-
measurements were performed at high river discharges, surements and simulations (NSE > 0). Underestimation
which suggests lower reliability of Eq. (1) in such con- of modelled ISS is, however, obvious: all PBIAS values
ditions and a part of the discrepancies may stem from are positive but decreasing with the distance from the riv-
measurements and the applied interpolation method. er mouth. This again confirms the previously observed
The spatial analysis of measurements exhibited similar deficiency of the applied model for assessing fine sedi-
patterns of ISS distribution during both high-discharge ment fractions, which remain in suspension for a longer
events. Maximum ISS concentrations were measured time.
within proximity of the river mouth and in the port ba- In previous studies of suspended sediment inflow in-
sin. Significantly lower concentrations were identified in volving rivers the PCFLOW3D results were either evalu-
the open part of the bay, which suggest both dilution and ated qualitatively (Rajar et al., 2000), or just the influence
settling/accumulation of ISS in the port basin. Some fur- of hydrodynamics driven by different wind pattern was
ther discrepancies might have originated from the inflow of presented (Ramšak et al., 2013). Never before have the
treated waters and (mainly organic) suspended matter from results been compared to a large set of measured data, and
the municipal treatment plant. in this study we present the first quantitative analysis of
Using any single-fraction sediment transport model the sediment transport module of the PCFLOW3D mod-
results in the settling of a large part of ISS at the outflow el. Taking into account all aforementioned prepositions
to the sea, where the transport capacity decreases due to and the complex behaviour of nearly cohesive sediments,
lower flow velocities. Furthermore, neither the variation we assume the agreement of the obtained results to be
of settling velocity due to flocculation nor the colloidal reasonably good.
fraction, which tends to remain in suspension, can be The other studies on sediment transport available for
simulated with single-fraction models. This is most likely the Adriatic Sea are either not connected to river inflows
the reason for poor agreement between simulations and (Wang et al., 2007), or performed in different spatial and
measurements in the vicinity of the river mouth. Most temporal scales (Harris et al., 2008). Furthermore, none
probably from this also accounts for the higher ISS con- of these studies reports a comparison with in-situ mea-
centrations compared to the model that were found in the surements. Research on sediment transport in a similar
western part of the bay; a single-fraction model is not ca- spatial scale was performed with the combined modelling
pable of simulating transport of small-size particles by tool ROMS – CSTMS (Regional modelling ocean sys-
the currents. Similar ISS distribution observed at the sur- tem – Community sediment transport modelling system
face in both simulations suggests the application of an on Waipaoa Shelf, New Zealand (Moriarty et al., 2014).
improved (multi-fraction) sediment transport model - in The authors applied a multi-fraction sediment transport
order to assess the distribution of finer fractions and at a model and collected a significantly larger amount of in-
greater distance from the river mouth with more accu- put, calibration and validation data for a one-year period,
racy. Qualitatively, the plume-shaped distribution of the which was also the interval of their simulation. Nonethe-
ISS concentrations was expected and also observed and less, even this extremely comprehensive study is predom-
described in previous studies (Soczka Mandac & Fagan- inantly dedicated to morphology alterations due to ero-
eli, 2015). Furthermore, the vertical gradient of salinity sion and sedimentation processes and does not report on
in the major part of the water column was in reasonably distribution of suspended solids during short-term flood
45 Medit. Mar. Sci., 19/1, 2018, pp-pp
http://epublishing.ekt.gr | e-Publisher: EKT | Downloaded at 20/03/2020 05:25:56 |ARSO. 2014b. Meteorologic data base http://meteo.arso.
events. With regard to scale and quantity of measured gov.si/ (Accessed 11 October 2015).
data used in model calibration and validation, the present Četina, M., 1992. Tridimenzionalni matematični baroklini mo-
study represents a novelty in sediment transport model- del za izračun tokov v jezerih in morju: doktorska diserta-
ling in the Adriatic area. Moreover, to our best knowledge cija = Baroclinic three-dimensional mathematical model for
modelling studies carried out on short term events with calculating flows in lakes and sea. PhD Thesis, University
the aim of determining distribution of suspended solids in of Ljubljana Slovenija, 72 pp.
the water column have not yet been performed. Četina, M., Rajar, R., Povinec, P., 2000. Modelling of circu-
lation and dispersion of radioactive pollutants in the Japan
sea. Oceanologica Acta 23, 819-836.
Conclusions
Covelli, S., Piani R., Acquavita, A., Predonzani, S., Faganeli, J.,
2007. Transport and dispersion of particulate Hg associated
The spatial analysis of the two episodes showed high with a river plume in coastal Northern Adriatic environmen-
concentrations of ISS in the port basin near the river ts. Marine Pollution Bulletin 55, 436-450.
mouth and plume shaped patterns of distribution in the Faganeli, J., and Turk, V., 1989. Behaviour of dissolved or-
open part of the bay. The finding of this study depicts the ganic matter in a small, polluted estuary. Scientia Marina
impact of river discharge in the heavily modified coastal 53, 513-521.
environment on the distribution of ISS concentration. Gupta, H.V., Sorooshian, S., Yapo, P.O., 1999. Status of auto-
Relatively good visual and statistical correlations were matic calibration for hydrologic models: Comparison with
multilevel expert calibration. Journal of Hydrolgic Engine-
found between measurements and modelling results.
ering, 4, 135-143.
Agreement in salinity provides the basis for determina- Harris, C.K., Sherwood, C.R., Signell, R.P., Bever A. J., Warner
tion of the region of fresh water influence. Simulations of J. C., 2008. Sediment dispersal in the northwestern Adria-
the ISS distribution compared to the measured turbidity tic Sea, Journal of Geophysical Research 113, C11S03,
confirmed the connection between high turbidity and low doi:10.1029/2006JC003868
salinity. Kovšca, J., 2007. Dopolnitve modela PCFLOW3D za simulacijo
Further research is needed to address the discrepancies tokov in širjenja polutantov = Completion of the PCFLOW3D
of numerical modelling in the selected area of the Bay of model for simulation of flow and dispersion of pollutants.
Koper that can be attributed to several influences that af- MSc Thesis, University of Ljubljana Slovenija, 67 pp.
fect the studied bay: impact of the open boundary, mass Lipej, L., Turk, R., Makovec, T., 2006. Endangered species and
habitat types in the Slovenian sea. Institute of the Republic
and heat fluxes at the interfaces, resuspension of sediment
of Slovenia for Nature Conservation, Ljubljana, 264 pp.
due to maritime traffic, and runoff of treated wastewater, Malačič, V., Čermelj, B., Bajt, O., Ramšak, A., Petelin B. et al. ,
being a few of them. Additional measurements and im- 2009. Cirkulacija in okoljske razmere v Koprskem zalivu in
provements of the model are therefore needed. In order to Luki Koper : okoljska študija 3. Maritime Biology Station -
perform simulations with greater accuracy, initialization National Institute of Biology, 102 pp.
of the model is needed to provide relevant initial condi- Malačič, V., Martinčič, U., Mavrič, B., Bajt, O., Kovač, N. et
tions throughout the computational domain. Furthermore, al., 2014. Vpliv cirkulacije v široko odprtih zalivih in po-
nesting of the Bay of Koper into coarser grid models of morskega prometa na transport sedimenta : poročilo 11
larger domains is necessary to provide better boundary aplikativnega projekta L2-4147 : študija = Influence of cir-
culation in wide open bays and maritime traffic on sediment
conditions. Finally, a refined model grid and real time
transport: report 11 applied project L2 -4147 : study. Mari-
computations would enable the use of real time environ- time Biology Station - National Institute of Biology, 73 pp.
mental monitoring data and enhanced model results. Malačič, V., Petelin, B., 2006. Numerical modeling of the win-
Nevertheless, the results of this study confirm the po- ter circulation of the Gulf of Trieste (northern Adriatic).
tential of the applied methods and modelling approach Acta Adriatica 47: 207-217.
for simulating inflow and transport of particulates and Malačič, V., Petelin, B., Žagar, D., Bajt, O., Ramšak, A., V. et
particle-bound pollutants in the costal sea. al., 2010. Cirkulacija in okoljske razmere v Koprskem zali-
vu in Luki Koper : okoljska študija 4. Maritime Biology Sta-
Acknowledgements tion - National Institute of Biology, 97 pp. Journal of Marine
Science and Engineering, 2, 336-369.
Nash, J.E., Sutcliffe, J.V., 1970. River flow forecasting through
This study was partly financed by the European Union,
conceptual models part I - A discussion of principles. Jour-
European Social Fund between 2010 and 2014 (MR-151) nal of Hydrology, 10, 282-290.
and by the Slovenian Research Agency in the framework Ogorelec, B., Mišič, M., Faganeli, J., Stegnar, P., Vrišer B. et
of the research programme P2-0180. The authors would al., 1987. The recent sediment of the Bay of Koper (Nor-
like to thank the Slovenian Environment Agency for the thern Adriatic). Geologija, 87-121.
meteorological and hydrological data and the anonymous Orlando Bonaca, M., Lipej L., Orfanidis, S., 2008. Benthic ma-
reviewers for their valuable suggestions. crophytes as a tool for delineating, monitoring and asses-
sing ecological status: The case of Slovenian coastal waters.
References Marine Pollution Bulletin, 56, 666-676.
Orpin, A.R., Ridd, P.V., Thomas S., Anthony, K.R.N., Marshall, P.
et al., 2004. Natural turbidity variability and weather forecasts
ARSO. 2014a. Hydrological data base http://vode.arso.gov.si/ in risk management of anthropogenic sediment discharge near
hidarhiv/pov_arhiv_tab.php (Accessed 11 October 2015). sensitive environments. Marine Pollution Bulletin 49, 602-612.
Medit. Mar. Sci., 19/1, 2018, pp-pp 46
http://epublishing.ekt.gr | e-Publisher: EKT | Downloaded at 20/03/2020 05:25:56 |Rajar, R., Četina, M., 1997. Hydrodynamic and water quality mo- Turk, V., Bajt, O., Mozetič, P., Poje, M., Ramšak, A. et al.,
delling. An Experience. Ecological modelling 101, 195-207. 2014. Monitoring the water quality of the sea and pollution
Rajar, R., Žagar, D., Četina, M., Akagi, H., Yano, S. et al., 2004. from the inland in accordance with the Barcelona Conven-
Application of three-dimensional mercury cycling model to tion: Annual Report 2013. Marine Biology Station - Natio-
coastal seas. Ecological modelling, 139-155. nal Institute of Biology Annual Report, 32 pp.
Rajar, R., Žagar, D., Širca, A., Horvat, M., 2000. Three-dimen- Wang, X.H., Pinardi, N., Malačič, V., 2007. Sediment transport
sional modelling of mercury cycling in the Gulf of Trieste. and resuspension due to combined motion of wave and cur-
Science of The Total Environment 260, 109-123. rent in the northern Adriatic Sea during a Bora event in Ja-
Soczka Mandac, R., Bogunović, B., Žagar, D., Faganeli, J., nuary 2001: a numerical modelling study. Continental Shelf
2014. Riverine impact on the thermohaline properties, tur- Research 27, 613-633.
bidity and suspended solids in a shallow bay (Bay of Koper, Wolanski, E., 2007. Estuarine ecohydrology. Elsevier, Amster-
northern Adriatic Sea). Acta Adriatica 55 (2), 195-212. dam, 168 pp.
Soczka Mandac, R., Faganeli, J., 2015. Deposition of riverine Žagar, D., 1999. Razvoj in aplikacija tridimenzionalnega mo-
suspended solids in a shallow bay (Bay of Koper, Gulf of dela za simulacijo transporta in procesov pretvorb živega
Trieste, northern Adriatic Sea). Journal of Soils and Sedi- srebra v morskem okolju = Development and application
ments 15, 2433-2442. of a three-dimensional model to simulate mercury transport
Stone, M., Droppo, I.G., 1994. In-channel surficial fine-grai- and transformation process in the marine environment. Acta
ned sediment laminae. Part II: Chemical characteristics and hydrotechnica 17, 60-61.
implications for contaminant transport in fluvial systems. Žagar, D., Petkovšek, G., Rajar, R., Sirnik, N., Horvat, M. et al.,
Hydrological Processes 8, 113-124. 2007. Modelling of mercury transport and transformation in
Troupin, C., Barth, A., Sirjacobs, D., Ouberdous, M., Brankart the water compartment of the Mediterranean Sea. Marine
J. M. et al., 2012. Generation of analysis and consistent er- Chemistry 107, 64-88.
ror fields using the Data Interpolating Variational Analysis Žagar, D., Rajar, R., Širca, A., Horvat, M., Četina, M., 2001.
(DIVA). Ocean Modelling, 52-53: 90-101. Dolgotrajna 3D simulacija transporta in disperzije živega
Turk, V., Bajt O., Mozetič P., Poje M., Ramšak A. et al., 2011. srebra v Tržaškem zalivu = Long-term 3D simulation of the
Monitoring the water quality of the sea and pollution from transport and dispersion of mercury in the Gulf of Trieste.
the inland in accordance with the Barcelona Convention: Acta hydrotechnica 19, 25-43.
Annual Report 2010. Marine Biology Station - National In- Žagar, D., Ramšak, V., Petelin, B., Malačič, V., 2012. Sediment
stitute of Biology Annual Report, 33 pp. transport modelling in the Koper bay - Northern Adriatic
Turk, V., Bajt, O., Mozetič, P., Poje, M., Ramšak, A. et al., Slovenia. 1-6. IAHR 2nd European Congress Munich, 27th
2012. Monitoring the water quality of the sea and pollution - 29th June 2012. IAHR, Munich.
from the inland in accordance with the Barcelona Conven- Žagar, D., Ramšak, V., Jeromel, M., Perkovič, M., Ličer, M.
tion: Annual Report 2011. Marine Biology Station - Natio- et al., 2014. Modelling sediment resuspension caused by
nal Institute of Biology Annual Report, 37 pp. navigation, waves and currents (Gulf of Trieste, Northern
Turk, V., Bajt, O., Mozetič, P., Poje, M., Ramšak, A. et al., Adratic). 1-9. IAHR 3rd European Congress. Porto, Portu-
2013. Kakovost obalnega morja v letu 2012 = The quality of gal. http://webpages.fe.up.pt/iahr2014/proceedings.zip
coastal waters in 2012. Marine Biology Station - National (accessed 20 Nov 2017).
Institute of Biology Annual Report, 33 pp.
47 Medit. Mar. Sci., 19/1, 2018, pp-pp
http://epublishing.ekt.gr | e-Publisher: EKT | Downloaded at 20/03/2020 05:25:56 |
Powered by TCPDF (www.tcpdf.org)You can also read