BYOE: An Evaporative Cooler with Virtual Connectivity - Asee ...
←
→
Page content transcription
If your browser does not render page correctly, please read the page content below
Paper ID #33674

BYOE: An Evaporative Cooler with Virtual Connectivity
Prof. Ahmet Can Sabuncu, Worcester Polytechnic Institute
 Dr. Sabuncu holds a Ph. D. in Aerospace Engineering from Old Dominion University. Dr. Sabuncu’s
 professional interests spans from engineering education research, history of science and engineering,
 thermo-fluids engineering, and microfluidic technology. Dr. Sabuncu is eager to discover next gener-
 ation workforce skills and to educate next generation of engineers who will carry industry 4.0 forward
 considering the needs of the global world.
Prof. John M. Sullivan Jr, Worcester Polytechnic Institute
 Professor John Sullivan joined WPI in 1987. He has had continuous external research funding from 1988
 thru 2013. He has graduated (and supported) more than 75 MS and PhD graduate students. He has served
 as the ME Department Head and in 2012 was elected Secretary of the Faculty through 2015. Prof. Sullivan
 has always maintained a full teaching load. He strongly supports the WPI project-based undergraduate
 philosophy.
Miss Kerri Anne Thornton, Worcester Polytechnic Institute

 Kerri Thornton is in the Class of 2024 at Worcester Polytechnic Institute in Massachusetts. She has not
 yet declared a major but is interested in pursuing engineering.
Dr. Maqsood Ali Mughal, Worcester Polytechnic Institute
 Maqsood Ali Mughal was born in Karachi, Pakistan, in April 1986. He received a B.S. degree in Elec-
 tronic Engineering in 2008 from Sir Syed University of Engineering and Technology, Karachi, and the
 M.S. degrees in Engineering Management and Environmental Sciences in 2010 and 2014 from Arkansas
 State University (A-State), Jonesboro. He then received his Ph.D. degree in Environmental Sciences at
 A-State Optoelectronic Materials Research Laboratory (OMRL)-College of Engineering with doctoral re-
 search focusing upon synthesis of thin film semiconductor materials for photovoltaic applications. His
 research interests revolves around investigating next-generation materials (sulfides, chalcogenides, metal
 oxides) for use as solar cell materials to reduce the cost and toxicity, while increasing energy conversion
 efficiency. I am also interested in exploring possibility of using these materials for aerospace, biomedi-
 cal, and other applications. In addition, I have recently been fascinated by the emergence of 3D printed
 electronics for wide range of applications and have been building drones for environmental use as well as
 launching high altitude balloons for collecting atmospheric data and measuring environmental pollution
 at different atmospheric levels. Jan 2015, Dr. Mughal joined the Electrical Engineering Department at
 A-State as a faculty and worked for about an year before joining Fitchburg State University as an Assistant
 Professor of Electronics Engineering Technology program. In 2018, he joined Worcester Polytechnic In-
 stitute as an Assistant Professor. Dr. Mughal was a recipient of Best Graduate Student Award for the ASU
 College of Engineering in 2010. In the same year, he received the LRCSI Ray Echols Scholarship, while;
 he was also a Student Entertainment Chairmen for the American Society for Quality (ASQ)-Northeast
 Arkansas, Section 1415NEA Student Branch (ASU). He has presented his work in more than 25 confer-
 ences including prestigious conferences like IEEE PVSC, TechConnect, EMC, etc. all over United States
 of America. He won 2 first prize awards for oral presentations, both at the Arkansas Academy of Science
 (AAS) in 2011 and 2012. He has several publications (both conference proceedings and journal) related
 to his research on electrodeposition of semiconductor materials for solar energy application. He is also
 a professional member of IEEE, NSPE, IAENG, etc. and review papers for SolarEnergy, The European
 Physical Journal Applied Physics (EDP Sciences), and IEEE Industrial Application Society.

 c American Society for Engineering Education, 2021
BYOE: An Evaporative Cooler with Virtual Connectivity

ABSTRACT

One of the challenges in online education is enabling experimentation and laboratory-oriented
coursework in an online environment. In this Bring Your Own Experiment session, we introduce
an experimental setup that enables remote-learning students to gain thermodynamics-related
technical skills. We use a setup that has an evaporative cooler to teach these skills. The setup
incorporates a clear polycarbonate tubing that houses an evaporative cooler pad, an axial fan that
continuously blows air onto the pad, and sensors to measure thermodynamic properties upstream
and the downstream of the pad. The evaporative pad is kept wet by maintaining a continuous
perfusion of water via a peristaltic pump. Sensors include temperature and humidity sensors. The
sensors are connected to a microcontroller that has a Wi-Fi connectivity. All sensor data and a
camera feed, which shows the experimental setup, are fed into a cloud storage using Internet of
Things technology while the experimental setup is kept at our institution. Basically, with this
apparatus, the data flows from the microcontroller to a Google sheet, and students remotely
access this data. The remote students calculate the efficiency of the evaporative cooler and find
the efficiency for the given volumetric flow rate and evaporative pad setup. This experiment is
conducted as a part of a junior-level engineering experimentation course in a technological
university.

The deliverable of this experiment is a short report that requires the students to obtain the
learning objectives associated with,
• the use of a psychrometric chart to find the wet bulb temperature, and
• the components associated with calculating the cooling efficiency,

We implemented this experimental setup as one of the possible student laboratory exercise in an
engineering experimentation course. We had nine students complete this optional assignment in
a class of 89 students. We measured student engagement with a survey and analyzed student
work. Students liked the mode of data acquisition and student success was high. We believe this
methodology is particularly important when delivering experimentation remotely, including our
current pandemic situation.

INTRODUCTION

College education is an enabler. It enables fulfilling one’s dreams and economic prosperity at a
larger scale. However, due to ever-increasing costs of higher education, a discrepancy exists in
accessibility to higher education. Only 1 in 10 people in low-income families get a college
degree that is in sharp contrast to 5 in 10 people in high-income families [1]. Between 1985 and
2018, the cost of average tuition of 4-year private higher education institutions has doubled when
costs are adjusted by purchasing power over years [2]. While there is also an increase in the total
amount of financial aid awarded to students, the average federal and state financial aid combined
was around 25% of the average tuition cost of 4-year institutions in 2018 [3]. Online education
can provide a solution to ever-increasing tuition costs, making colleges more accessible for low-
income families. Online education can also accommodate the changing student profile, such as
those of a student working part-time or a veteran, which require flexible schedules and location
to learn [4].
One component of engineering education that has not yet been translated into online settings is
experimentation and laboratory-oriented studies, which are traditionally conducted in
laboratories equipped with high-end instruments. These laboratories are utilized in situ to
achieve relevant learning outcomes. In virtual laboratories students can use computers [5] or
virtual/augmented reality equipment [6] to be “virtually” present in a simulated lab. However,
high-quality virtual/augmented reality equipment is expensive, and these laboratories only
simulate models. Therefore, students don’t gain psychomotor skills, and they are not exposed to
unprecedented conditions (noise, for example) of actual labs. In another modality, students
convert their personal dwellings into laboratories to do experiments with equipment that they
purchase from online merchants or received from the instructor [8]. In this modality, however,
the experiments are limited by the availability of the materials to the students. In remote
laboratories such as what we are proposing here, students electronically connect to a physical
setup at an institution to conduct experiments or observations.

Today, remote laboratories use the Internet of Things (IoT) technology to connect physical
setups to the web, although this technology is still relatively new. For instance, study by
Clemente et al. uses IoT technology to create a remote lab that could be shared by multiple
universities [8]. TU Dortmund University uses a tele-operated robotic arm to do standardized
material characterization tests [9]. While the internet has allowed connection of knowledge
around the world, it depends on a person to react on the information. The IoT has been
developed in the recent years [10]. Preceding technologies such as RF-ID and Barcode are
similar to IoT as these enable connection of objects. These objects could be sensors, motors, or
everyday objects such as light switches, thermostats, and washing machines.

In this paper, we describe a remote experiment that targets teaching thermodynamics-related
technical skills involving an evaporative cooler. Students connect to this setup using IoT
technology and acquire data, while the setup is maintained at our institution. In this experiment,
an instructor must be present in the laboratory to initiate the experiment. Students do not control
the experiment as they observe the experiment and download data for analysis. In this pilot
study, we are only interested in one-way data transfer between the setup and students. Two-way
data transfer, which enables student control of the setup, is not addressed here. Our learning
objectives include study of thermodynamic properties of air and calculation of evaporative cooler
efficiency. A distinctive feature of our setup is that the total cost of setup to the university is less
than $200 and essentially costless to the students if they have a computer with internet
connection. The low-cost nature of our work could make experimentation and laboratory-based
engineering education more accessible. We present exploratory pilot results of this teaching
activity and students’ perception of the experiment.

LEARNING OUTCOMES

This exercise is used to teach students the use of psychrometric charts. Students apply the
information that they look up from the psychrometric chart to calculate the efficiency of the
cooler. After completing this laboratory exercise, students should be able to:
• Use the psychrometric chart to determine wet bulb temperature using other
 thermodynamic properties.
 • Apply thermodynamic properties to calculate cooling efficiency for an evaporative
 cooler.

While we use IoT as tool for achieving the above learning outcomes, it is not our intent to teach
the use of IoT in engineering.

 DESCRIPTION OF THE EXPERIMENT

Evaporative cooling is probably one of the oldest cooling techniques. Porous pottery has been
used to keep water cool as evidenced by frescoes from about 2500 B.C [11]. Human dwellings
in hot and arid climates have been kept cool since the ancient times using this process.
Evaporative cooling is even a part of homeostasis. Once triggered by excessive body
temperature, sweat glands discharge water at the skin to maintain a set body-core temperature.
These are all possible thanks to large latent heat of water (ℎ = 2257 kJ/kg at 1 atm).
Evaporative cooling requires a wet bulb depression, essentially a difference between wet and dry
bulb temperatures. While such a condition is not required for vapor-compression and
adsorption-based cooling, evaporative cooling requires dry conditions for atmospheric air.
Evaporative coolers, which are also known as swamp coolers, use a material that is constantly
kept moist, and air is blown on this material.

The setup described here is a small-scale evaporative cooler. The authors (henceforth referred to
as “we”) created the experimental setup. We started with a 2 in by 2 in square acrylic duct with a
12V DC fan attached to one end, shown in Figure 1. The other end was left open. In the center of
the acrylic duct, we cut two rectangular slots, which are on the top wall and on the bottom wall,
to allow for insertion of a 6 in long strip of evaporative pad. The pad is secured at the slots, and it
is centered in the acrylic duct. The top end of the evaporative pad was flush against the top wall
of the acrylic duct, so that a 3D printed water diffuser piece would sit level on the top of the
acrylic duct. This allowed the water coming in from the water pump to run through the small
holes drilled into the bottom of the diffuser and soak into the evaporative pad evenly. The other
end of the pad was allowed to extend beyond the bottom wall of the acrylic duct and was
suspended into a bucket of water to increase the amount of water absorbed into the pad. With the
pad saturated, the fan is turned on, causing room temperature air to be blown through the duct
and pad. The air emerging from the other side of the duct is cooler in temperature and higher in
humidity, thanks to the process of evaporative cooling.

The heat and mass transfer at the evaporative pad decreases the dry bulb temperature of the room
air. As a result, the dry bulb temperature approaches the wet bulb temperature. Considering
these, the efficiency is given as [12],

 , − ,
 = . (1)
 , − ,
In Eq (1) , and , are the dry bulb temperatures for room air and air at the
downstream of the evaporative pad, respectively. , is for the wet bulb temperature of the
room air. Students use sensor data for determining , and , . They use the relative
humidity of the room air and , to determine , via the psychrometric chart for
atmospheric air. Given the flow rate of the fan (7 CFM) and the type of the evaporative cooling
pad, the efficiency of the cooler was around 34% in an experiment. We measured the angular
speed of the fan that resulted in 6700 RPM. The air flow speed was 3.5 m/hour in a single
experiment as measured by an anemometer.

 Water
 from
 Sensor
 water
 measuring
 Sensor pump
 air out of Fan in 3D
 measuring (not
 duct printed holder
 air in duct shown)

 3D printed
 Top wall water
 of duct diffuser
 Open
 end

 Top end of
 evaporative pad

 Bucket of water
 Bottom wall of duct

 Figure 1. Square acrylic duct with fan, sensors, evaporative pad, water diffuser, and water

The setup also has two data acquisition units. We used an Arduino MKR 1010 board to collect
data from the sensors. This data was transmitted to an online server. A Raspberry Pi was used
with an 8-megapixel camera that continually livestreamed the video of the setup to a website.
This was achieved by implementing a code (appendix-A) on the Raspberry Pi. Essentially, this
code created a unique website using the Raspberry Pi’s IP address, and then used the Raspberry
Pi camera to stream a live feed to it. The livestream can be accessed by anyone, notably students,
using a web link. This feature allowed students to remotely view the setup in real time, just as if
they were working in the lab in person. An instructor is present to initiate the setup. The
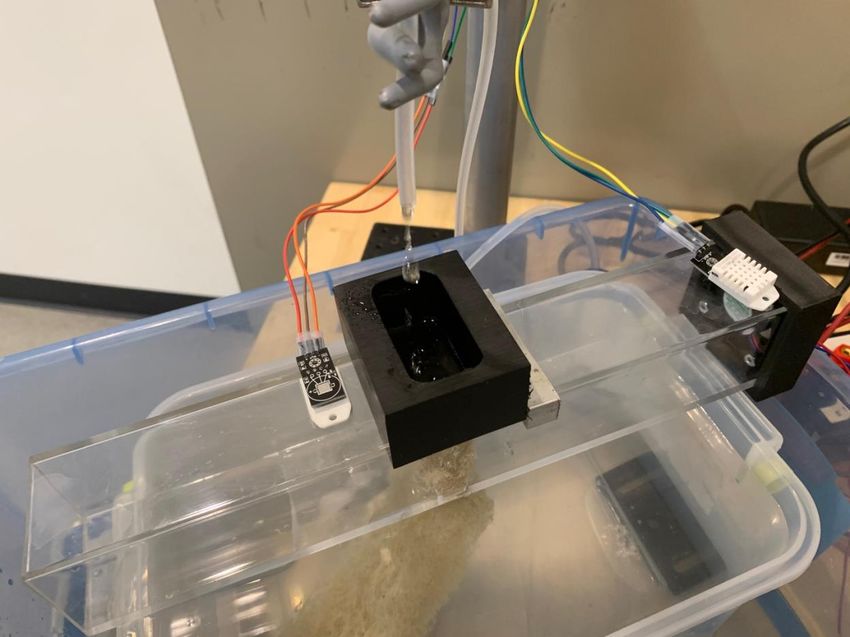
instructor fills the bucket with water, makes sure the evaporative pad is primed with water, and
turns the fan on. However, the instructor does not need to be present during the livestream.
According to our experience, under normal conditions, the experiment can last a minimum of 2
days before the instructor turns off the fan. The content from the livestream is shown on the
Raspberry Pi’s monitor in Figure 2. The Arduino MKR 1010 board is also interfaced to and
powered by the Raspberry Pi.

 Raspberry Pi
 Camera Raspberry Pi

 Monitor
 Connection to
 Arduino

 Cooling fan

 Tripod

 Keyboard

 Figure 2. Raspberry Pi setup includes a camera, monitor and other peripherals to control the
 entire setup. We noticed a temperature increase in the Raspberry Pi, and therefore, a cooling
 fan is included.

The Arduino board has two DHT22 sensors connected. These sensors consisting of a thermistor
and a capacitive humidity sensor, report temperature and relative humidity at 0.5 oC and 2-5%
accuracy, respectively. These two sensors were installed in our acrylic duct, with one sensor
reading these thermodynamic properties of air at the downstream of the evaporative pad, and the
other reading the properties room air. While the former sensor is inside the conduit, the latter
sensor is attached on the exterior of the top wall of the conduit. The data from these two sensors
were then sent by the Arduino to a Google Sheets by use of a free service known as Temboo
(https://temboo.com/), which affords a streamlined way to connect sensors to the internet.
Briefly, Temboo allows users to easily connect their physical setup to an Application
Programming Interface (API), which is essentially the ‘middleman’, which sends information
back and forth between a user and a server. We were able to use this API to send our sensor data
to Google Sheets, so that each time the sensors recorded data (once every 30 seconds), Temboo
sent this data through an API to Google Sheets. Students were then able to open the Google
Sheets to access and record the measurements taken for use in their calculations. The data in the
spreadsheet included dry bulb temperature and relative humidity of room air and air at the
downstream of the evaporative pad. Students then use these variables to calculate the direct
saturation efficiency ( ) of the evaporative cooler. The code implemented on the Arduino board
for measuring and sending data is shown in the appendix (appendix-B). For reference, a
recording of the temperature at the downstream of the evaporative pad is given in Figure 3. This
graph also shows the time scale associated with the transient cooling in the setup. It only takes
about 30 s to cool down air down to a steady temperature with the setup described here. The
entire bill of materials for this setup is given in Table I.

We offered this activity as an optional assignment in our engineering experimentation course.
This engineering experimentation course is online, and students use take home kits to perform
experiments. The optional assignment also had a short, recorded lecture on evaporative cooling
and on the use of psychrometric charts. In this assignment, the instructor initiated the
experimental setup, and after the initiation of the experiment, students were given 24 hours of a
time window to observe the experiment and acquire data. It takes approximately 5 minutes for a
student to observe and acquire data. After 24 hours, the instructor stops the system. In the current
form of this technology, students must participate in the experiment real-time.

Table I. Bill of Materials
Product Name Quantity Description/Additional Place of Purchase
 Details
1) Raspberry Pi 4 Computer
 1
Model B 1GB Ram
2) Raspberry Pi Camera Camera for streaming from
 1 Adafruit
Board V2 - 8 Megapixels Raspberry Pi
3) USB-C Power Supply 1 Power supply for Raspberry Pi CanaKit
4) 7” HDMI 1024x600 LCD Includes Micro HDMI Cable,
 1 SunFounder
Screen Display which is used to connect
 Connects Arduino to sensors
5) Half-size Breadboard 1 Adafruit
 and Raspberry Pi
6) DHT22 Temperature Temperature / humidity
 2 Amazon
Humidity Sensor Module sensors
7) Arduino MKR WiFi 1010 1
8) Low-Voltage Equipment-
Cooling Fan
12V DC with Wire Leads, 1 Fan for inside acrylic duct McMaster-Carr
1.57" Square x 0.39" Deep
Overall, 7 CFM
9) 2" OD x 1-3/4" ID Clear
Extruded Square Acrylic 1 US Plastic Corp
Tubing
10) INTLLAB DIY
Peristaltic Liquid Pump 1 Water pump Amazon
Dosing Pump
11) INTLLAB 3mm ID x
5mm OD Peristaltic Pump 1 Tubing for water pump Amazon
Flexible Hose
12) Evaporative Cooling
Media, 21 in Height, 13 in 1 Evaporative cooling pad Grainger
Width, 1/8 in Depth
13) Standard USB computer
 1 Connects to Raspberry Pi
mouse
14) Standard USB computer
 1 Connects to Raspberry Pi
keyboard
15) Standard computer fan Used to externally cool down
 1
with stand Raspberry Pi
16) Standard camera tripod
 1 Modified to hold Raspberry Pi
stand
 Used to hold one DHT22
17) Standard clear tape 1 sensor from moving on top of
 acrylic duct
 Used to hold breadboard in
18) Standard electric tape 1
 place
 One used to suspend acrylic
 tubing over bucket of water;
 one used to hold water
19) Standard plastic bucket 3
 reservoir for water pump; one
 used to hold any water leaking
 from pump
 Used to suspend water pump
20) Standard zip-ties (x4) 1 over plastic bucket in case of
 leakage
21) Standard breadboard
 6
male/male jumper wires
22) Standard breadboard
 6
female/female jumper wires
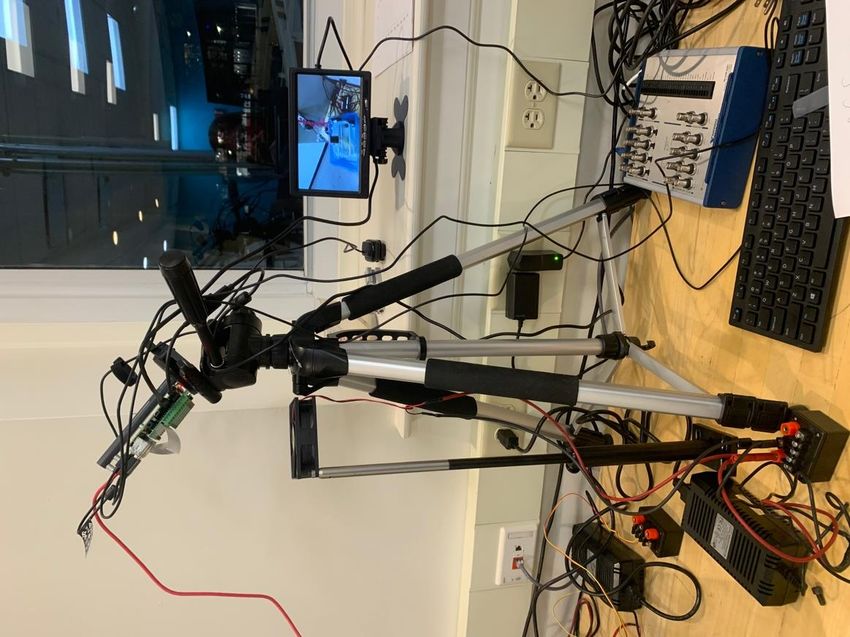
23) Standard 12V power Used to power water pump and
 1
adapter fan inside acrylic duct
24) 3D printed mount for fan 3D printed by
 1
inside acrylic duct Kerri Thornton
 Disperses water from water
 3D printed by
25) 3D printed water diffuser 1 pump evenly across top face of
 Peter Hefti
 evaporative pad

 Figure 3. Transient temperature at the downstream of the evaporative pad. The temperature
 starts at the room temperature and cools down to a lower value when the cooler was turned on.
 When cooler was turned off the temperature raised back to the room temperature.

METHODS

We conducted a pilot study to explore whether students could master the two learning outcomes
for the course from home with the water cooler experiment. The course had 89 students in total
and 9 students took this optional assignment. The students wrote a short report detailing their
calculations, use of psychrometric chart, and the input parameters.

The assignment also included a survey to gauge students’ experience. The questions in the
survey were:

 • Q1: How would you rate your overall experience with ME 3902 Internet of things (IoT)
 Engineering Experimentation (Evaporative Cooler)?
• Q2: The IoT lab exercise (evaporative cooler) was designed such that you could complete
 the project work at home. How likely are you to do a similar experiment from home vs.
 in-class/laboratory?
 • Q3: Do you think having the ability to conduct experiments at home helped (or could
 help) you to learn the engineering experimentation material better?

Student responses for Q1 and Q2 were on a Likert scale (1 to 10), Q3 was a True or False
question.

RESULTS

Students used the psychrometric chart accurately and calculated a meaningful cooling efficiency
in general. We had only one student not able to calculate the efficiency correctly, due to incorrect
assessment of the room wet-bulb temperature. These 9 students that completed this optional
assignment, had received an “A” for their overall efforts in this course.

The average response to Q1 was 9.1, indicating a pleasant experience with the assignment
overall. For Q2, the average response was lower, at 7.2. The Likert scale of Q2 had 0
corresponding to unpleasant experience at home (don't like doing IoT exercise at home, want to
see the setup in real time) while 10 corresponded to pleasant experience at home (like doing IoT
exercise at home). All student responded True for Q3.

We also asked students for their comments. One student expressed a concern on the reliability of
the data that the student acquired in the take home experiments of the course. The same student
later added that by populating data in an IoT powered spreadsheet, students can have a better
understanding what the data should look like. This comment by the student led us think that an
IoT exercise, such as the one in the present study, could be used to guide students on the
accuracy of data before students conduct their own experiments. IoT exercises require a well-
thought setup with calibrated sensors, such that, the data acquired by the students could serve as
model data.

The current pilot study has some limitations. The survey results included responses from only a
subset of the entire student body in the course. Therefore, the results could include bias, and they
should only be considered as providing emergent themes to suggest further study. We plan to
continue to assess the utility and feasibility of the course design and further determine the impact
on students in future research.

CONCLUSIONS

This study was a first trial of an IoT powered student activity for engineering experimentation at
our institution. The learning outcomes were relatively low level and only included the use of
tools rather than creative expression. This is also evident in the student experience as reported in
the survey results. While there is capacity to control equipment remotely, such as to control the
speed of the fan in the present setup, this study only investigated one-way real time data transfer.
In the future, we would like to develop this technology further such that we could create higher
level activities where students control equipment and evaluate their decisions. This is only
possible if we have two-way connectivity between experimental setups and students’ computers.
This modality will enable students to upload data to a cloud server, which then submits data to an
experimental setup. While the technology used in this paper would not be a tool to facilitate
project-based learning in a remote environment since students could not produce original work,
we believe that student activities enabled with the technology described here can prepare them
for such activities in the form of a pre-laboratory resource. Importantly, activities with remote
connections can help students understand what the accurate data should look like and can help
them enable use of some tools, such as the psychrometric chart as explain in this study.

REFERENCES

[1] U.S. Department of Education, “College Affordability and Completion: Ensuring a Pathway
 to Success.” U.S. Department of Education. https://www.ed.gov/college (accessed Mar.
 3, 2021).

[2] U.S. Department of Education, “National Center for Education Statistics,” in Digest of
 Education Statistics, 2018. [Online]. Available:
 https://nces.ed.gov/programs/digest/d18/tables/dt18_330.10.asp

[3] U.S. Department of Education, “Condition of Education,” National Center for Education
 Statistics at the Institute of Education Sciences, USA, NCES 2020-144, May 2020.
 Accessed: Mar. 2, 2021. [Online]. Available: https://nces.ed.gov/pubs2020/2020144.pdf

[4] U.S. Department of Education, “Chapter One: What is Higher Ed? A Student Prospectus” in
 Reimagining the Role of Technology in Higher Education, Office of Educational
 Technology, 2017, ch. 1, pp. 6-16. Accessed: Mar. 2, 2021. [Online] Available:
 https://tech.ed.gov/higherednetp/

[5] University of Colorado Boulder, “Simulations.” PhET Interactive Simulations.
 https://phet.colorado.edu/en/simulations/browse (accessed Mar. 2, 2021).

[6] H.K. Wu, S.W.Y. Lee, H.Y. Chang, and J.C. Liang, “Current Status, Opportunities and
 Challenges of Augmented Reality in Education,” in Computers & Education, vol 62, no.
 1, pp. 41-49, March 2013. [Online] Available: https://www.learntechlib.org/p/132254/

[7] A.C. Sabuncu and J.M. Sullivan. (June 22-26, 2020). A Project Based Online
 Experimentation Course. Presented at 2020 ASEE Virtual Annual Conference. [Online].
 Available:
 https://www.asee.org/public/conferences/172/registration/sessions?page=2&use_new_foo
 ter=true

[8] F.J. García Clemente, L. de la Torre, S. Dormido, C. Salzmann, and D. Gillet (2018)
 “Collecting Experience Data from Remotely Hosted Learning Applications,” in: Auer
M., Zutin D. (eds) Online Engineering & Internet of Things (Lecture Notes in Networks
 and Systems Series 22). Springer, Cham. https://doi.org/10.1007/978-3-319-64352-6_17

[9] J. Grodotzki, T.R. Ortelt, and A.E. Tekkaya, “Remote and Virtual Labs for Engineering
 Education 4.0: Achievements of the ELLI Project at the TU Dortmund University,” in
 Procedia Manufacturing, vol 26, pp 1349-1360, 2018. [Online]. Available:
 https://doi.org/10.1016/j.promfg.2018.07.126

[10] G. Press. “A Very Short History of the Internet of Things.” Forbes.
 https://www.forbes.com/sites/gilpress/2014/06/18/a-very-short-history-of-the-internet-of-
 things/?sh=6b76d53b10de (accessed Mar. 2, 2021).

[11] J.R. Watt, “History of Evaporative Cooling,” in: Evaporative Air Conditioning Handbook,
 pp. 5-11 1986. [Online]. Available: https://doi.org/10.1007/978-1-4613-2259-7_2

[12] ASHRAE Handbook – HVAC Systems and Equipment, SI Edition, ASHRAE, 2020.

APPENDIX

Appendix-A: Raspberry Pi Code

# Web streaming example
# Source code from the official PiCamera package
# http://picamera.readthedocs.io/en/latest/recipes2.html#web-streaming
# code from https://randomnerdtutorials.com/video-streaming-with-raspberry-
pi-camera/ and modified by Kerri Thornton at Worcester Polytechnic Institute

import io
import picamera
import logging
import socketserver
from threading import Condition
from http import server

PAGE="""\

Raspberry Pi - Surveillance Camera

Raspberry Pi - Surveillance Camera

"""

class StreamingOutput(object):
 def __init__(self):
 self.frame = None
self.buffer = io.BytesIO()
 self.condition = Condition()

 def write(self, buf):
 if buf.startswith(b'\xff\xd8'):
 # New frame, copy the existing buffer's content and notify all
 # clients it's available
 self.buffer.truncate()
 with self.condition:
 self.frame = self.buffer.getvalue()
 self.condition.notify_all()
 self.buffer.seek(0)
 return self.buffer.write(buf)

class StreamingHandler(server.BaseHTTPRequestHandler):
 def do_GET(self):
 if self.path == '/':
 self.send_response(301)
 self.send_header('Location', '/index.html')
 self.end_headers()
 elif self.path == '/index.html':
 content = PAGE.encode('utf-8')
 self.send_response(200)
 self.send_header('Content-Type', 'text/html')
 self.send_header('Content-Length', len(content))
 self.end_headers()
 self.wfile.write(content)
 elif self.path == '/stream.mjpg':
 self.send_response(200)
 self.send_header('Age', 0)
 self.send_header('Cache-Control', 'no-cache, private')
 self.send_header('Pragma', 'no-cache')
 self.send_header('Content-Type', 'multipart/x-mixed-replace;
boundary=FRAME')
 self.end_headers()
 try:
 while True:
 with output.condition:
 output.condition.wait()
 frame = output.frame
 self.wfile.write(b'--FRAME\r\n')
 self.send_header('Content-Type', 'image/jpeg')
 self.send_header('Content-Length', len(frame))
 self.end_headers()
 self.wfile.write(frame)
 self.wfile.write(b'\r\n')
 except Exception as e:
 logging.warning(
 'Removed streaming client %s: %s',
 self.client_address, str(e))
 else:
 self.send_error(404)
 self.end_headers()

class StreamingServer(socketserver.ThreadingMixIn, server.HTTPServer):
 allow_reuse_address = True
 daemon_threads = True
with picamera.PiCamera(resolution='640x480', framerate=24) as camera:
output = StreamingOutput()
#Uncomment the next line to change your Pi's Camera rotation (in degrees)
#camera.rotation = 90
camera.start_recording(output, format='mjpeg')
try:
address = ('', 8000)
server = StreamingServer(address, StreamingHandler)
server.serve_forever()
finally:
camera.stop_recording()
Appendix-B: Arduino Code
#Code generated by Temboo
#define TEMBOO_DEVICE_TYPE "a101+w101"
#define WIFI_SSID "WPI-Open"
#include
#include
#include //was #include
#include
#include
#define TEMBOO_ACCOUNT "" // your Temboo account name
#define TEMBOO_APP_KEY_NAME "" // your Temboo app key name
#define TEMBOO_APP_KEY "" // your Temboo app key
#define DHTPIN2 2
#define DHTPIN3 3
#define DHTTYPE DHT22
DHT dht1(DHTPIN2,DHTTYPE);
DHT dht2(DHTPIN3,DHTTYPE);
WiFiSSLClient client;
int calls = 1; // Execution count, so this doesn't run forever
//int maxCalls = 10; // Maximum number of times the Choreo should be
executed
void setup() {
Serial.begin(9600);
dht1.begin();
dht2.begin();
// For debugging, wait until the serial console is connected
delay(4000);
//while(!Serial);
int wifiStatus = WL_IDLE_STATUS;
// Determine if the WiFi Shield is presentSerial.print("\n\nShield:");
if (WiFi.status() == WL_NO_SHIELD) {
Serial.println("FAIL");
// If there's no WiFi shield, stop here
while(true);
}
Serial.println("OK");
// Try to connect to the local WiFi network
while(wifiStatus != WL_CONNECTED) {
Serial.print("WiFi:");
wifiStatus = WiFi.begin(WIFI_SSID);
if (wifiStatus == WL_CONNECTED) {
Serial.println("OK");
} else {
Serial.println("FAIL");
}
delay(5000);
}
Serial.println("Setup complete.\n");
}
void loop() {
//if (callsSerial.print(celData1float);
Serial.print("fehrData1:");
Serial.print(fehrData1float);
Serial.print("hicData1:");
Serial.print(hicData1float);
Serial.print("hifData1:");
Serial.print(hifData1float);
Serial.println();
Serial.print("humidityData2:");
Serial.print(humidityData2float);
Serial.print("celData2:");
Serial.print(celData2float);
Serial.print("fehrData2:");
Serial.print(fehrData2float);
Serial.print("hicData2:");
Serial.print(hicData2float);
Serial.print("hifData2:");
Serial.print(hifData2float);
//convert sensor readings, which are "float", to "unsigned long" because
Temboo wants that
unsigned long humidityData1 = (unsigned long)humidityData1float;
unsigned long humidityData2 = (unsigned long)humidityData2float;
unsigned long celData1 = (unsigned long)celData1float;
unsigned long celData2 = (unsigned long)celData2float;
unsigned long fehrData1 = (unsigned long)fehrData1float;
unsigned long fehrData2 = (unsigned long)fehrData2float;
unsigned long hifData1 = (unsigned long)hifData1float;
unsigned long hifData2 = (unsigned long)hifData2float;
unsigned long hicData1 = (unsigned long)hicData1float;
unsigned long hicData2 = (unsigned long)hicData2float;
// Invoke the Temboo client
AppendValuesChoreo.begin();
// Set Temboo account credentials
AppendValuesChoreo.setAccountName(TEMBOO_ACCOUNT);
AppendValuesChoreo.setAppKeyName(TEMBOO_APP_KEY_NAME);
AppendValuesChoreo.setAppKey(TEMBOO_APP_KEY);
AppendValuesChoreo.setDeviceType(TEMBOO_DEVICE_TYPE);
// Set Choreo inputs
String RefreshTokenValue = "1//0dwIBXxP4MS0aCgYIARAAGA0SNwF-
L9IrsvcIXHjGalytU_Zu106Rk3JcmPuDOVvfJzECAaqdhGHbo7IA2JcBnWsnN1YqXxEavDA";
AppendValuesChoreo.addInput("RefreshToken", RefreshTokenValue);
String ClientSecretValue = "snhAuvV1cm-0fQZhNlmqIYSF";
AppendValuesChoreo.addInput("ClientSecret", ClientSecretValue); //was
String ValuesValue = "[[\"128\",\"78\"]]";
String ClientIDValue = "632132551130-
mldlj3fkv488iipdbk4i856jidoduo3c.apps.googleusercontent.com";
AppendValuesChoreo.addInput("ClientID", ClientIDValue);
String SpreadsheetIDValue =
"1m65zoW8xAAS1YdLIC38tV_NaBbAUirs4qkx3XVTBmyc";
AppendValuesChoreo.addInput("SpreadsheetID", SpreadsheetIDValue);
// Identify the Choreo to runAppendValuesChoreo.setChoreo("/Library/Google/Sheets/AppendValues");
// convert the time and sensor values to a json array
String rowData = "[[\"" + String(now) + "\", \"" + String(humidityData1)
+ "\", \"" + String(celData1) + "\", \"" + String(fehrData1) + "\", \"" +
String(hicData1) + "\", \"" + String(hifData1) + "\", \"" +
String(humidityData2) + "\", \"" + String(celData2) + "\", \"" +
String(fehrData2) + "\", \"" + String(hicData2) + "\", \"" + String(hifData2)
+ "\"]]";
// add the RowData input item
AppendValuesChoreo.addInput("Values", rowData);
// Run the Choreo; when results are available, print them to serial
AppendValuesChoreo.run();
while(AppendValuesChoreo.available()) {
char c = AppendValuesChoreo.read();
Serial.print(c);
}
AppendValuesChoreo.close();
}
Serial.println("\nWaiting...\n");
client.stop(); //added this 12/10/20, hopefully will stop the "no socket
available" problem
delay(30000); // wait 30 seconds between AppendValues calls
}You can also read