Groundwater Quality Evolution Model in the Ring of Cenotes, Yucatan, Mexico - Preprints.org
←
→
Page content transcription
If your browser does not render page correctly, please read the page content below
Preprints (www.preprints.org) | NOT PEER-REVIEWED | Posted: 15 January 2021 doi:10.20944/preprints202101.0283.v1

 Article

 Groundwater Quality Evolution Model in the Ring of Cenotes,
 Yucatan, Mexico
 Rosela Pérez-Ceballos 1,*, Cesar Canul-Macario 2, Roger Pacheco-Castro 2, Julia Pacheco-Ávila 3, Jorge Euán-Ávila 4
 and Martín Merino-Ibarra 5.

 1 Instituto de Ciencias del Mar y Limnología Estación El Carmen, UNAM, Carretera Carmen Puerto Real
 Km. 9.5, C.P. 24157 Cd. del Carmen, Campeche, México.
 2 Laboratorio de Ingeniería y Procesos Costeros, UNAM. Puerto de Abrigo S/N, UNAM, 97355, Sisal,
 Yucatán, México; ccanulm@iinge.unam.mx (C.C-M.), rpachecoc@iingen.unam.mx (R.P-C.)
 3 Universidad Autónoma de Yucatán, Facultad de Ingeniería, Ave. No contaminantes S/N.
 4 Centro de Investigación y de Estudios Avanzados del Instituto Politécnico Nacional, Km 6 Antigua
 Carreta a Progreso, Mérida, Yucatán, México.
 5 Unidad Académica de Ecología y Biodiversidad Acuática. Instituto de Ciencias del Mar y Limnología,
 Universidad Nacional Autónoma de México. Circuito exterior S/N, Ciudad Universitaria. Coyoacán. C. P.
 04510. Ciudad de México.
 * Correspondence: rosela.perezc@gmail.com

 Abstract: Karst aquifers show dissolution/precipitation processes of the minerals present in the car-
 bonate rocks. The Ring of Cenotes (RC) extends along the edge of the Chicxulub crater, in the lime-
 stone platform of the Yucatan Peninsula (YP), where groundwater shows preferential flow paths
 toward the coast near Celestun and Dzilam Bravo towns. This study aimed to describe the regional
 hydrogeochemical evolution of groundwater of the RC, and its association with the dissolution/pre-
 cipitation of the minerals present along its path to the ocean. To achieve this aim, we: a) character-
 ized groundwater's hydrogeochemistry; b) determined the calcite, dolomite, and gypsum saturation
 indexes (reaction phases with the groundwater) in the study area; c) proposed a hydrogeochemical
 model developed through PHREEQC using an inverse modelling approach. The model predictions
 confirmed that there are two evolution pathways of the groundwater consistent with the preferen-
 tial flow paths suggested in a previous regionalization of the RC. On the western path, where
 groundwater flows towards Celestun, an important marine intrusion influences the hydrogeochem-
 ical processes and represents a risk for the prevalence of freshwater. On the eastern path, where
 groundwater flows toward Dzilam Bravo, the hydrogeochemistry in the sinkholes correlates well
 with rainfall, suggesting a higher vulnerability during droughts than during rainy periods.

 Keywords: sinkholes; hydrogeochemistry; inverse modelling; rainfall; dissolution; PHREEQC

 1. Introduction
 Karstic aquifers represent about 20% of the earth's surface, and they are formed by
 the dissolution of carbonate rocks [1–3]. Coastal aquifers are often the main source of
 freshwater for human coastal settlements. They have a strong interaction with the sea, and
 their equilibrium depends both on natural hydrological forces (such as the hurricanes)
 and on anthropic activities (such as groundwater extractions) [4,5].
 Carbonate aquifers, such as the one in the Yucatan Peninsula (YP), show different
 karstification levels depending on the dominant carbonate rocks dissolution process [6].
 The YP aquifer shows characteristic karstic manifestations connected with groundwater
 (sinkholes, locally named cenotes) and does not exhibit surface runoff [7]. Regional
 groundwater flow paths in the YP are complex and have been proposed to depend on
 features and interactions at several scales: (a) regional geologic alignments such as the
 Ring of Cenotes (RC), and the Holbox Fracture Zone; (b) large dissolution conducts at

 © 2021 by the author(s). Distributed under a Creative Commons CC BY license.
Preprints (www.preprints.org) | NOT PEER-REVIEWED | Posted: 15 January 2021 doi:10.20944/preprints202101.0283.v1

 2 of 16

 subregional scale, and (c) small-scale fractures caused by weathering and the dissolution
 of limestone [8].
 The RC is located at the northwest of the YP, and it is formed by a high number of
 sinkholes that are aligned forming a semicircle, along which groundwater flows preferen-
 tially [8–10]. The RC is the surficial manifestation of the deep crater structure caused by
 the Chicxulub meteorite impact 66 Ma ago [11–13]. The main characteristic of the sink-
 holes of the RC is that they intercept the phreatic level of the regional aquifer [14]. Sink-
 holes are of great importance for human settlements because they have been an important
 source of water in YP since the Mayan era. Nowadays, sinkholes relate to productive ac-
 tivities, such as tourism, on which the income of populations within RC depends [9]. Be-
 sides, the discharge of the regional aquifer into the sea is a major component of the hydro-
 logic balance of the coastal lagoons and mangrove ecosystems of Celestun and Dzilam
 Bravo [15].
 The hydrogeochemistry of the RC suggests that groundwater interacts with the car-
 bonate rocks and exhibits a chemical evolution from the central recharge zone to its dis-
 charge ends on the coast [10]. Vertically, the coastal aquifer is characterized by a saline
 interface (halocline) at which the dissolution activity is maximal, and chemical exchange
 of calcium with other elements such as magnesium coming from intruded saline waters
 and carbonate rocks like dolomites occurs [16]. Such a phenomenon is more noticeable at
 the coastal zone of the RC. On the other hand, gypsum dissolves easier than calcite in the
 groundwater of the RC, especially in the areas close to the Sierrita de Ticul, which is the
 main physiographic feature of the YP, reaching 350 m a.s.l. [17–19].
 Earlier studies on the hydrogeochemistry of the water of the RC focused on the pres-
 ence of pollutants and hazardous substances of anthropic origin [20–23], as well as on the
 presence of sulfides, groundwater hardness and water salinization associated to the nat-
 ural dissolution of calcite and gypsum, and to the interaction with marine water
 [18,19,21,24]. Other studies are related to the hydrogeochemical evolution of the water
 quality of the YP at the regional level using an approach based on the chemical balance of
 major elements concentration and saturation indexes of the lithological phases [18,19,24].
 However, there are few studies on the hydrogeochemistry of the RC region that allow the
 identification of areas susceptible to natural dissolution of these elements and zones with
 higher saline intrusion by using inverse hydrogeochemical modelling.
 The large number of sinkholes distributed along the RC offers the opportunity to
 study the hydrogeochemical evolution of groundwater along the regional flow paths us-
 ing hydrogeochemical approaches. This work aims to understand the interaction of
 groundwater with the main lithological phases and to assess the dissolution and precipi-
 tation of minerals along the RC. Through analysing the concentration of major elements
 in groundwater, building hydrogeochemical diagrams, and using the inverse modelling
 software PHREEQC. Finally, we also assessed the proportion of seawater present in the
 groundwater samples of the sinkholes to understand how marine intrusion modifies the
 dissolution and precipitation of minerals. Understanding of such processes can help to
 implement management strategies at the RC for a better use of groundwater.

 2. Materials and Methods
 2.1. Study Zone
 The Ring of Cenotes (RC) is located in Mexico, at the northwest of the YP, between
 the parallels 88.5-90.5 °W, and latitudes 20.5-21.5 °N (
 ). The aquifer in the RC is unconfined, except for a coastal strip where variable hy-
 drogeological confinement occurs [24,25]. The hydraulic gradient is almost flat, and the
 regional groundwater flow is towards the coast [8,24,25]. The prevailing climate is wet-
 tropical, with an annual average temperature of about 26°C, with a minimum in Decem-
 ber and January and maximum during May to August [7]. The rainy season occurs be-
 tween Jun and October, while the period between November and May is drought. The
Preprints (www.preprints.org) | NOT PEER-REVIEWED | Posted: 15 January 2021 doi:10.20944/preprints202101.0283.v1

 3 of 16

 annual rainfall averages 1218 mm for the whole YP, while the potential evapotranspira-
 tion index is 1200 -1400 mm. Within the RC, the annual cumulative rainfall varies from
 500 mm in the north coast to 1200 mm in the south of the RC [26].
 Because of its water reserves and high biodiversity, the RC has been designated a
 RAMSAR site. Moreover, the RC is part of a state reserve containing 99 sinkholes that
 constitute a freshwater source for rural human settlements [9]. The RC lacks surficial run-
 off (rivers and creeks), and the aquifer has a high transmissivity, particularly along the
 alignment of karstic structures [8,24]. The regional flow paths of the RC discharge into
 two coastal lagoons: Ria Celestun and Bocas de Dzilam. This discharge helps maintain the
 health of the mangrove and seagrasses ecosystems that support a high diversity of wildlife
 of ecological and commercial importance [15].
 The surficial geology in the study area (see [18,27–30]) shows that the RC extends
 over four geological formations: (a) the Chichen Itzá formation composed by carbonate
 rocks from the Eocene, (b) rocks from the Oligocene, (c) the Carrillo Puerto formation
 composed by limestone from the Miocene-Pliocene, and (d) quaternary Pleistocene-Hol-
 ocene limestone along the coast (
 ). Geochemically, the RC has been regionalized [10] as shown in
 : (a) Region 1 (R1), located at the west of the RC, where sulfates, sodium and chlorides
 increase towards the coast, (b) Region 2 (R2), located at the south side of the RC near the
 Eocene formation, is where the recharge of the RC occurs, and (c) Region 3 (R3) at the east
 of the RC characterized by an increase of pH and chloride towards the coast.
 The surficial geology and the regional hydrogeochemistry [19,24] shows that calcite,
 gypsum, and dolomite are the most common minerals of the RC, and these solid phases
 interact with groundwater and with seawater from the marine intrusion [16]. Apparently,
 groundwater dissolves calcite, while sulfates and chloride increase along its flow to the
 coast, due to marine influence [19,24]. On the other hand, Velazquez [19] identified a sul-
 fate enrichment pathway in the Eocene aquifer and the influence of dolomites and gyp-
 sum. Graniel-Castro et al. [17] and Perry et al. [18] suggest that the Sierrita de Ticul is the
 main way whereby the dissolved sulfates –originated from gypsum dissolution due to
 weathering of the Icaiché formation– travel from the Chichancanab lagoon.
Preprints (www.preprints.org) | NOT PEER-REVIEWED | Posted: 15 January 2021 doi:10.20944/preprints202101.0283.v1

 4 of 16

 Figure 1. Study area of the Ring of Cenotes (RC). In the map, the surficial geology described by [28–30]. The sinkholes of
 the study area split into three regions (R1, R2, R3) according to [10].

 2.2. Field Measurements and Laboratory Analyses
 Water samples from 18 sinkholes selected using the regionalization proposed by [10]
 were collected during the four seasons: May-June 2006 (SP1), October-November 2006
 (SP2), February-March 2007 (SP3), and April-May 2008 (SP4). During each field survey,
 water samples were collected at three depth levels (0.5, 5.5, and 10.5 m) using a Kemereer
 bottle (WILCO®). However, to avoid bias due to variations in temperature, dissolved ox-
 ygen, pH, and suspended solids at the surficial levels, only the samples from the deeper
 level (10.5 m) were considered. In all cases, this water level was within the freshwater lens,
 above the halocline. Physical and chemical parameters were measured in situ using a mul-
 tiparametric probe (Hydrolab G-Quanta®). The concentrations of major elements (Na +,
 K+, Ca+2, Mg+2, Cl-, HCO3-, SO4-2, NO3-) were determined according to [31]. All water sam-
 ples had an ionic balance in the range of ±5% to ±10%.

 2.3. Hydrogeochemical Model of the RC
 2.3.1. Evolutionary Trajectories of the RC Groundwater
 Groundwater ternary hydrogeochemical diagrams were built to analyse the evolu-
 tion trajectories of the RC [32]. Dispersion diagrams based on the rSO4-2/rCl- ratio were
 plotted as well to identify the spatial patterns of sulfates and salinization in the CR [19,24].
 The conceptual model was based on the interactions between groundwater and the litho-
 logic solid phases along the regional groundwater flow path in the RC.

 2.3.2. Determination of saturation indexes (SI)
 Because of the low velocity of groundwater flow in the water-rock systems, previous
 studies have shown that groundwater in the Yucatan aquifer is near-equilibrium regard-
 ing calcite and dolomite [18,19,24], so that saturation indexes (SI) can be a good proxy of
Preprints (www.preprints.org) | NOT PEER-REVIEWED | Posted: 15 January 2021 doi:10.20944/preprints202101.0283.v1

 5 of 16

 the saturation level of these minerals [33]. Positive SI mean that the solution is oversatu-
 rated, and the mineral will show a tendency to precipitate. When SI is negative, the solu-
 tion is undersaturated, and the mineral will dissolve. If the index is near zero, then the
 solution is at equilibrium. Because it is uncommon to find solutions exactly at equilibrium,
 an equilibrium interval was assumed within 0.00 ± 0.05 % deviation from the log of K, the
 equilibrium constant [32,34]. SI estimation was carried out using the software PHREEQC
 3.0, which calculates SI from the molality and the activity coefficient of the dissolved spe-
 cies [35].
 Rainfall (H2O) with a high content of carbon dioxide (CO2) forms carbonic acid
 (H2CO3), which allows the dissolution of the carbonate rocks when it contacts surficial
 minerals [32], as described by reactions 1-4:

 2 + 2 → 2 3 (1)

 3 + 2 3 → +2 + 2 3− (2)

 ( 3 ).2 + 2 2 + 2 2 ↔ 4 3 − + +2 + +2 (3)

 ↔ 3 + 3 + 2 2 + 2 2
 4 ( 2 ).2 ↔ +2 + 4−2 + 2 2 (4)
 Although early studies showed that groundwater in the Yucatan aquifer is near-equi-
 librium regarding calcite and dolomite [18,19,24], the rate of dissolution/precipitation of
 these minerals over their trajectory to the coast has not been quantified yet. We describe
 this approach in the next sections.

 2.3.3. Groundwater mineral precipitation/dissolution rate modelling
 The estimation of the dissolution and precipitation rates in the sinkholes water was
 carried out using the inverse modelling module implemented in the PHREEQC 3.0 soft-
 ware [35]. Inverse modelling is based on the initial and final chemical compositions of a
 solution along a flow line, as well as on the minerals and gases present in the environment,
 using the mass balance approach. The results obtained are estimates of seawater mixing
 proportions and potential mass transfers from the lithological solid phases considered
 (mmol kg-1H2O) [35].
 Using the RC regionalization proposed by [10], two trajectories were analysed using
 inverse modelling: (a) toward Celestun and (b) toward Dzilam Bravo. The inverse model
 was implemented in two segments for each trajectory: the first was from the recharge re-
 gion (R) to the middle point of each trajectory (MC and MD), and the second from the
 middle point to the respective coastal zone C and D, Fig. 2).

 Figure 2. Conceptual diagram of the evolution trajectories for the RC groundwater inverse models.

 Average ion concentrations in the sinkholes were considered (Table 1, excluding
 NO3-) for the inverse modelling. For the recharge area R, concentrations of sinkholes 8, 10-
Preprints (www.preprints.org) | NOT PEER-REVIEWED | Posted: 15 January 2021 doi:10.20944/preprints202101.0283.v1

 6 of 16

 14 were averaged. For MC, concentrations of sinkholes 6, 7 and 9 were averaged. For MD,
 concentrations from sinkholes 15-16 were used. In the case of the coastal areas, the average
 of concentrations from sinkholes 1-5 was used for C, and the average of concentrations
 from sinkholes 19, 20, 21 for D. Calcite, dolomite, and gypsum were considered as the
 lithological solid phases [18,19,24]. Additionally, marine water solution was included to
 simulate the marine influence within the aquifer towards the coast [36]. Finally, O2 and
 CO2 phases were also included in the model as suggested in Eq. 1 (Fig. 1 y Fig. 2).
 For convergence, the model considered a global uncertainty of 0.10. All possible wa-
 ter-rock interactions were considered. The best solution was selected based on the smaller
 molal balance residual, previously estimated by the simplex method implemented in
 PHREEQC [35].

 Table 1. Average concentrations for the representative samples. NO3- was excluded from the inverse modelling.

 CE O2 Ca+2 Mg+2 Na+ K+ HCO3- Cl- SO4-2 NO3- (mg
 SP Region T (°C) pH
 (µS cm-1) (mg L-1) (mg L ) (mg L-1)
 -1
 (mg L ) (mg L-1)
 -1
 (mg L-1) (mg L-1) (mg L-1) L-1)
 C 26.93 6.79 2696 7.93 155.81 77.72 283.72 9.94 411.48 589.61 230.40 3.59
 MC 27.45 6.63 1790 3.38 140.97 64.56 141.10 5.40 403.15 294.06 252.00 6.17
 1 R 25.93 6.71 1030 2.42 98.86 46.30 55.00 4.11 417.51 128.98 23.66 10.35
 MD 26.68 6.57 1278 0.65 105.21 86.25 88.50 3.10 570.96 202.77 27.00 0.57
 D 26.38 6.61 1350 0.71 112.37 44.10 113.73 5.10 417.24 244.26 34.00 0.78
 C 27.06 7.89 2764 1.03 131.30 87.48 264.00 9.52 423.49 539.70 312.07 10.24
 MC 27.44 6.36 1812 3.36 120.81 74.12 137.70 5.10 432.02 274.15 242.76 5.54
 2 R 26.13 6.85 1058 3.07 88.25 46.86 53.78 4.01 432.61 119.31 18.24 13.04
 MD 26.85 6.57 1370 0.15 98.18 52.09 85.50 3.20 488.83 187.36 24.58 10.50
 D 26.67 8.24 1531 0.21 100.41 52.92 121.82 5.25 453.72 255.67 27.72 4.40
 C 26.70 7.11 2614 2.88 138.04 74.43 396.19 10.84 412.70 539.89 266.35 6.68
 MC 27.17 7.06 1564 4.98 115.47 58.60 102.06 4.62 422.61 218.00 137.24 12.69
 3 R 25.65 7.08 1056 4.41 88.60 48.16 49.93 4.95 428.10 123.61 22.63 11.25
 MD 26.31 7.50 1326 5.98 91.83 51.52 67.83 3.16 464.87 151.98 26.00 11.58
 D 25.80 7.09 1630 0.96 97.15 56.29 106.71 7.00 417.92 238.46 54.62 6.62
 C 27.06 6.89 2736 2.60 203.20 86.11 295.00 10.11 443.51 550.44 284.82 13.72
 MC 27.41 6.99 1794 3.17 165.80 74.95 143.54 5.39 405.76 282.93 191.17 17.70
 4 R 26.28 6.98 1083 3.39 119.79 66.60 61.70 2.51 435.28 166.33 25.36 13.94
 MD 26.80 6.82 1323 1.36 139.86 73.48 90.09 3.48 420.31 189.54 143.32 9.63
 D 26.24 7.68 1637 0.42 137.34 71.57 145.41 6.65 400.18 287.74 161.75 9.20

 3. Results
 3.1. Hydrogeochemical Evolution of the Groundwater of the RC
 Major ion concentrations in the RC showed two different evolution trajectories to-
 ward the coastal areas of Celestun and Dzilam Bravo (Figs. 3 and 4).
 In the Celestun trajectory, an increase of the concentration of sulfates segment was
 observed on R-MC for all the surveys (Fig. 3). This behaviour is coincident with previous
 findings for the Eocene aquifer near Ticul [19,24]. In the MC-C segment, an increase of
 chloride concentration was also observed, revealing marine influence and groundwater
 salinization near Celestun [19].
 Figs. 3a-3c show an increasing chlorides concentration towards the coast in the tra-
 jectory to Dzilam Bravo (samplings SP1 to SP3), as well as decreasing calcium concentra-
 tion. Particularly, Fig. 3d shows an increase in sulfates concentration in R-MD, similar to
 the Celestun R-MC trajectory. Saturation indexes of calcite, dolomite, and gypsum (SI c, SId
 y SIg, respectively) are shown in Figs. 4a-4c. SI showed equilibrium for calcite (-0.424 < SIc
 < 0.424) and dolomite (-0.416 < SId < 0.416) at all samples from R. On the middle points
 (MC y MD), most of the samples were also in equilibrium with calcite (-0.424 < SIc < 0.424)
 and dolomite (-0.416 < SId < 0.416); the only exceptions were the MC sample, which was
 undersaturated for dolomite (SId = -0.74) during survey SP2 and oversaturated during SP3
Preprints (www.preprints.org) | NOT PEER-REVIEWED | Posted: 15 January 2021 doi:10.20944/preprints202101.0283.v1

 7 of 16

 (SId = 0.64), and sample MD from survey SP3 which was oversaturated for both calcite (SIc
 = 0.67) and dolomite (SId = 1.45). Point C showed chemical equilibrium with calcite (-0.424
 < SIc < 0.424), except for the sample from SP2 (SIc = 1.05), while dolomite showed oversat-
 uration in SP2 and SP3 (SId = 2.29 and 0.69, respectively). Point D showed oversaturation
 with calcite in SP2 and SP4 (SIc = 1.39 and 0.88, respectively) and with dolomite in SP2,
 SP3, and SP4 (0.56 < SId < 2.87). All samples showed the potential to dissolve gypsum, but
 it was more notable in the R sample (SIg < -0.229, Fig. 4c). The recharge zone showed chem-
 ical balance with calcite and dolomite but towards the coast dolomite may precipitate,
 while gypsum may be dissolved at any point of the trajectories described.
 Marine influence was stronger in Celestun as compared with Dzilam Bravo. Point C
 showed a seawater proportion between 1.0 and 1.9 % (SP2 and SP3 respectively), while
 point D showed a percentage range of 0.2 to 0.5 % (SP1 and SP2 respectively Fig. 4). Pérez-
 Ceballos et al. [10] described such behaviour in their regionalization, and it was also sup-
 ported by the results observed in SP4.

 Figure 3. Ternary diagram of calcium, chlorides and sulfates (Ca+2, Cl-, SO4-2) and their gain trajectories in the RC. (a) SP1
 May-June 2006, (b) SP2 October-November 2006, (c) SP· February-March 2007, and (d) SP4 April-May 2008.
Preprints (www.preprints.org) | NOT PEER-REVIEWED | Posted: 15 January 2021 doi:10.20944/preprints202101.0283.v1

 8 of 16

 Figure 4. Saturation indexes for (a) Calcite, (b) Dolomite, and (c) Gypsum. (d) The percentage of seawater mixed with the
 groundwater. The dotted lines show the balance interval for calcite and dolomite. The mineral values under the lower
 limit are not shown. In the Figure, Recharge zone (R), middle Celestun (MC), the coast of Celestun (C), middle Dzilam
 Bravo (MD), the coast of Dzilam Bravo (D).

 Finally, the rSO4-2/rCl- ratio showed that groundwater hydrogeochemical evolution
 was consistent with the regional trajectories of the YP's aquifer [19,24]. The trajectory to-
 wards Celestun showed sulfate enrichment, likely a product of the gypsum dissolution,
 while the trajectory towards Dzilam Bravo showed only seawater enrichment (Fig. 5).
Preprints (www.preprints.org) | NOT PEER-REVIEWED | Posted: 15 January 2021 doi:10.20944/preprints202101.0283.v1

 9 of 16

 Figure 5. Hydrogeochemical evolutionary trajectories based on the ratio rSO 4-2/rCl-1 suggested by [19], [24]. (a) SP1, (b)
 SP2, (c) SP3 and (d) SP4.

 3.2. Groundwater-Rock Interaction in RC
 The analysis of the chemical evolution along the trajectories and the SI explained the
 regional spatial distribution of the water quality in the RC. However, this approach only
 considered the potential for dissolution of each of the minerals without considering cou-
 pled interactions. Conversely, inverse modelling (fed with the information of the litholog-
 ical phases) allowed prediction of the dissolution/precipitation rates of these minerals,
 considering the known concentration in the water samples (Table 1). The optimal hydro-
 geochemical model was selected using the criterion of smaller molal residual. This model
 shows the calcite-dolomite-gypsum interaction additionally to the interaction of oxygen
 and carbon dioxide as phases of the balance. There were fewer model solutions to explain
 the evolutionary trajectories from R to MC and MD compared with the number of solu-
 tions found from MC and MD to C y D, respectively.
 In the trajectory towards Celestun, our results indicate calcite precipitation and gyp-
 sum and dolomite dissolution on the intermediate segment (R-MC). In contrast, on the
 segment towards the coast (MC-C), the gypsum and dolomites showed a decreased
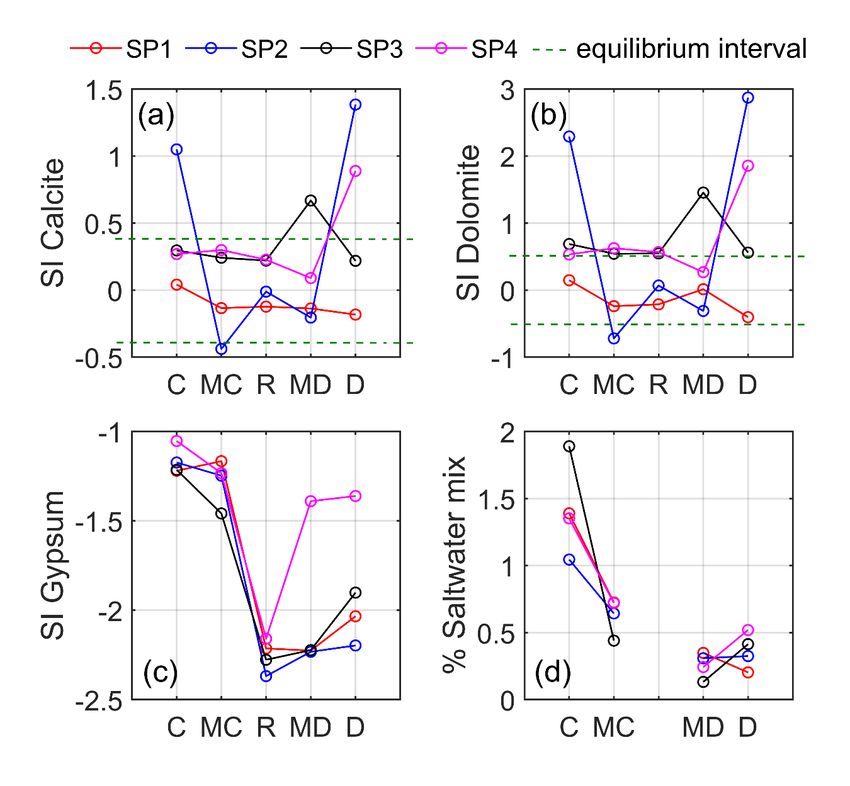
Preprints (www.preprints.org) | NOT PEER-REVIEWED | Posted: 15 January 2021 doi:10.20944/preprints202101.0283.v1

 10 of 16

 dissolution activity (these minerals even precipitated), and calcite had a potential disso-
 lution rate greater than the remaining lithological phases. On the R-MC, the precipitation
 of calcite was consistently indicated on all the surveys (SP1-SP4), showing activity rates
 between -0.42 and -2.048 mmol kg-1H2O (Fig. 6a). The potential dissolution activity rate of
 dolomite and gypsum was in the range of 0.04-1.05 and 1.06-1.99 mmol kg-1H2O, respec-
 tively (Fig. 6b y 6c). Finally, on the segment MC-C the calcite showed average potential
 dissolution rates of 0.71 mmol kg-1H2O for the surveys SP1 and SP4, while for surveys SP2
 and SP3, the average precipitation was 0.23 mmol kg-1H2O (Fig. 6a). The potential dissolu-
 tion activity rate of dolomite showed a decreasing trend (0.07 y 0.14 mmol kg-1H2O, surveys
 SP2 and SP3), smaller than those observed on the segment R-MC, and we even observed
 potential precipitation of this mineral in surveys SP1 and SP4 (activity rates between -0.12
 and -0.14 mmol kg-1H2O, Fig. 6b). Similarly, gypsum showed a reduced potential dissolu-
 tion activity on the segment MC-C, contrasting with the segment R-MC. Gypsum poten-
 tial dissolution rates ranged between 0.38 to 0.71 mmol kg-1H2O (surveys SP2 to SP4), and
 in survey SP1 precipitated at the activity rate of -0.6 mmol kg-1H2O (Fig. 6c).
 On the Dzilam Bravo trajectory, the intermediate segment (R-MD) showed small po-
 tential activity and precipitation of gypsum and dolomite. The calcite precipitation
 showed potential activity between -0.8 and -1.5 mmol kg-1H2O, except during SP2, which
 showed a potential dissolution rate equal to 0.056 mmol kg-1H2O (Fig. 6a). The activity rate
 of dolomite was in the range of 0.2-1.46 mmol kg-1H2O and less activity of gypsum (precip-
 itation rate between -0.006 and -0.02 mmol kg-1H2O, Fig. 6b). During SP4, the dissolution
 rate of gypsum was 1.16 mmol kg-1H2O (Fig. 6c). Toward the coast (MD-D), enrichment
 with calcite was revealed, while the dolomite and gypsum showed less activity, except
 during SP4 where we observed enrichment and precipitation of these minerals. On this
 segment, the calcite dissolution activity increased (0.04 to 2.33 mmol kg-1H2O, Fig. 6a), while
 the dolomite precipitation activity was between -0.21 and -1.97 mmol kg-1H2O, and little
 activity of gypsum (dissolution rate = 0.07-0.18 mmol kg-1H2O, Fig. 6b). The precipitation
 rate of gypsum during SP2 was 0.06 mmol kg-1H2O (Fig. 6c).
 There was less calcite activity on the segments R-MC and R-MD (for both trajectories:
 Celestun and Dzilam Bravo) than on the coastal zone (calcite dissolution increased along
 MC-C y MD-D). The dissolution of dolomite was consistent on the segments R-MC and
 R-MD and higher than the activity rates and precipitation towards the coast (MC-C and
 MD-D). The hydrogeochemical inverse model predicted the Eocene aquifer's influence
 with inputs of dissolved dolomite in the groundwater, as described by [19]. At the coast,
 the process of dolomite precipitation (dolomitization) was due mainly to chemical ex-
 change with cations such as Mg+2 available in the ground and from mixing of the regional
 aquifer with marine water. Such a process has been previously described for the coastal
 area of YP by [16,37,38].
 Regarding the trajectory of gypsum towards Celestun, a constant enrichment of this
 mineral on the segment R-MC was observed, which matches the trajectories of sulfates
 dissolution described by [19,24]. On the trajectory to Dzilam Bravo, this mineral showed
 little activity as compared to the other lithological phases. However, an atypical behaviour
 in the samples from SP4 survey was found, which showed high gypsum concentrations
 on the segment R-MD, similar to those in segment R-MC (Fig. 6c).
Preprints (www.preprints.org) | NOT PEER-REVIEWED | Posted: 15 January 2021 doi:10.20944/preprints202101.0283.v1

 11 of 16

 Figure 6. Dissolution/precipitation rates of Calcite (a), Dolomite (b), and Gypsum (c) in the RC. Positive values indicate
 dissolution and negative values indicate mineral precipitation.

 4. Discussion
 The RC showed two different hydrogeochemical evolutions along the trajectories
 from the recharge zone towards the coastal zones of Celestun (R-MC-C) and Dzilam Bravo
 (R-MD-D). These hydrogeochemical groundwater evolutions were suggested by the ter-
 nary diagrams and the ratio rSO4-2/rCl-, and confirmed through inverse modelling.
 Celestun trajectory showed an increase of sulfates associated with the dissolution of
 the gypsum's Eocene aquifer and towards the coast also likely related to seawater mixing
 caused by marine intrusion. The dissolution of gypsum in R-MC was indicated in all of
 our surveys, which is consistent with the results of Perry et al. [18,24,27], who posed that
 sulfates originate from gypsum dissolution at the Chichancanab lagoon and move
 through the Ticul fault. The segment R-MC showed chemical equilibrium for calcite and
 dolomite, and undersaturation for gypsum (Fig. 4). Additionally, gypsum and dolomite
 dissolution as well as calcite precipitation were observed. This combination of processes
 is also known as dedolomitization [39], and is closely related to coupled variations of Mg+2
 and Ca+2 concentrations in the groundwater of the YP's aquifer [23]. In the coastal segment
 of this trajectory (MC-C), gypsum and dolomite showed a decreasing activity (and even
 precipitation during SP1, Fig. 6b y 6c); but also calcite dissolution and marine water influ-
 ence (Fig. 4d y 6a). Conceptual models [16,37] also predict dolomite precipitation (dolo-
 mitization) in the presence of brackish water through lattice replacement with Mg+2 from
 seawater [40]. Overall, the inverse modelling implemented in this work is in agreement
 with earlier conceptual models proposed by [16,18,19,23,24,37,39] and supports them.
 Dzilam Bravo trajectory also showed salinization toward the coast, although less in-
 tense than in the Celestun trajectory (Fig. 4d). Calcite was the lithological phase showing
 higher activity along the Dzilam trajectory, contrasting with gypsum and dolomite. While
 calcite apparently precipitated on the R-MD segment, later it dissolved on the MD-D seg-
 ment (Fig. 6a), which was likely favoured by the higher influence of seawater towards the
 coast [16]. On the other hand, gypsum activity, which was overall lower in this trajectory,
 increased to levels as high as those found along the Celestun trajectory (Fig. 4 y 6) during
 SP4, when rainfall was lowest at Dzilam Bravo (Fig 7). This showed a pattern -consistent
 with [18,19,24,27], who suggested that gypsum dissolved by weathering of the older for-
 mations (Eocene and Paleocene) travels toward the RC- which is apparently blurred by
 the stronger rainfall along this trajectory.
Preprints (www.preprints.org) | NOT PEER-REVIEWED | Posted: 15 January 2021 doi:10.20944/preprints202101.0283.v1

 12 of 16

 Figure 7. Average rainfall during the two months of each sampling survey (SP1, SP2, SP3, and SP4) for Celestun (C), the
 Recharge zone (R) and Dzilam Bravo (D).

 The importance of rainfall for Dzilam Bravo is further outlined by the significant and
 strong inverse correlation found for seawater mixing with rainfall in this trajectory (Fig.
 8b), showing the effect of rainfall variations on the marine intrusion there. In contrast,
 although seawater mixing was higher at Celestun, it did not correlate significantly with
 rainfall. Similarly, the SI of gypsum did not correlate significantly for Celestun trajectory,
 but it did with rainfall for the Dzilam trajectory (Fig. 8, SIg determination coefficient R2 >
 0.5).

 Figure 8. Correlation of seawater percentage mixing and saturation index of gypsum (SIg) with the rainfall previous to
 SP1, SP2, SP3 and SP4, for: (a) the Celestun trajectory (R-MC-C) and, (b) the Dzilam Bravo trajectory (R-MD-D).

 Furthermore, correlations of the dissolution/precipitation rates here assessed with
 rainfall were also stronger for Dzilam. For the Celestun trajectory only gypsum´s corre-
 lated (inversely) with rainfall. In contrast, all the rates correlated for the Dzilam flow.
Preprints (www.preprints.org) | NOT PEER-REVIEWED | Posted: 15 January 2021 doi:10.20944/preprints202101.0283.v1

 13 of 16

 Calcite dissolution/precipitation correlated directly with rainfall, while inverse correla-
 tions were obtained for dolomite and gypsum (Fig 9, R2>0.5). This suggests that the aqui-
 fer's recharge associated with the rainfall it is an important effect on the hydrogeochemical
 model for the Dzilam Bravo trajectory, similarly to the findings of [23,21]. However,
 Celestun showed a higher potential transference rate from the lithological phases as com-
 pared with Dzilam Bravo due to higher influence of marine water. Thus, the hydrogeo-
 chemistry of Celestun is more closely related to seawater mixing, as opposed to Dzilam
 Bravo, where rainfall is more important.

 Figure 9. Correlation of the potential precipitation/dissolution rates for calcite, dolomite, and gypsum with the rainfall
 previous to SP1, SP2, SP3 and SP4, for: (a) the Celestun trajectory (R-MC-C) and, (b) the Dzilam Bravo trajectory (R-MD-
 D).

 This higher seawater mixing towards Celestun relative to Dzilam Bravo could be re-
 lated to coastal differences among these two sites. Along the Yucatán's coast, the confine-
 ment effect influences the interaction between marine water and the aquifer, affecting the
 coastal aquifer's salinity [25,41,42]. Because the coastal confinement effect extends about
 20 km towards Celestun but about 3 km toward Dzilam Bravo [24,43], it likely allows a
 higher interaction between groundwater and seawater in Celestun, which results in the
 higher precipitation rate of gypsum and dolomite, and the higher seawater mixing as com-
 pared to Dzilam Bravo.
 Therefore, saline intrusion on the Celestun trajectory could have a significant effect
 on the RC water quality, adding up to the impacts caused by increasing human popula-
 tion, tourism and industrial development, as well as sea rise level driven by climate
 change [44,45]. Because of this higher vulnerability of the RC groundwater on the Celestun
 trajectory, we here highlight the importance of establishing a permanent salinization mon-
 itoring program on the Celestun trajectory, with higher priority during the winter months,
 when atypical meteorological tides are caused by cold fronts [10,42]. In this regard, chlo-
 rides should be monitored on segment MC-C (about 70 km from the shoreline), while
 sulfates are of particular concern in segment MC-R (cenotes 6, 7, 9). We also propose mon-
 itoring sulfates during the dry season for Dzilam Bravo because of the increase of sulfates
 activity during lower rainfall periods. We recommend monitoring along the MD-D seg-
 ment (cenotes 17 and 19) located at 20 km from the shoreline, and in R-MD (cenotes 10 to
 16) located 30 to 62 km from the Dzilam Bravo's shoreline.
 The high concentrations of sulfate we found in the recharge zone (R) of the RC have
 a natural origin in the dissolution of gypsum from the Eocene formations. However, ear-
 lier studies reported high concentrations in wells drilled near Ticul, and that agricultural
 practices in the area likely also contribute to the increasing sulfates concentration [17,23],
 which could in short time become unacceptable for human populations [46]. For example,
 it is known that sulfates may have a laxative effect when combined with Ca +2 and Mg+2
 [46,47], and both ions are also present in the RC. Therefore, the cenotes at the recharge
Preprints (www.preprints.org) | NOT PEER-REVIEWED | Posted: 15 January 2021 doi:10.20944/preprints202101.0283.v1

 14 of 16

 zone must also be monitored, especially during the dry season, when gypsum interaction
 is higher (Fig. 8 y 9).
 Finally, we would like to briefly outline the advantages of the inverse model here
 used over the SI analyses derived from its capability to analyse the lithological phases in
 a coupled way, producing more detailed predictions. For example, the SIg suggested gyp-
 sum dissolution all along the Celestun trajectory (Fig. 4) but the inverse model predicted
 a decrease of gypsum's activity and even its precipitation at the MC-C segment. Addition-
 ally, the inverse model allowed identifying the occurrence of dolomitization at R-MC. Al-
 together, our results sustain the usefulness of this approach for assessing the evolution of
 groundwater´s hydrogeochemistry and quality.

 5. Conclusions
 Groundwater in the RC flows along two different evolution trajectories. Both begin
 at the RC's recharge zone and travel towards the coastal towns of Celestun and Dzilam
 Bravo.
 In the Celestun trajectory, gypsum inputs from the Eocene aquifers were detected,
 which then precipitate due to mixing with seawater towards the coast. The marine intru-
 sion there influences the dissolution and precipitation processes of the lithological phases
 showing dedolomization in the middle segment of the trajectory (R-MC) and dolomiza-
 tion in the coastal one (MC-C).
 In the trajectory towards Dzilam Bravo, calcite precipitation/dissolution processes
 were more active than for gypsum and dolomite, and correlated directly with the rainfall.
 Groundwater with higher gypsum concentration due to the weathering on the Eocene
 formations was observable only during the lower rainfall sampling.
 The higher intensity of marine intrusion (up to 2% of seawater) in the Celestun tra-
 jectory than in the Dzilam Bravo trajectory, in possibly due to a differential confinement
 effect along the coast. Marine intrusion in Celestun trajectory barely changes with rainfall,
 while in the coastal zone of Dzilam Bravo it clearly variates inversely with rainfall.
 Both regional flow trajectories of the RC are vulnerable to climate change effects, such
 as sea level rise, because hydrogeochemical processes there are affected by the interaction
 with seawater, but Celestun is likely more susceptible to the rising sea level. In contrast,
 Dzilam Bravo can be affected by changes in the rainfall patterns because hydrogeochem-
 ical processes there depend more on the aquifer's recharge. Monitoring of marine intru-
 sion and phases dissolution in the RC is highly recommended to assess the evolution of
 the system, and could simply be done through chlorides and sulfates measurements.

 Author Contributions: The manuscript was written through the contributions of all authors. All
 authors have read and agreed to the published version of the manuscript.
 Funding: This research received no external funding.
 Acknowledgments: R P-C and R P-C are CONACyT research fellows commissioned to the Univer-
 sidad Nacional Autónoma de México. We are grateful to Victor Coronado Peraza, Armando
 Cabrera-Sansores, Arturo Zaldívar-Jiménez, Grisell Marrufo for their technical assistance with the
 sampling.
 Conflicts of Interest: We declare that there is no conflict of interest and that all co‐authors have seen
 and approved the current version for submission.
Preprints (www.preprints.org) | NOT PEER-REVIEWED | Posted: 15 January 2021 doi:10.20944/preprints202101.0283.v1

 15 of 16

 References
 1. Hartmann, A.; Goldscheider, N.; Wagener, T.; Lange, J.; Weiler, M. Karst water resources in a changing world: Review of hy-
 drological modeling approaches. Rev. Geophys. 2014, 52, 218–242, doi:10.1002/2013RG000443.
 2. Stevanović, Z. Karst Aquifers—Characterization and Engineering; Stevanović, Z., Ed.; Professional Practice in Earth Sciences;
 Springer International Publishing: Cham, 2015; ISBN 978-3-319-12849-8.
 3. Ford, D.; Williams, P. Karst Hydrogeology and Geomorphology; 2013; ISBN 9781118684986.
 4. Post, V.E.A.; Werner, A.D. Coastal aquifers: Scientific advances in the face of global environmental challenges. J. Hydrol. 2017,
 551, 1–3, doi:10.1016/j.jhydrol.2017.04.046.
 5. Werner, A.D.; Bakker, M.; Post, V.E.A.; Vandenbohede, A.; Lu, C.; Ataie-Ashtiani, B.; Simmons, C.T.; Barry, D.A. Seawater
 intrusion processes, investigation and management: Recent advances and future challenges. Adv. Water Resour. 2013, 51, 3–26,
 doi:10.1016/j.advwatres.2012.03.004.
 6. Perry, E.; Paytan, A.; Pedersen, B.; Velazquez-Oliman, G. Groundwater geochemistry of the Yucatan Peninsula, Mexico: Con-
 straints on stratigraphy and hydrogeology. J. Hydrol. 2009, 367, 27–40, doi:https://doi.org/10.1016/j.jhydrol.2008.12.026.
 7. CONAGUA Programa Hídrico Regional Visión 2030 (Regional Hydric Program: 2030 Vision); Ciudad de México, CDMX, 2012;
 8. Bauer-Gottwein, P.; Gondwe, B.R.N.; Charvet, G.; Marín, L.E.; Rebolledo-Vieyra, M.; Merediz-Alonso, G. Review: The Yucatan
 Peninsula karst aquifer, Mexico. Hydrogeol. J. 2011, 19, 507–524, doi:10.1007/s10040-010-0699-5.
 9. Gobierno del Estado de Yucatan Decreto número 117 -Reserva estatal geohidrológica del Anillo de Cenotes; 2013;
 10. Pérez-Ceballos, R.; Pacheco-Ávila, J.; Euán-Ávila, J.I.; Hernández-Arana, H. Regionalization based on water chemistry and
 physicochemical traits in the ring of Cenotes, Yucatan, Mexico. J. Cave Karst Stud. 2012, 74, 90–102, doi:10.4311/2011es0222.
 11. Hildebrand, A.R.; Penfield, G.T.; Kring, D.A.; Pilkington, M.Z.; Camargo, A.; Stein, B.J.; Boynton, W. V Geology Chicxulub
 Crater : A possible Cretaceous / Tertiary boundary impact crater on the. Geology 1991, 19, 867–871, doi:10.1130/0091-
 7613(1991)019
Preprints (www.preprints.org) | NOT PEER-REVIEWED | Posted: 15 January 2021 doi:10.20944/preprints202101.0283.v1

 16 of 16

 27. Perry, E.; Velazquez-Oliman, G.; Leal-Bautista, R.M.; Sánchez-Sánchez, J.; Wagner, N. Aspects of the Hydrogeology of southern
 Campeche and Quintana Roo, Mexico. Boletín la Soc. Geológica Mex. 2021, 73,
 doi:http://dx.doi.org/10.18268/BSGM2020v73n1a011020.
 28. SGM Carta geológico-minera Calkiní: F15-9-12; Pachuca, Hidalgo, México, 2005;
 29. SGM Carta geológico-minera Tizimín: F16-7; Pachuca, Hidalgo, México, 2006;
 30. SGM Carta geológico-minera Mérida: F16-10; Pachuca, Hidalgo, México, 2006;
 31. APHA-AWWA Standard Methods for the Examination of Water and Wastewater, 21st edn. American Public Health Association/Ameri-
 can Water Works Association/Water Environment Federation, Washington, DC, USA. plant performance; APHA, AWWA, WEF, Eds.;
 21th ed.; APHA-AWWA-WEF: Washignton DC. USA, 2005;
 32. Appelo, C.A.J.; Postma, D. Geochemistry, Groundwater and Pollution; Appelo, C.A.J., Postma, D., Eds.; 2nd ed.; CRC Press, 2004;
 ISBN 9780429152320.
 33. Martinez, D.E.; Bocanegra, E.M.; Manzano, M. La modelacion hidrogeoquimica como herramienta en estudios hidrogeologicos.
 Bol. Geol. y Min. 2000.
 34. Custodio, E.; Llamas, M. Hidrología Subterránea; OMEGA, Ed.; OMEGA: Barcelona, España, 1976; ISBN 8428204462.
 35. Parkhurst, D.L.; Appelo, C.A.J. PHREEQC (Version 3)-A Computer Program for Speciation, Batch-Reaction, One-Dimensional
 Transport, and Inverse Geochemical Calculations. Model. Tech. B. 6 2013, doi:Rep. 99-4259.
 36. Pytkowicz, R.; Kester, D. The Physical Chemistry of Seawater. In Oceanogr. Mar. Biol. Ana. Rev. 9; H. Barnes; George Allen y
 Unwin Ltd., Ed.; H. Barnes; George Allen y Unwin Ltd.: London, UK, 1971; pp. 11–60.
 37. Back, W.; Hanshaw, B.B. Comparison of aqueous geochemistry of the carbonate peninsulas of Florida and Yucatan. Geol. Soc.
 Am. 1963, 121, 15–16.
 38. USGS Geological Survey research 1970, Chapter A; Washington, D.C., 1970;
 39. Bischoff, J.L.; Juliá, R.; Shanks III, W.C.; Rosenbauer, R.J. Karstification without carbonic acid: Bedrock dissolution by gyp-
 sum-driven dedolomitization. Geology 1994, 22, 995–998, doi:10.1130/0091-7613(1994)0222.3.CO;2.
 40. Bąbel, M.; Schreiber, B.C. 9.17 - Geochemistry of Evaporites and Evolution of Seawater. In Treatise on Geochemistry (Second Edi-
 tion); Holland, H.D., Turekian, K.K., Eds.; Elsevier: Oxford, 2014; pp. 483–560 ISBN 978-0-08-098300-4.
 41. Canul-Macario, C.; Salles, P.; Hernández-Espriu, J.A.; Pacheco-Castro, R. Empirical relationships of groundwater head–salinity
 response to variations of sea level and vertical recharge in coastal confined karst aquifers. Hydrogeol. J. 2020, 28, 1679–1694,
 doi:10.1007/s10040-020-02151-9.
 42. Valle-Levinson, A.; Mariño-Tapia, I.; Enriquez, C.; Waterhouse, A.F. Tidal variability of salinity and velocity fields related to
 intense point-source submarine groundwater discharges into the Coastal Ocean. Limnol. Oceanogr. 2011, 56, 1213–1224,
 doi:10.4319/lo.2011.56.4.1213.
 43. Batllori Sampedro, E.; González Piedra, J.I.; Díaz Sosa, J.; Febles Patrón, J.L. Caracterización hidrológica de la región costera
 noroccidental del estado de yucatán, MÉXICO. Investig. Geogr. 2006, 59, 74–92, doi:10.14350/rig.30022.
 44. IPCC IPCC Workshop on Sea Level Rise and Ice Sheet Instabilities; 2010; ISBN 9789291691302.
 45. Church, J.A.; Clark, P.U.; Cazenave, A.; Gregory, J.; Jevrejava, S.; Lebermann, A.; Merrifield, M.; Milne, G.; Nerem, R.S.; Nunn,
 P.; et al. Sea Level Change. In Climate Change 2013: The Physical Science Basis. Contribution of Working Group I to the Fifth Assessment
 Report of the Intergovernmental Panel on Climate Change; Jouzel, J., van de Wal, R., Woodworth, P., Xiao, C., Eds.; Cambridge
 University Press: New York, USA, 2013; p. 227.
 46. WHO - World Health Organization Guidelines for drinking-water quality; 2017; ISBN 9241546964.
 47. DOF, D.O. de la F. NORMA Oficial Mexicana NOM-127-SSA1-1994, Salud ambiental, agua para uso y consumo humano-
 Límites permisibles de calidad y tratamientos a que debe someterse el agua para su potabilización. Última reforma publicada DOF
 03-02-1995 2000.
You can also read