Long term demise of sub Antarctic glaciers modulated by the Southern Hemisphere Westerlies
←
→
Page content transcription
If your browser does not render page correctly, please read the page content below
www.nature.com/scientificreports
OPEN Long‑term demise of sub‑Antarctic
glaciers modulated by the Southern
Hemisphere Westerlies
Jostein Bakke1,2,7*, Øyvind Paasche1,3,7, Joerg M Schaefer4 & Axel Timmermann5,6
The accelerated melting of ice on the Antarctic Peninsula and islands in the sub-Antarctic suggests
that the cryosphere is edging towards an irreversible tipping point. How unusual is this trend of ice loss
within the frame of natural variability, and to what extent can it be explained by underlying climate
dynamics? Here, we present new high-resolution reconstructions of long-term changes in the extents
of three glaciers on the island of South Georgia (54°S, 36°W), combining detailed analyses of glacial-
derived sediments deposited in distal glacier-fed lakes and cosmogenic exposure dating of moraines.
We document that the glaciers of South Georgia have gradually retracted since the Antarctic cold
reversal (ACR, 14.5–12.8 ka), culminating in the disappearance of at least one of the reconstructed
glaciers. The glacier retreat pattern observed in South Georgia suggests a persistent link to summer
insolation at 55°S, which intensified during the period from the ACR to approximately 2 ka. It also
reveals multi-decadal to centennial climate shifts superimposed on this long-term trend that have
resulted in at least nine glacier readvances during the last 10.5 ka. Accompanying meridional changes
in the Southern Hemisphere westerlies and their interconnection with local topography may explain
these glacier readvances.
Glaciers and ice caps are ubiquitous along the Antarctic margin, the Antarctic Peninsula and some of the more
mountainous or southerly sub-Antarctic islands; even so, most of these glaciers are in a state of decline. Since
the early 1990s, the rate of ice mass loss has accelerated in West A ntarctica1, and a recent inventory reveals that
mountain- and marine-terminating glaciers on the Antarctic Peninsula have been receding rapidly, regardless
of size and o rientation2. This is also the case for South Georgia, where rare historical observations of glaciers
extend to the beginning of the twentieth c entury3.
South Georgia is located c. 2200 km from Antarctica and c. 1800 km from the American continent. It lies
at the edge of the modern limit of the maximum sea ice extent, close to the polar front (PF), as well as the Ant-
arctic circumpolar current (ACC), and is embedded within the core belt of the Southern Hemisphere westerly
winds (Figs. 1 and 2). Variations in the mean zonal state of the westerlies are strongly related to the Southern
annular mode (SAM)—a zonally symmetric pattern, which is the leading mode of atmospheric variability in the
Southern Hemisphere4. Dynamic shifts in the westerlies impact, among other things, the regional distribution of
precipitation and temperature5, affecting the corresponding changes in glacier mass balances for South Georgia6.
Glacier trends during the last century underscore their sensitivity to recent and historical warming3,7 (Fig. 3).
Such sustained mass balance changes will be manifested by changes in glacier extent and glacial sediment supply
to downstream distal glacier-fed lakes, which are typically positively correlated with ice velocity rates and glacier
size8,9. These two features allow for reliable reconstructions of historical glacier variability, including regional
climate transitions. Following the last glacial maximum (LGM) 21 ka ago, South Georgia warmed, causing a wide-
spread recession of glaciers from the edge of the continental shelf to the inner parts of the fj ords10,11. This trend
was interrupted by a major readvance to the outer fjords during the Antarctic cold reversal (ACR) 14.5–13.0 ka
ago, when the island transitioned to a 2–3 °C cooler c limate3,10,12. Since the ACR, glaciers have gradually receded,
except for a few observed glacier r eadvances12–16. Glacier retreats have accelerated in recent decades, especially
on the eastern side of the island, in concert with rising t emperatures17,18.
Addressing the response of sub-Antarctic glaciers in the past to these changing climate conditions can pro-
vide important clues about past natural variability and, therefore, their sensitivity to future climate change. To
1
Bjerknes Centre for Climate Research, Allégaten 70, N‑5007 Bergen, Norway. 2Department of Earth Science,
University of Bergen, Allégaten 41, N‑5020 Bergen, Norway. 3NORCE Climate, Allégaten 70, N‑5007 Bergen,
Norway. 4Lamont-Doherty Earth Observatory, Columbia University, Palisades, NY 10027, USA. 5IBS Center
for Climate Physics, Institute for Basic Science, Busan, South Korea. 6Pusan National University, Busan, South
Korea. 7These authors contributed equally: Jostein Bakke and Øyvind Paasche. *email: Jostein.Bakke@uib.no
Scientific Reports | (2021) 11:8361 | https://doi.org/10.1038/s41598-021-87317-5 1
Vol.:(0123456789)
www.nature.com/scientificreports/
Figure 1. The physical setting of South Georgia in the core belt of the westerlies and between the outer limit
of the winter sea ice and the polar front (fronts are based on a 30 year average, 1991–2000) (Map was created in
Adobe Illustrator 2021 with data from the Australian Antarctic Data Centre http://data.aad.gov.au/aadc/mapcat/
display_map.cfm?map_id=13989 and insert satellite maps are downloaded from NASA Worldview).
generate reliable reconstructions of past glacier extent and dynamics, we rely on a multi-pronged geological
approach that combines data on the recessional moraine cosmogenic isotope exposure age with downstream
datable sedimentary evidence of changes in sedimentation in distal glacier-fed lakes20.
We have carried out two extensive field campaigns in South Georgia (AD 2008 and AD 2012) to conduct
sediment coring in distal glacier-fed lakes and to map glacial landforms, which allows us to constrain glacier
variability. Here we present three glacier reconstructions based on a combination of historical data, dating of
recessional moraines and bedrock surfaces using isotopic cosmogenic dating, as well as multi-proxy analyses of
suspended sediments deposited in a distal glacier-fed lake (for details see SOM, Figs. S2–Fig. S9). Hodges Glacier
is a small cirque glacier that has now completely disappeared, Carlita Glacier is a small cirque glacier in the later
phases of deglaciation, and Neumayer Glacier is a large tidewater glacier that is rapidly receding (Figs. 2, 5 and
6). Together, these data provide a robust and reproducible record of past glacier activity at a decadal to centennial
resolution throughout the last 14.5 k years. We use 10Be isotope dating in the glacier foreland to obtain an initial
Scientific Reports | (2021) 11:8361 | https://doi.org/10.1038/s41598-021-87317-5 2
Vol:.(1234567890)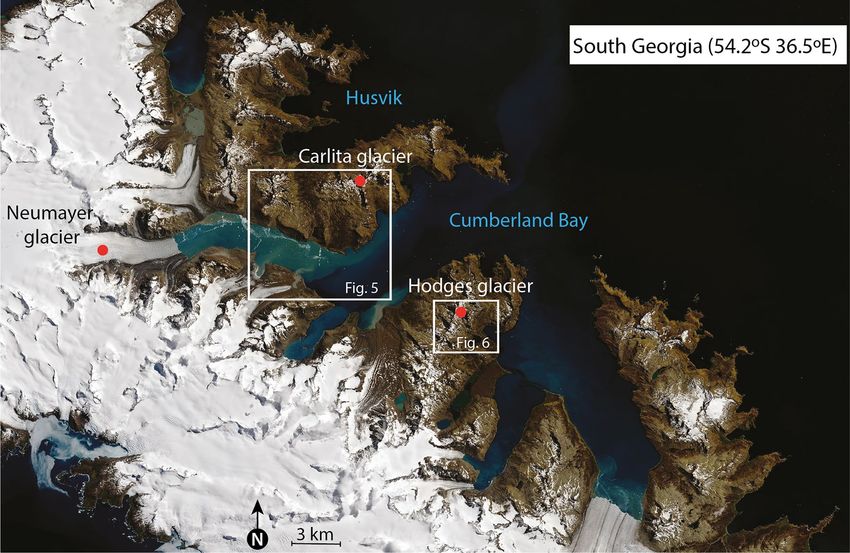
www.nature.com/scientificreports/
Figure 2. The island of South Georgia (54°S, 36°W) is 170 km long and ranges from 2 to 40 km wide; it is
surrounded by a shallow shelf area with an average depth of 250 m. Glaciers and alpine mountains completely
cover the central parts of the island, whereas the Cumberland Bay area is less glaciated, even though the
landscape is clearly shaped by erosive glaciers, which is exemplified by the numerous cirques, u-shaped valleys,
fjords, and lakes (The figure was created in Adobe Illustrator 2021 using data from NASA Worldview).
Figure 3. The modern retreat pattern of Hodges Glacier (primary y-axis, change measured in k m2) in West
Cumberland Bay and the larger Neumayer tidewater glacier (secondary y-axis, change measured in km extent)
in East Cumberland Bay since 1850 AD. The glacier retreat patterns reveal an accelerated recession since the
1970s. The Hodges glaciers had disappeared by 2008, as observed by the authors. Neumayer is soon to become
land-locked (the data for this figure are from papers2,3,21 and from AGU Blogshpere (https://blogs.agu.org/froma
glaciersperspective/category/south-georgia-glacier-retreat/)).
millennial-scale chronology (Figs. 5 and 6, Table S1). This chronology is then tested and refined by radiocarbon
dating of high-resolution lake sediment records. The results presented here reveal a coherent pattern detailing
several minor readvances superimposed on a sustained gradual retraction, which has culminated in accelerated
retreat and thinning after AD 1950 (Figs. 3 and 4).
Scientific Reports | (2021) 11:8361 | https://doi.org/10.1038/s41598-021-87317-5 3
Vol.:(0123456789)
www.nature.com/scientificreports/

                                            Figure 4.  Equilibrium-line altitude (ELA) estimates based on the accumulation area ratio method for
                                            individual dated moraines in the Hodges and Carlita catchments versus summer temperature for the
                                            corresponding time interval as reconstructed at James Ross Island (see SOM for data)25. The trend of gradually
                                            ascending ELAs is reproduced for the two glacierized catchments. Carlita glacier is still present, contrary to
                                            Hodges, which had completely melted by 2008.

                                            Figure 5.  The moraines sequence in front of the Hodges glacier. Red circles indicate coring sites for the three
                                            long piston cores obtained in Gull Lake in 2008. Red squares indicate sampling locations on boulders and blue
                                            squares on bedrock surface for cosmogenic dating, and the subsequent ages are shown in white boxes (see
                                            Table S1 for details, including uncertainty estimates).

                                            Results
                                            The exposure ages of recessional moraines mapped and sampled in two cirque glacier catchments (Figs. 5 and 6),
                                            referred to as Hodges Glacier (HG) and Carlita Glacier (CG), and one marine-terminating glacier (Neumayer
                                            Glacier, NG), were obtained using 10Be isotopes (Table S1). In addition, three piston sediment cores and three
                                            short gravity cores taken from Gull Lake provided sedimentary evidence that complements the Hodges reces-
                                            sional moraine chronology (Fig. 5). In the following, we present the results from these three complementary
                                            sites in Cumberland Bay (Figs. 5 and 6).

          Scientific Reports |   (2021) 11:8361 |                https://doi.org/10.1038/s41598-021-87317-5                                                    4

Vol:.(1234567890)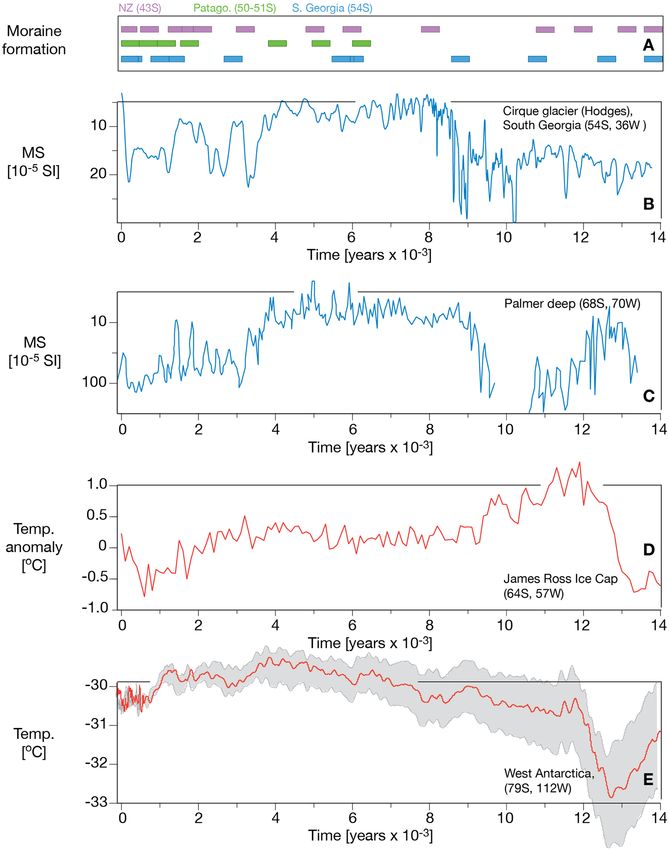
www.nature.com/scientificreports/
Figure 6. The study area in Cumberland West Bay, including the rapidly retreating glacier front of Neumayer
Glacier and the much smaller Carlita Glacier lying in the uppermost part of Olsen Valley. The red lines are
the historically documented frontal positions of Neumayer Glacier44. Red dots indicate sampling sites for
cosmogenic dating, and the connecting ages are marked in white boxes.
Hodges Glacier (HG): Before 2008, HG was located between the summits of Petrel Peak (632 m altitude)
and Mount Hodges (605 m altitude) (Figs. 2 and 5). We mapped nine recessional moraines marking the former
front positions of Hodges Glacier between the headwall and its distal glacier-fed lake (Fig. 5). The geomorpho-
logic map (Fig. 5) shows the outline of the preserved moraine sequences and the sampling position for 16 10Be
surface-exposure dates that are used to provide a minimum age for the moraine chronology. Ages span the last
14,000 years before the present day, when the glacier is assumed to have reached the position at M1010 (Fig. 5).
Since a glacier’s equilibrium-line altitude (ELA) can be derived from past moraine p ositions21, these positions
provide a quantitative estimate of changes that must necessarily be explained by the climate at the time. The nine
dated moraine ridges were used to reconstruct former ELAs using the accumulation area ratio and balance ratio
methods19 (Figs. 5 and 6). The variations in ELA can be further used to infer temperature variations, indicating
a summer warming of 1–1.5 °C (Fig. S1, see, for instance, O hmura20) from the largest to the smallest glacier
(Fig. 3). The youngest moraine was formed some 525 ± 50 years ago, and the reconstructed glacier had an ELA of
c. 450 ± 50 m altitude. Photos presented in G ordon21 show the extent of the glacier in 1955 and in 1982. Mapping
during the 2008 field expedition confirmed that the glacier had melted (Fig. 5).
Ground penetrating radar profiles in Gull Lake, which traps sediment-laden meltwater from Hodges Glacier,
suggest that the recovered cores capture sediments (with a grain size finer than 63 μm) deposited in the lake
after the deposition of M10, which is assumed to have occurred during the ACR10,11 (Fig. S3). This is further
supported when correlating the stratigraphy, as reflected by the magnetic susceptibility (MS) measurements
from the three individual cores (Fig. S4). Nineteen radiocarbon dates of macrofossils were used to establish the
age–depth relationship of the lake sediment record (Figs. S8 and Fig. S9). The sediment cores from Gull Lake
indicate continuous sedimentation from 10 ka until the glacier melted in AD 2008 (Fig. S8). There is therefore
sufficient overlap between the radiocarbon-dated lacustrine record and the corresponding 10Be chronology of
the nine moraines. Detailed analysis of the sediment cores included geochemical composition, density, water
content, organic content, environmental magnetism and grain size (see SOM for details and Figs. S2–Fig. S9).
Eleven sediment parameters were analysed using principal component analysis (PCA) (Fig. S6). The two leading
Scientific Reports | (2021) 11:8361 | https://doi.org/10.1038/s41598-021-87317-5 5
Vol.:(0123456789)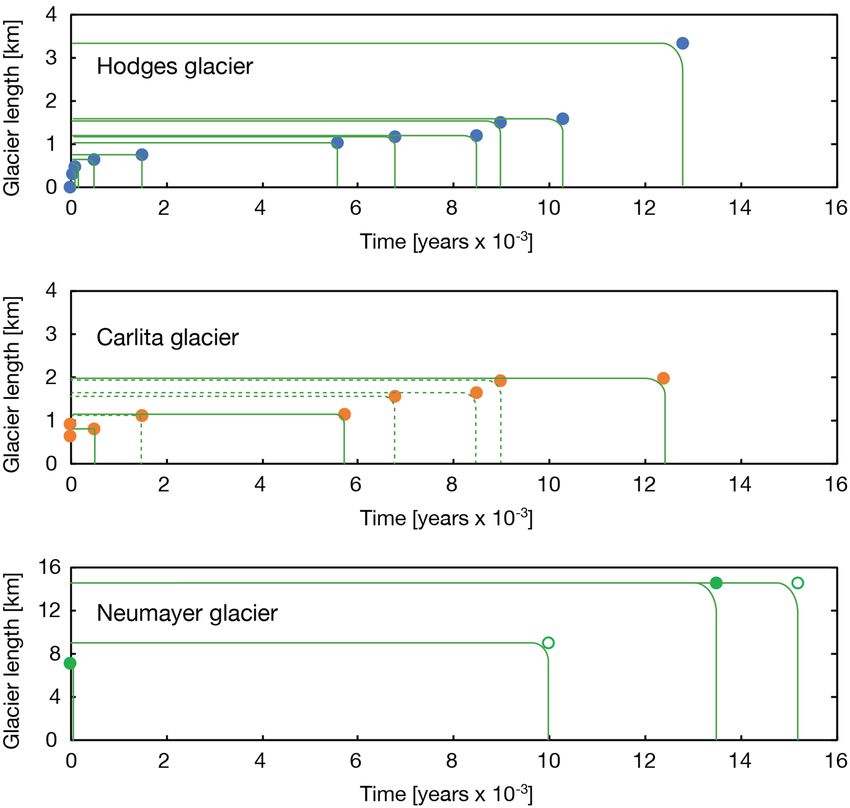
www.nature.com/scientificreports/
principal components (PCs 1, 2) explain 64% and 13% of the total variability, respectively (Fig. S6). The param-
eters dry bulk density (DBD), MS, potassium (K), titanium (Ti) and calcium (Ca) show high scores along the
first principal component axis, indicating that they respond to the same process or processes that take place
within the catchment (Fig. S6). In order to test the degree to which the glacially produced sediments imprinted
the sediment archives, a series of catchment samples were collected from the foreland between Gull Lake and
Hodges Glacier (Fig. S2). The resulting analyses suggest that the glacial sediments produced, transported and
subsequently deposited in Gull Lake are adequately captured by the MS and Ti concentrations (Fig. S5). The two
parameters are positively correlated, reinforcing the interpretation that the lake sediment record contains an
unperturbed signature of up-valley glacier activity that is detectable. In short, this means that increased glacier
erosion due to increased deformation rates and larger glaciers yield sediments with higher MS values and Ti
count rates (Figs. S7 and Fig. S9).
Carlita Glacier (CA): Nine recessional moraines were mapped downstream of the Carlita cirque glacier in
East Cumberland Bay, south of the summit of Diamond Peak (600 m altitude) (Fig. 6) (22), which forms the
basis of former glacier outlines and hence ELA estimates (Fig. S1). The glacier covered close to 1 km2 at its larg-
est extent compared to the present day—only 0.1 km2 (Fig. S1)22. Beryllium (10Be) samples were collected from
five of the recessional moraine systems. The exposure dates reveal that the glacier reached a maximum position
during 13 ± 0.5 ka with an ELA of c. 360 ± 50 m asl. The innermost moraine system is dated to 300 ± 125 years
before present (BP), suggesting an “Little Ice Age” (LIA) age of the moraine system with a corresponding ELA
of 470 ± 70 m asl.
Neumayer Glacier (NG): This glacier extends to an elevation of more than 1000 m and is more than 20 km
long (Fig. S1). The NG record differs from the two cirque glaciers; it has only three moraine remnants on land.
A survey of the East Cumberland Bay fjord seafloor suggests that at least two recessional moraines have been
deposited outside these systems, with the most proximal deposited just after 14.8 k a11. Ages of a bedrock ridge
running parallel with the fjord suggest that NG retreated ~ 13.5 ka ago, as shown in Fig. 6. The two lateral
moraines were deposited 200 years ago, and the retreat from the younger moraine took place in the early AD
1970s. No ELA estimates were calculated for NG due to the different dynamics of tidewater glaciers versus small
cirque glaciers, although frontal positions are documented.
The three individual glacier reconstructions show a common retreating trend that lends support to the idea
of a response to insolation during the Holocene period23,24 (Fig. 6). The shared pattern of past glacier variability
among our three sites reveals rapidly retreating glaciers at the end of the ACR with a decelerated retreat after
~ 10 ka. Between 10 and 5.7 ka, the glaciers retreated further, except for some minor readvances. The onset of
the sub-Antarctic Neoglacial period included several glacier readvances commencing at ~ 4 ka, with at least two
readvances during the last 0.5 ka (Fig. 7). There seems to be an overall rising trend for the regional ELA over
Cumberland Bay throughout the entire record up to the present day, interrupted by shorter periods of tempo-
rary lowering of the ELA or stagnation of upward ELA migration accompanying periods of recessional moraine
formation (Figs. 5 and 6). Based on these dates, the moraines are in stratigraphic order, meaning that none of
the subsequent glacier advances is larger than the preceding advance.
Discussion
Our composite reconstruction from South Georgia covers the past 14.5 ka (Figs. 7 and 8). The deglaciation fol-
lowing the ACR started at approximately 13.2 ka and continued until it was interrupted by a cooling (reversal)
beginning at 11.0 ka25. This resulted in recessional moraine formation around 10.5 ka and 9 ka (Figs. 5 and 6).
The mid-Holocene took place from 9 until 3.4 ka, with moraine-forming glacier advances at ~ 8.8 ka, 6.7 ka,
5.7 ka and 3.4 ka (seen only in the sediment archive from Gull Lake) (Fig. 5 and Fig. S9). The three latter events
coincide with the largest Holocene Glacier advances in Patagonia26. A drift towards a slightly cooler climate after
4 ka marks the onset of the Neoglacial period characterised by centennial-scale glacier fluctuations peaking at
3.4 ka, 2.8 ka (dated in Gull Lake) [also shown i n14], 1.1 ka, 0.7 ka (Fig. 8), and finally, during the late twentieth
century (with a maximum in AD 1910)22,27,28.
The new glacier records show consistency with other glacier records from elsewhere in the Southern Hemi-
sphere, including key records from the Antarctic Peninsula, New Zealand and Patagonia28–31. The smoothed
Palmer Deep Glacier record of meltwater inputs from the western side of the Antarctic Peninsula indicates the
abrupt onset of the Holocene period at approximately 10.5 ka, followed by a quiescent phase replaced by glacier
rejuvenation at 4 ka32, which is similar to our South Georgia records. The summer temperature reconstructed
from the James Ross Ice Cap25 and from the West Antarctic Ice Sheet Divide (WAIS)33 (Fig. 8) parallels the
observed long-term demise of the South Georgia glaciers, as evident from the moraine records, but it also sug-
gests that variations in the precipitation field can help explain the multiple glacier readvances taking place on
multi-decadal to centennial time s cales3,34.
Since the termination of the ACR, December insolation at 55°S has gradually risen, eventually peaking at c.
2 ka, whereupon it weakened moderately towards the present day. Changes in summer insolation at this latitude
during this time interval amount to over 30 W m−224,35, a forcing that provides a first order explanation of the
glacier trends presented here (Fig. 7 and 8).
Locally, the SAM explains 20–30% of the geopotential height variability in the circumpolar front zone and
possibly more on longer time scales. This influence is not constrained to summer but includes winter as well,
with a strong zonally asymmetric v ariability36. L’Heureux and Th ompson37 demonstrated that shifts in the SAM
can be partly linked to variations in the El Niño-Southern Oscillation, explaining 25% of the variance in modern
data. Strengthening and poleward migration of the SAM can lead to warming in some areas of the Southern
Hemisphere7. The Coupled Model Intercomparison Project (CMIP5) model simulations suggest that this trend
is likely to continue into the next century in response to increasing greenhouse gas concentrations38. However, a
Scientific Reports | (2021) 11:8361 | https://doi.org/10.1038/s41598-021-87317-5 6
Vol:.(1234567890)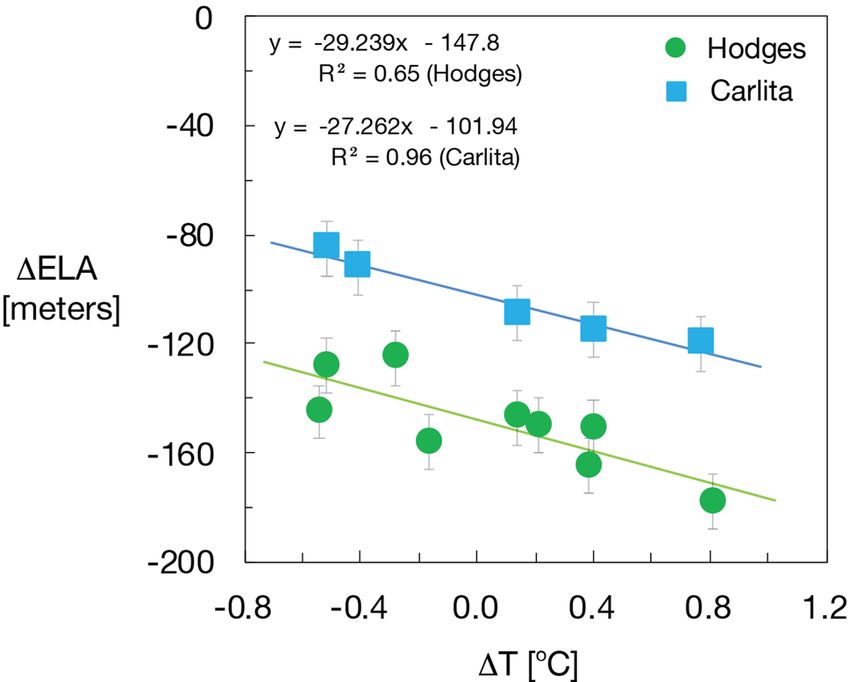
www.nature.com/scientificreports/
Figure 7. Exposure dating of glacier extents (marked by dots in the three panels representing mean age
with reference to Table S1) for the three examined glaciers in South Georgia: Hodges Glacier, Carlita Glacier
and Neumayer Glacier. Additional constraints on the extent of Neumayer Glacier are provided by a recently
radiocarbon-dated lake sedimentary archive in the lower part of Olsen V alley22, denoted by an open circle at ca.
11
10 ka. Moreover, Graham et al. provide a limit for the horizontal extension of Neumayer Glacier during the
Antarctic cold reversal (ACR) at ca 15.5 ka. Dotted lines in the upper panel are reconstructed glacier advances
based on bog and lake sediments from Carlita Bay (Fig. 6)15.
reduction in stratospheric ozone concentrations may slow these trends39,40. With respect to glacier mass balance
budgets, it is important to note that the SAM influences surface air temperature (SAT) in the sub-Antarctic fringe
ompson4 highlight that
zone, not only for a specific season, but throughout the year. Specifically, Marshall and Th
a positive SAM will warm the Antarctic Peninsula, whereas West and East Antarctic will cool, as reproduced by
daily SAT anomaly data from ERA-Interim as well as station-based observations across all seasons. Although
Marshal et. al’s study41 is based on daily data, the authors maintain that they should also be relevant on longer
time scales. One local topoclimatic factor that, according to Bannister and K ing37 may amplify the climate effect
of stronger westerlies are warm Föhn winds, which are prevalent in South Georgia, occurring on average 7.2
times per month. The repeated dry and warm winds on the east side of the island help to explain the asymmetrical
retreat of the glaciers3, and are also consistent with the long-term trend of stronger westerly winds.
The glaciers of SG have retreated in accordance with increased summer temperatures in the last 100 years,
concordant with the positive polarity of the SAM. We find it plausible that modulations in the SAM on decadal
and longer time scales will continue to impact glacier size and extent in South Georgia, and that long-term
adjustments in astral summer insolation at a latitude of 55°S can potentially be linked to a long-term southward
shift in the mean position and strength of the w esterlies42.
We speculate that changes in the SAM on decadal time scales, which by definition must be part of the natural
variability of this system and allow glaciers to achieve minor advances, can be related to corresponding changes
in sea ice cover, ocean circulation and possibly tropical teleconnections to the El Niño Southern Oscillation
(ENSO)36. Further work, especially better spatial coverage of paleoclimatic reconstructions from this region, is
Scientific Reports | (2021) 11:8361 | https://doi.org/10.1038/s41598-021-87317-5 7
Vol.:(0123456789)www.nature.com/scientificreports/
Figure 8. Key records of climate and glacier variability in the circumpolar fringe zone including (from above)
a compilation of glacier advances for New Zealand (NZ)28, Patagonia in South America26,30 and data from
South Georgia (in this paper). The second panel from the top shows the variability of Hodges Glacier based
on the sediment record from Gull Lake (this paper). The third panel shows glacier variability at the Antarctic
Peninsula, Palmer D eep29. Note that the MS values are reversed for both Hodges Glacier and Palmer Deep. The
fourth panel shows the temperature based on an ice core from the James Ross Ice Cap (47), and the last panel
from the top shows the temperature as recorded in West Antarctica33.
Scientific Reports | (2021) 11:8361 | https://doi.org/10.1038/s41598-021-87317-5 8
Vol:.(1234567890)www.nature.com/scientificreports/
required to disentangle the relative importance that these components have in the evolution of glacier variations
documented here.
The new results detailing reproduceable sub-Antarctic glacier variability presented here reveal a trend of
gradually smaller glaciers that can be traced back to the Antarctic cold reversal (ACR, 14.5–13.0 ka). Since the late
onset of the Holocene period at 10.5 ka, nine glacial readvances have been recorded and dated for South Georgia.
During this period, the equilibrium-line altitudes rose gradually, except for temporary stagnations associated
with the formation of the moraines due to glacier readvances. Since the 1970s, glacier retreat and thinning have
accelerated, and some of the smaller cirque glaciers have now completely melted for the first time in the last
14.5 ka, as evident from our lake sediment records. We speculate that the consistent shifts in the SAM, and the
underlying correlation with the SAT field, contribute to sub-Antarctic glacier variability on decadal to multi-
decadal time scales, potentially with corresponding shifts in the precipitation field and interactions with local
topoclimatic phenomena, such as Föhn winds. A continued warming of the sub-Antarctic following the positive
trend of the SAM and strengthening of the Southern Hemisphere westerly winds could lead to an unparalleled
decline of the remaining land-based glaciers, as took place in the Arctic during the Holocene thermal maximum
(between 9 and 4 ka) in the Northern H emisphere43.
Data availability
Data are available through the Bjerknes Centre for Climate Research’s data centre; https://www.bcdc.no and
NOAA.
Received: 4 January 2021; Accepted: 26 March 2021
References
1. Sutterley, T. C. et al. Mass loss of the Amundsen Sea Embayment of West Antarctica from four independent techniques. Geophys.
Res. Lett. 41, 8421–8428 (2014).
2. Cook, A. J., Vaughan, D. G., Luckman, A. J. & Murray, T. A new Antarctic Peninsula glacier basin inventory and observed area
changes since the 1940s. Antarct. Sci. 26, 614–624 (2014).
3. Gordon, J. E., Haynes, V. M. & Hubbard, A. Recent glacier changes and climate trends on South Georgia. Glob. Planet Change 60,
72–84 (2008).
4. Marshall, G. J. & Thompson, D. W. J. The signatures of large-scale patterns of atmospheric variability in Antarctic surface tem-
peratures. J Geophys Res-Atmos 121, 3276–3289 (2016).
5. Waugh, D. W., Banerjee, A., Fyfe, J. C. & Polvani, L. M. Contrasting recent trends in Southern Hemisphere Westerlies across dif-
ferent ocean basins. Geophys. Res. Lett. 47, 88890 (2020).
6. Gordon, J. E. & Timmis, R. J; Glacier fluctuations on South Georgia during the 1970s and early 1980s. Antarctic Science; (United
Kingdom), 215-226 (1992).
7. R. Garreud, Precipitation and Circulation Covariability in the Extratropics. J. Clim. 2018, 4789-4797 (2007).
8. Hallet, B., Hunter, L. & Bogen, J. Rates of erosion and sediment evacuation by glaciers: A review of field data and their implications.
Glob. Planet Change 12, 213–235 (1996).
9. Koppes, M. et al. Observed latitudinal variations in erosion as a function of glacier dynamics. Nature 526, 100 (2015).
10. Bentley, M. J. et al. Glacial geomorphology and chronology of deglaciation, South Georgia, sub-Antarctic. Quat. Sci. Rev. 26,
644–677 (2007).
11. A. G. C. Graham et al., Major advance of South Georgia glaciers during the Antarctic Cold Reversal following extensive sub-
Antarctic glaciation. Nat Commun 8, 14798 (2017).
12. Clapperton, C. M., Sugden, D. E., Birnie, J. & Wilson, M. J. Late-glacial and holocene glacier fluctuations and environmental-change
on South Georgia, Southern-Ocean. Quat. Res. 31, 210–228 (1989).
13. Hodgson, D. A. et al. Terrestrial and submarine evidence for the extent and timing of the Last Glacial Maximum and the onset of
deglaciation on the maritime-Antarctic and sub-Antarctic islands. Quat. Sci. Rev. 100, 137–158 (2014).
14. L. T. Oppedal, J. Bakke, Ø. Paasche, J. P. Werner, W. G. M. van der Bilt, Cirque Glacier on South Georgia Shows Centennial Vari-
ability over the Last 7000 Years. Front. Earth Sci. 6, 2 (2018).
15. Rosqvist, G. C., Rietti-Shati, M. & Shemesh, A. Late glacial to middle Holocene climatic record of lacustrine biogenic silica oxygen
isotopes from a Southern Ocean island. Geology 27, 967–970 (1999).
16. Hodgson, D. A. et al. Glacial history of sub-Antarctic South Georgia based on the submarine geomorphology of its fjords. Quat.
Sci. Rev. 89, 129–147 (2014).
17. Steig, E. J. et al. Warming of the Antarctic ice-sheet surface since the 1957 International Geophysical Year (vol 457, pg 459, 2009).
Nature 460, 766–766 (2009).
18. Pedro, J. B. et al. The spatial extent and dynamics of the Antarctic Cold Reversal. Nat. Geosci. 9, 51–57 (2015).
19. Rea, B. R. Defining modern day Area-Altitude Balance Ratios (AABRs) and their use in glacier-climate reconstructions. Quat.
Sci. Rev. 28, 237–248 (2009).
20. Ohmura, A., Kasser, P. & Funk, M. Climate at the equilibrium line of glaciers. J. Glaciol. 38, 397–411 (1992).
21. J. E. Gordon, Radiocarbon-Dates from Nordenskjold Glacier, South Georgia, and Their Implications for Late Holocene Glacier
Chronology. Brit Antarct Surv B, 76, 1-5 (1987).
22. L. Oppedal, J. Bakke, Ø. Paasche, J. Werner, G. W. van der Bilt. Cirque glacier on South Georgia shows centennial variability over
the last 7000 years. Front. Earth Sci. (2018).
23. Mayewski, P. A. et al. Holocene climate variability. Quat. Res. 62, 243–255 (2004).
24. Berger, A. & Loutre, M. F. Insolation values for the climate of the last 10 million years. Quat. Sci. Rev. 10, 297–317 (1991).
25. Mulvaney, R. et al. Recent Antarctic Peninsula warming relative to Holocene climate and ice-shelf history. Nature 489, 141-U204
(2012).
26. Kaplan, M. R. et al. Patagonian and southern South Atlantic view of Holocene climate. Quat. Sci. Rev. 141, 112–125 (2016).
27. Van der Bilt, W. et al. Late Holocene glacier reconstruction reveals retreat behind present limits and two-stage Little Ice Age on
subantarctic South Georgia. J. Quat. Sci. 32, 888–901 (2017).
28. Schaefer, J. M. et al. High-frequency holocene glacier fluctuations in New Zealand Differ from the Northern Signature. Science
324, 622–625 (2009).
29. Domack, E. et al. Stability of the Larsen B ice shelf on the Antarctic Peninsula during the Holocene epoch. Nature 436, 681–685
(2005).
Scientific Reports | (2021) 11:8361 | https://doi.org/10.1038/s41598-021-87317-5 9
Vol.:(0123456789)www.nature.com/scientificreports/
30. Kaplan, M. R. et al. The anatomy of long-term warming since 15 ka in New Zealand based on net glacier snowline rise. Geology
41, 887–890 (2013).
31. Kaplan, M. R. et al. Holocene glacier behavior around the northern Antarctic Peninsula and possible causes. Earth Planet. Sci.
Lett. 534, 116077 (2020).
32. Domack, E. W., Ishman, S. E., Stein, A. B., McClennen, C. E. & Jull, A. Late Holocene advance of the Müller Ice Shelf, Antarctic
Peninsula: Sedimentological, geochemical and palaeontological evidence. Antarct. Sci. 7, 159–170 (1995).
33. Cuffey, K. M. et al. Deglacial temperature history of West Antarctica. Proc. Natl. Acad. Sci. 113, 14249–14254 (2016).
34. Bannister, D. & King, J. Föhn winds on South Georgia and their impact on regional climate. Weather 70, 324–329 (2015).
35. Beer, J. & Van Geel, B. Natural Climate Variability and Global Warming: A Holocene Perspective 138–168 (Blackwell, 2008).
36. Ding, Q. H., Steig, E. J., Battisti, D. S. & Wallace, J. M. Influence of the Tropics on the Southern Annular Mode. J. Clim. 25,
6330–6348 (2012).
37. L’Heureux, M. L. & Thompson, D. W. J. Observed relationships between the El Niño-Southern Oscillation and the extratropical
zonal-mean circulation. j. Clim. 19, 276–287 (2006).
38. N. C. Swart, J. C. Fyfe, Observed and simulated changes in the Southern Hemisphere surface westerly wind-stress. Geophys Res
Lett, 39 (2012).
39. Thompson, D. W. & Solomon, S. Interpretation of recent Southern Hemisphere climate change. Science 296, 895–899 (2002).
40. Li, F. et al. Impacts of interactive stratospheric chemistry on Antarctic and Southern Ocean Climate Change in the Goddard Earth
Observing System, Version 5 (GEOS-5). J. Clim. 29, 3199–3218 (2016).
41. Marshall, G. J. Trends in the southern annular mode from observations and reanalyses. J. Clim. 16, 4134–4143 (2003).
42. J. R. Toggweiler, J. L. Russell, S. R. Carson, Midlatitude westerlies, atmospheric CO2, and climate change during the ice ages.
Paleoceanography, 21, 2 (2006).
43. Bakke, J. et al. A complete record of Holocene glacier variability at Austre Okstindbreen, northern Norway: An integrated approach.
Quat. Sci. Rev. 29, 1246–1262 (2010).
44. Cook, A. J., Poncet, S., Cooper, A. P. R., Herbert, D. J. & Christie, D. Glacier retreat on South Georgia and implications for the
spread of rats. Antarct. Sci. 22, 255–263 (2010).
Acknowledgements
We extend our thanks especially to Bjørn Christian Kvisvik as well as to Åsmund Bakke, Sunniva Vatle and
Anne Bjune for assistance during the fieldwork campaigns at South Georgia. Thanks to British Antarctic Survey
and to the staff at the research station King Edward Point, and to Hurtigruten AS for providing the logistics for
transport and accommodation during the fieldwork. Thanks to B. Kvisvik for assistance with laboratory analysis
and to Ulysses Ninnemann and Gunhild `Ninnis´ Rosqvist for discussions.
Author contributions
J.B. and Ø.P. contributed equally to this paper during fieldwork, laboratory analyses, interpretation of results
and writing of the paper and the supplementary information and developed the original conceptual hypothesis.
J.S. provided access to Lamont cosmogenic laboratory. A.T. took part in building the conceptual hypotheses and
took part in the discussions during the writing phase.
Funding
This is a contribution to SHIFTS and SOUTHSPHERE financially supported by the Norwegian Research Council
(NCR) (210004). A.T. was supported by the Institute for Basic Science (project code IBS-R028-D1). JMS grate-
fully acknowledges support by the Vetlesen Foundation, the Columbia Climate Center and the Columbia Center
for Climate and Life.
Competing interests
The authors declare no competing interests.
Additional information
Supplementary Information The online version contains supplementary material available at https://doi.org/
10.1038/s41598-021-87317-5.
Correspondence and requests for materials should be addressed to J.B.
Reprints and permissions information is available at www.nature.com/reprints.
Publisher’s note Springer Nature remains neutral with regard to jurisdictional claims in published maps and
institutional affiliations.
Open Access This article is licensed under a Creative Commons Attribution 4.0 International
License, which permits use, sharing, adaptation, distribution and reproduction in any medium or
format, as long as you give appropriate credit to the original author(s) and the source, provide a link to the
Creative Commons licence, and indicate if changes were made. The images or other third party material in this
article are included in the article’s Creative Commons licence, unless indicated otherwise in a credit line to the
material. If material is not included in the article’s Creative Commons licence and your intended use is not
permitted by statutory regulation or exceeds the permitted use, you will need to obtain permission directly from
the copyright holder. To view a copy of this licence, visit http://creativecommons.org/licenses/by/4.0/.
© The Author(s) 2021
Scientific Reports | (2021) 11:8361 | https://doi.org/10.1038/s41598-021-87317-5 10
Vol:.(1234567890)You can also read