Expected evolution of disk wind properties along an X-ray binary outburst
←
→
Page content transcription
If your browser does not render page correctly, please read the page content below
A&A 649, A128 (2021)
https://doi.org/10.1051/0004-6361/202039524                                                                                                                Astronomy
c P.-O. Petrucci et al. 2021                                                                                                                                &
                                                                                                                                                           Astrophysics

  Expected evolution of disk wind properties along an X-ray binary
                              outburst
      P.-O. Petrucci1 , S. Bianchi2 , G. Ponti3 , J. Ferreira1 , G. Marcel4 , F. Cangemi5 , S. Chakravorty6 , M. Clavel1 ,
              J. Malzac7 , J. Rodriguez5 , S. Barnier1 , R. Belmont5 , S. Corbel5 , M. Coriat7 , and G. Henri1

      1
          Univ. Grenoble Alpes, CNRS, IPAG, 38000 Grenoble, France
          e-mail: pierre-olivier.petrucci@univ-grenoble-alpes.fr
      2
          Dipartimento di Matematica e Fisica, Università degli Studi Roma Tre, via della Vasca Navale 84, 00146 Roma, Italy
      3
          INAF-Osservatorio Astronomico di Brera, Via Bianchi 46, 23807 Merate, LC, Italy
      4
          Villanova University, Department of Physics, Villanova, PA 19085, USA
      5
          AIM, CEA, CNRS, Université Paris-Saclay, Université de Paris, 91191 Gif-sur-Yvette, France
      6
          Department of Physics, Indian Institute of Science, Bangalore 560012, India
      7
          IRAP, Université de Toulouse, CNRS, UPS, CNES, Toulouse, France

     Received 25 September 2020 / Accepted 8 March 2021

                                                                                      ABSTRACT

     Blueshifted X-ray absorption lines (preferentially from Fe XXV and Fe XXVI present in the 6–8 keV range) indicating the presence
     of massive hot disk winds in black hole (BH) X-ray binaries (XrB) are most generally observed during soft states. It has been recently
     suggested that the nondetection of such hot wind signatures in hard states could be due to the thermal instability of the wind in the
     ionization domain consistent with Fe XXV and Fe XXVI. Studying the wind thermal stability does require, however, a very good
     knowledge of the spectral shape of the ionizing spectral energy distribution (SED). In this paper, we discuss the expected evolution
     of the disk wind properties during an entire outburst by using the RXTE observations of GX 339-4 during its 2010–2011 outburst.
     While GX 339-4 never showed signatures of a hot wind in the X-rays, the dataset used is optimal for the analysis shown in this study.
     We computed the corresponding stability curves of the wind using the SED obtained with the jet-emitting disk model. We show that
     the disk wind can transit from stable to unstable states for Fe XXV and Fe XXVI ions on a day timescale. While the absence of wind
     absorption features in hard states could be explained by this instability, their presence in soft states seems to require changes in the
     wind properties (e.g., density) during the spectral transitions between hard and soft states. We propose that these changes could be
     partly due to the variation of the heating power release at the accretion disk surface through irradiation by the central X-ray source.
     The evolution of the disk wind properties discussed in this paper could be confirmed through the daily monitoring of the spectral
     transition of a high-inclination BH XrB.
     Key words. X-rays: binaries – accretion, accretion disks – magnetohydrodynamics (MHD)

1. Introduction                                                                                   plotted against the hardness ratio of the X-ray spectrum, produc-
                                                                                                  ing a hysteresis with a typical Q-shaped track. All BH XrBs gen-
Low mass X-ray binaries (XrB) are binary systems containing a                                     erally follow the same spectral evolution (e.g., Homan & Belloni
main sequence star and a compact object (neutron star or black                                    2005; Dunn et al. 2010, and see Remillard & McClintock 2006
hole). Due to Roche lobe overflow, the matter is pulled off from                                  or Done et al. 2007 for reviews). At the beginning and end of
the star and forms an accretion disk around the compact object                                    the outburst, the system is in the so-called hard state. During this
(see Tauris & van den Heuvel 2006 for a review). XrBs spend                                       state, the X-ray spectrum has a hard power-law shape up to a
most of their time in a quiescent state at very low mass accre-                                   few tens of keV, which is a signature of nonthermal processes
tion rates. Occasionally, they come out of the quiescent state and                                in a very hot, optically thin, plasma (the so-called corona). The
undergo outbursts that last from a few months to a year, during                                   radio emission observed in this state, which extends up to the
which their flux rises by several orders of magnitude across the                                  infrared (IR), is believed to be entirely produced by a steady jet.
whole electromagnetic spectrum (e.g., Remillard & McClintock                                      During the middle part of the outburst, the system is in the so-
2006). This release of gravitational power is believed to result                                  called soft state where the spectrum is dominated by a bump
from disk instabilities in the outer part of the accretion flow,                                  in the soft X-rays (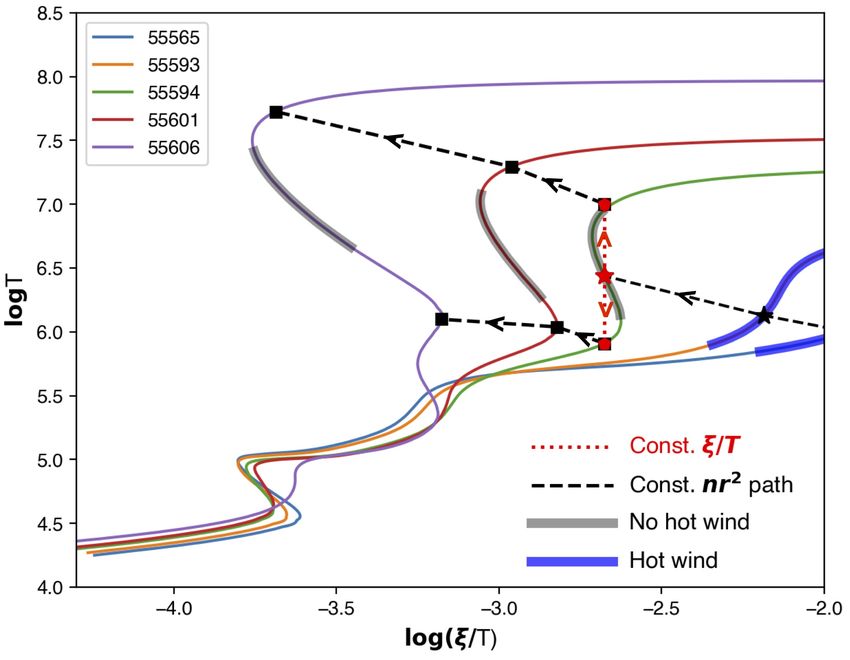
A&A 649, A128 (2021)

first part of the outburst and then from soft to hard at the end                Bianchi et al. 2017). These arguments support the importance
of the outburst before turning back to the quiescent state (e.g.,               of the thermal instability process in the changes of the wind
Remillard & McClintock 2006; Done et al. 2007).                                 ionization state (but see Sect. 2.2 for potential caveats). In this
     In the last 15 years, it has been realized that, while soft states         context, the disk wind could be present at all times (as recently
do not show signatures of a jet, the presence of blue shifted                   suggested by the observation of near-IR emission lines all along
absorption lines, generally from Fe XXV and Fe XXVI, indi-                      the outburst of the black hole transient MAXI J1820+070,
cates the existence of massive hot disk winds (see Díaz Trigo                   Sánchez-Sierras & Muñoz-Darias 2020), but it is detectable only
& Boirin 2016 and Ponti et al. 2016 for recent reviews). While                  in the soft state, when the relevant (for Fe XXV and Fe XXVI)
not detected in the hard states, these winds are generally present              range of the ionization parameter corresponds to stable thermal
in the soft states of inclined systems (e.g., Ponti et al. 2012).               equilibrium.
But the picture is certainly more complicated than a simple on-                      Stability curves are very useful to study, more precisely, the
off wind process between spectral states (e.g., Muñoz-Darias                    role of thermal stability on the wind properties. They represent
et al. 2016; Homan et al. 2016; Sánchez-Sierras & Muñoz-Darias                  the photoionization equilibrium states of a plasma illuminated
2020), and recent results during the (hard and soft) intermedi-                 by a broad band spectral energy distribution (SED). The com-
ate states show a large variety of wind properties and signatures               putation of these stability curves is, however, very sensitive to
(Miller et al. 2008b; Kallman et al. 2009; Rahoui et al. 2014;                  the spectral shape of the illuminating SED (e.g., Chakravorty
Neilsen et al. 2016; Shidatsu et al. 2016; Muñoz-Darias et al.                  et al. 2013; Bianchi et al. 2017). The precise study of the wind
2017; Mata Sánchez et al. 2018; Gatuzz et al. 2019). The physi-                 thermal stability during an outburst, and especially during the
cal processes at the origin of these disk winds are not completely              spectral transitions, then requires knowledge of the spectrum in
understood, but observations favored thermal or magnetic driv-                  the broadest energy range possible. However, Galactic hydrogen
ing (or a combination of the two) as the most probable launching                absorbs the soft X-rays (50 keV).
2018b). The dependence of the wind detection with the spec-                     With the typical 0.5–10 keV energy range (from e.g., Chandra
tral state of the X-ray source is, however, not straightforward.                or XMM), extrapolating from phenomenological models is haz-
Indeed, assuming that the outflow velocity is on the order of                   ardous and could lead to unphysical broad band spectral shapes
the escape velocity of the absorbing material, the observed blue-               and, consequently, erroneous stability curves. With the lack of
shifts generally put the absorbing wind at up to a few or hun-                  daily broad band monitoring of XrB, the best alternative is the
dreds of thousand of gravitational radii away from the X-ray                    use of physically motivated models to obtain reasonable extrap-
emitting region located close to the black hole (Schulz & Brandt                olations where the data are missing.
2002; Ueda et al. 2004; Kubota et al. 2007; Miller et al. 2008a;                     This is the purpose of the present paper. We discuss the
Kallman et al. 2009). In XrBs, such distances correspond to                     expected evolution of the disk wind properties of an XrB by
the outer part of the accretion disk. This connection between                   using the detailed observations of the most famous (and thus
the inner and outer part of the accretion flow cannot occur on                  best monitored) one, that is to say GX 339-4. No wind signa-
accretion (i.e., viscous) timescale since it is expected to be on               ture has been detected in this object potentially due to the low
the order of several weeks to months, that is to say the typical                inclination of our line-of-sight (Ponti et al. 2012, but see Miller
duration of the observed outbursts1 . This is much longer than                  et al. 2015 for the marginal detection of He-like Fe XXV and
the duration of a few days for a typical transition between a                   H-like Fe XXVI emission lines during a high and soft state of
hard (windless) state to a soft (windy) state (e.g., Dunn et al.                this source, which are potential signatures of a wind). Even if
2010). To explain the observations, the communication between                   GX 339-4 is not the prototype of a windy XrB, we believe that
the X-ray corona and the wind must, therefore, be much faster                   its spectral behavior along an outburst is representative of the
than the accretion timescale. It has been pointed out that over-                one followed by any XrB. As a consequence, its SED can be
ionization, as a consequence of the much harder illuminating                    used to trace the expected evolution of the stability curve of a
spectral energy distribution during hard states might play a role               windy source. GX 339-4 entered several times in outburst in the
(see e.g., Shidatsu & Done 2019), but in several instances it may               last 20 years and for which a large amount of data exist (see
not be sufficient (e.g., Neilsen & Homan 2012; Ponti et al. 2015).              e.g., the WATCHDOG all-sky database Tetarenko et al. 2016).
     It has been recently understood that the spectral state of the             Its 2010–2011 outburst for example was very well followed in
central source has a huge impact on the thermal stability of the                X-rays and radio. It was observed by RXTE for more than 400
wind and its ionization state (Chakravorty et al. 2013, 2016;                   days with almost one observation every day. Marcel et al. (2019)
Bianchi et al. 2017; Higginbottom et al. 2020). When illumi-                    recently reproduced the spectral shapes of each observation dur-
nated by a soft state spectrum, the wind is always thermally sta-               ing the entire outburst with the jet-emitting disk (JED) model
ble regardless of its ionization parameter. When the spectrum                   (Ferreira et al. 2006; Marcel et al. 2018b,a). The correspond-
is hard, however, large parts of the stability curve are thermally              ing best-fit SEDs are well constrained by the RXTE/PCA obser-
unstable, in particular in the ionization domain required for the               vations. While model dependent, they are however physically
production of Fe XXV and Fe XXVI ions. The timescale for the                    motivated and give consistent extrapolations outside the energy
thermal instability to take place depends on the cooling timescale              window of RXTE. We thus made the choice to use these SEDs
of the gas and, for the expected wind density (see Sect. 2), is                 to compute the wind stability curves and follow their evolution
expected to be quite fast (
P.-O. Petrucci et al.: Expected evolution of disk wind properties along an X-ray binary outburst

    This paper is organized as follows. In Sect. 2 we explain how             Table 1. MJD, transition radius, and accretion rate of some of the best
we computed the stability curves. Then, we present and discuss,               fit SED obtained by Marcel et al. (2019) to reproduce the RXTE/PCA
in detail, their evolution all along the outburst in Sect. 3. Our             observations of the 2010–2011 outburst of GX 339-4.
results suggest significant changes in the disk wind properties
during the state transitions, which is discussed in Sect. 4. We                  MJD         Rtr       Ṁ       L1−1000 Ry   L1−100 keV    Lbol
propose that the disk illumination plays a major role in the wind                           (Rg )   ( ṀEdd )    (LEdd )      (LEdd )     (LEdd )
observable properties. We conclude in Sect. 5.
                                                                                 55 208     27.1     0.63         0.019        0.014       0.043
                                                                                 55 271     23.1     1.57         0.062        0.083       0.174
                                                                                 55 293     23.1     2.42         0.094        0.130       0.248
2. Stability curves computation                                                  55 294     21.6     2.42         0.099        0.132       0.249
2.1. Methodology                                                                 55 295      9.6     2.34         0.177        0.157       0.264
                                                                                 55 296      8.4     2.51         0.210        0.170       0.286
Stability curves are generally plotted in a log T −log ξ/T diagram               55 297      7.2     2.80         0.261        0.194       0.324
(e.g., Krolik et al. 1981), where T is the gas temperature and ξ                 55 303      5.0     2.80         0.330        0.217       0.352
is its ionization parameter2 . In this diagram, an equilibrium state             55 333      2.2     0.75         0.168        0.114       0.168
where the slope of the curve is positive is thermally stable, while              55 334      2.0     0.70         0.166        0.115       0.166
it is unstable if the slope is negative, and the gas is then expected            55 450      2.0     0.55         0.129        0.087       0.129
to rapidly collapse into a different stable equilibrium state.                   55 559      2.2     0.33         0.073        0.043       0.073
     As said in the introduction, we used the best fit SED obtained              55 565      2.5     0.34         0.070        0.040       0.070
by Marcel et al. (2019) in the JED model framework to com-                       55 593      3.0     0.27         0.052        0.029       0.055
pute the stability curves. These SED reproduce the RXTE/PCA                      55 594      4.9     0.27         0.034        0.018       0.041
data of GX 339-4 observed during its 2010–2011 outburst. The                     55 601      6.6     3.33         0.033        0.019       0.044
JED framework and the way in which the SED were computed                         55 606     15.3     0.35         0.017        0.009       0.028
are described in a series of papers (Ferreira et al. 2006; Marcel                55 607     15.6     0.37         0.017        0.009       0.029
et al. 2018b,a) to which the reader is referred for more details.                55 617     24.2     0.15         0.005        0.003       0.008
In Appendix A, we have also reported some of this information.                   55 646     40.1     0.03        0.0006       0.0004       0.001
To summarize, the JED framework assumes the presence of a
JED in the inner region of the accretion flow, for disk radii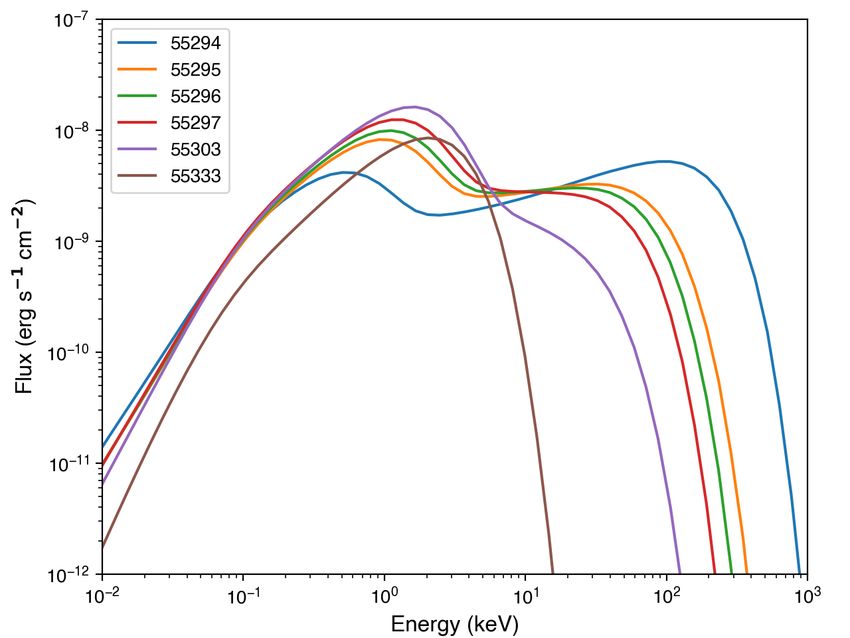
A&A 649, A128 (2021)

                                                                             curve. Clearly, the gray colored ones correspond to the observa-
                                                                             tions on the right side of the HID, that is to say from MJD 55208
                                                                             to 55295 and from MJD 55594 to 55646, which are either hard
                                                                             or hard-intermediate states of the outburst. On the contrary, all
                                                                             the other observations (in soft and soft-intermediate states) have
                                                                             highlighted areas on stable branches. This is in agreement with
                                                                             recent studies (e.g., Chakravorty et al. 2013, 2016; Bianchi et al.
                                                                             2017) and, as discussed in the introduction, this would explain
                                                                             the nonobservations of Fe XXV–Fe XXVI absorption lines in
                                                                             hard states while a wind could still be present.
                                                                                 The daily observations of the 2010–2011 outburst of GX
                                                                             339-4 and the best fit SEDs obtained with the JED model
                                                                             allowed us to follow the evolution of the stability curves all along
                                                                             the outburst. Below, we describe this evolution during the differ-
                                                                             ent spectral stages of the source. While not unique, we follow
                                                                             the spectral state definitions of Marcel et al. (2019).
Fig. 1. HID of the 2010–2011 outburst of GX 339-4. The position of the
observations reported in Table 1 are indicated with blue and black col-      3.1. Hard state: From MJD 55208 to MJD 55293
ors and are labeled on the HID with their MJD. The black (resp. blue)
MJD correspond to observations whose range of the ionization param-          The first RXTE observation starts at MJD 55208 when the source
eter consistent with Fe XXV and Fe XXVI ions is in an unstable (resp.        was already in a rather bright (L ' 2%LEdd ) hard state. GX
stable) part of the photoionization stability curves. We have distributed    339-4 stayed in the hard state until around MJD 55293 when
the MJD observations in terms of modeled SED and associated stability        it started transitioning to the soft state. The 1–1000 Ry luminos-
curves in Fig. 2.                                                            ity increases by a factor of 5–6 during this period (see Table 1).
                                                                             The three best-fit SEDs obtained with the JED model for MJD
shorter than the dynamical timescale of the wind. While the                  55208, 55271, and 55293 are reported in Fig. 2a and infor-
                                                                             mation on the corresponding stability curves can be found in
observed line widths generally imply that the gas is supersonic,
                                                                             Fig. 2b. The SEDs are typical of hard states, dominated by a hard
such conditions are actually verified in MHD disk wind solu-
                                                                             X-ray cut-off power law above ∼1–2 keV (produced by the inner
tions such as those discussed by Chakravorty et al. (2016). In
                                                                             JED) and a weak disk black-body component below, produced
fact, even if the plasma wind velocity could be supersonic, its              by the outer SAD. The power-law slope appears roughly con-
dynamical timescale (see an estimate given by Gonçalves et al.               stant around 1.4–1.5 and the cut-off energy decreases when the
2007 in their Eq. (8)) is expected to be significantly longer than           luminosity increases. The disk black body emission increases in
the other timescales involved in the radiative equilibrium com-              flux and temperature, which is in agreement with the decrease in
putation (e.g., ionization time, recombination time, and thermal             the transition radius Rtr between the JED and the SAD while the
time; see Gonçalves et al. 2007).                                            accretion rate increases (see Table 1).
    While these arguments suggest that the shape of the stability                 The computed stability curves are quite similar for the three
curves discussed in this paper should not strongly depend on our             MJD 55208, 55271, and 55293. In the three cases, the tempera-
physical and numerical assumptions, precise estimates would                  ture range that agrees with the right ionization range for Fe XXV
require a detailed modeling of the disk wind physical proper-                and Fe XXVI is unstable. In fact, if the wind exists during this
ties and dynamics such as in the recent work by Dannen et al.                period, its temperature has to be in one of the ranges where the
(2020), Waters et al. (2021) in the case of thermal disk winds.              stability curves have a positive slope that is either at a very high
While this is an important step which should also be done in the             temperature (>3 × 10⁷ K) or in localized regions around 106 K,
case of magnetically driven disk winds, this is however out of the           2 × 10⁵ K, or at a lower temperature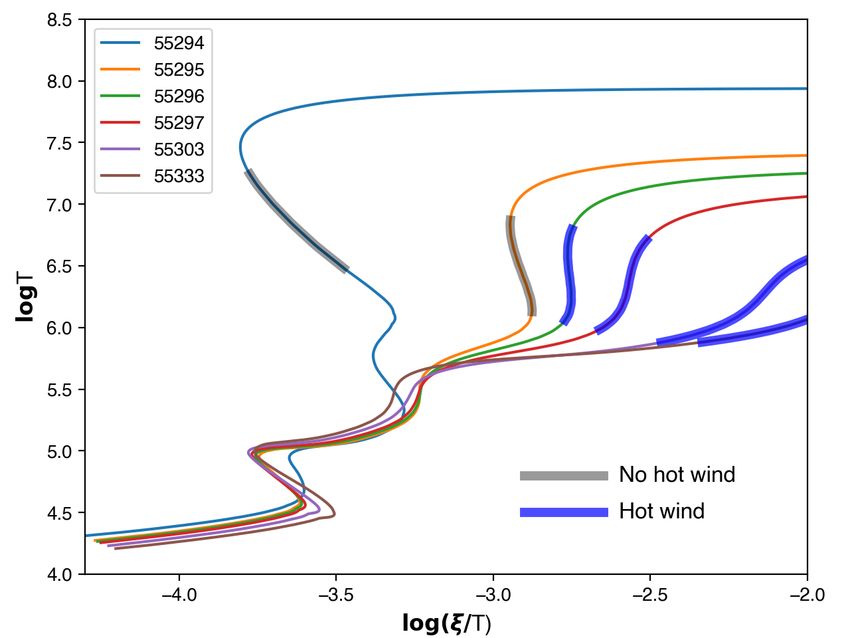
P.-O. Petrucci et al.: Expected evolution of disk wind properties along an X-ray binary outburst

                         a)                                                      b)

                                                               c)                                                       d)

                         e)                                                      f)

                         g)                                                                                             h)

Fig. 2. SED (left) and corresponding photoionization stability curves (right) between MJD 55208 and 55293 (hard state, a and b), MJD 55294 and
55303 (hard-to-soft transition, c and d), MJD 55304 and 55592 (soft state, e and f ) and MJD 55593 and 55606 (soft-to-hard transition, g and h).
The stability curves are labeled with their corresponding MJD. The highlighted (blue and gray) areas on each curve correspond to the range of the
ionization parameter consistent with Fe XXV and Fe XXVI. They are colored in blue (resp. gray) if they are located on a stable (resp. unstable)
part of the stability curve.

computations5 . This includes the ionization range compatible                 This change occurs in a couple of days (between MJD 55295
with Fe XXV and Fe XXVI ions.                                             and MJD 55297), while the changes of the SED are quite minor.
5
   Except in a narrow interval around 3 × 10⁴ −105 K, a temperature
                                                                          Within a day, from MJD 55295 to MJD 55296, the wind becomes
range which is irrelevant for Fe XXV and Fe XXVI because it is too        able to produce Fe XXV and Fe XXVI absorption lines. While
low.                                                                      the bolometric luminosity varies by only a factor of 1.4 during
                                                                                                                             A128, page 5 of 13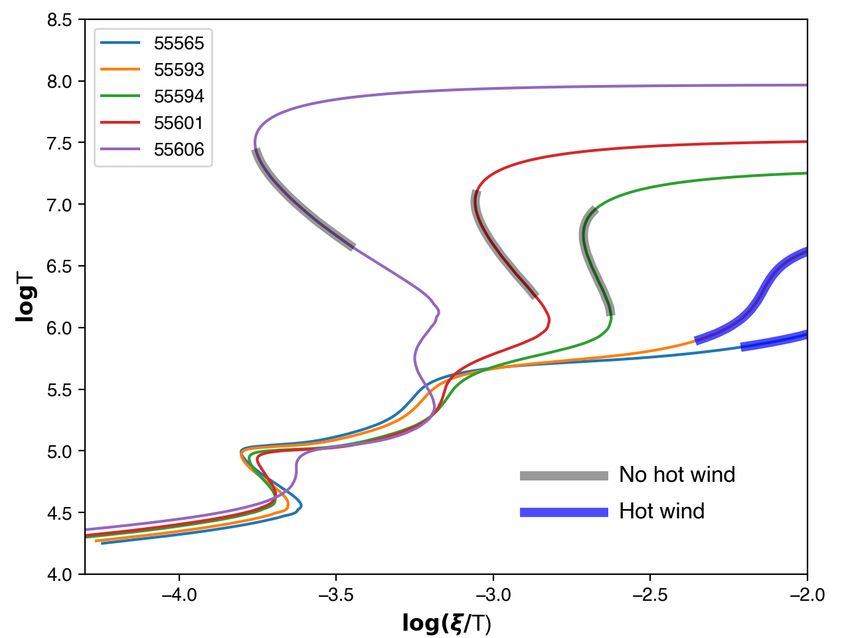
A&A 649, A128 (2021)
i) j)
Fig. 2. continued. (i) Photoionization stability curves and (j) corresponding SED between MJD 55607 and 55646 (hard-to-quiescent state).
the transition, with a maximum around MJD 55303, the ioniz- is a characteristic of the Compton process in a hot, but tenu-
ing luminosity varies by a significantly larger factor of ∼3.3 due ous plasma, where each scattering order produces well separated
to the increase in the disk flux which dominates the 1–1000 Ry spectral bumps.
energy range. We have reported the corresponding stability curves in
Fig. 2j. They are typical of hard state ones (see Sect. 3.1) and
no Fe XXV and Fe XXVI absorption lines are expected. The
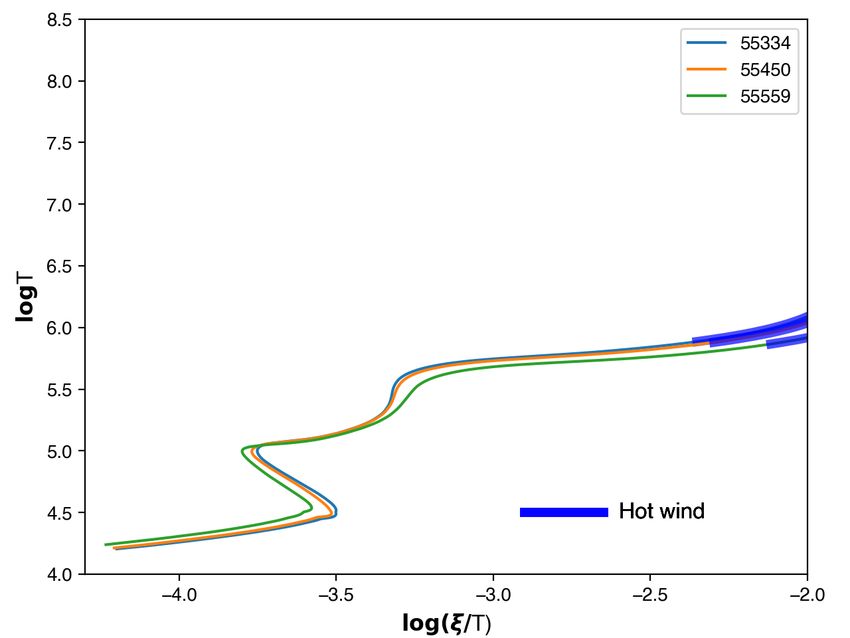
3.3. Soft state: From MJD 55334 to MJD 55559
general shape of the stability curves seems to stiffen when the
In the soft state, which lasts about 225 days here, the SED source flux decreases, the “S” shape then evolves to a “step”
are mainly characterized by a disk component in this state (see function where the upper hot and tenuous branch takes up the
Fig. 2e). The stability curves are very similar to one another dur- large part of the ξ/T range.
ing this entire state (see Fig. 2f), while the 1–1000 Ry luminosity
decreases by a factor of 4–5. The ionization range compatible 3.6. Hard tail
with Fe XXV and Fe XXVI ions is always in a stable part of
the stability curves, meaning that the associated absorption lines The soft states can also present a low luminosity and steep power
can be present. The presence of a hard tail can, however, signifi- law at a high energy (above ∼10 keV), the so-called hard tail,
cantly impact the thermal equilibrium of the wind (see Sect. 3.6 whose origin is currently unknown (Remillard & McClintock
and Fig. 3). 2006). It is generally badly constrained due to the lack of statis-
tics, reaching up to a 50% error on the photon index, for example.
3.4. Soft-to-hard: From MJD 55561 to MJD 55606 Marcel et al. (2019) included this hard tail in the SED by adding
a power-law component to the synthetic spectra each time the
At MJD 55559, the path of GX 339-4 starts to turn right in the fitting procedure favored a pure blackbody emission (see Marcel
HID, the source transiting back to the hard state. This transition et al. 2018a for a detailed discussion). The photon index of this
lasts about 40 days until around MJD 55606. We have reported power-law component was set to Γ = 2.5 and it was normalized
a few best fit SEDs during this transition in Fig. 2g. The disk in order to contribute to a fixed fraction of the 2–20 keV energy
component decreases in flux and temperature, while the X-ray range (typically between 1% and 20%, Remillard & McClintock
power law hardens and the high-energy cut-off increases. The 2006). On the left side of Fig. 3, we report the stability curves
1–1000 Ry and bolometric luminosities decrease by a factor of for MJD 55410 assuming different hard tails with a different flux
∼2.2 and ∼2.6, respectively, during this transition. (contributing to 1 and 20% of the 2–20 keV flux), but with a
We have reported the corresponding stability curves in fixed photon index (Γ = 2.5). In the right panel, we assume hard
Fig. 2h. As in the hard-to-soft transition, the shape of the sta- tails with different spectral indices (Γ = 2.5 and 2) but a constant
bility curves changes drastically during the soft-to-hard transi- flux (contributing to 10% of the 2–20 keV flux). These different
tion. Moreover, and again similar to the hard-to-soft transition, examples show that the presence of this hard tail can have some
the change from stable to unstable conditions for the ionization effects on the stability curves, but it is not sufficient to change a
range compatible with Fe XXV and Fe XXVI ions occurs in a soft state-like into a hard state-like shape. Moreover, its impact
couple of days. While the stability curve is similar to that of soft on the thermal stability of the hot wind in the soft state should
states at MJD 55592, it becomes the same as hard states at the not drastically change the existence of a stable ionization domain
beginning of the outburst at MJD 55594. Moreover, the temper- for Fe XXV and Fe XXVI.
ature ranges of thermal stability after the soft-to-hard transition
are also similar to those before the hard-to-soft transition (see
Sect. 3.1). 3.7. Low temperature phases
All the stability curves plotted in Figs. 2 and 3 show low tem-
3.5. Hard-to-quiescence: From MJD 55607 to MJD 55646 perature domains (around 104.5 and 105 K), which are thermally
stables. If part of the wind plasma is in this range of tempera-
After MJD 55607, GX 339-4 is back to the hard state until tures, absorption lines from low ionization-level ions could also
the end of the outburst. The bolometric luminosity decreases be observable. Of course, this strongly depends on the total col-
by more than a factor of 30 during this period. The lower the umn density of this low temperature plasma on the line of sight.
luminosity is, the bumpier the SED shape (see Fig. 2i). This For instance, in the case of the transient accreting neutron star
A128, page 6 of 13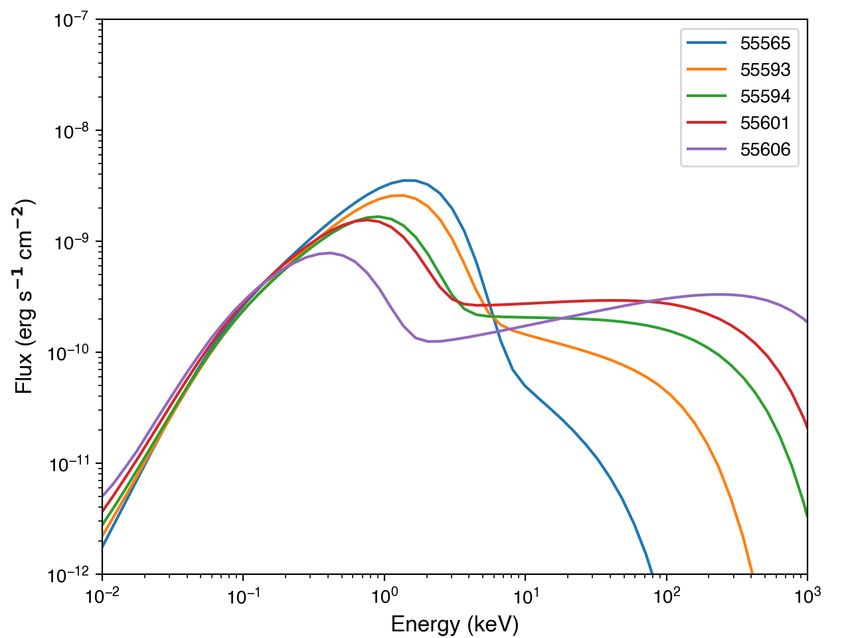
P.-O. Petrucci et al.: Expected evolution of disk wind properties along an X-ray binary outburst

Fig. 3. Effect of the hard tail on the photoionization stability curves. Application to MJD 55410. Left: hard tails with constant photon indexes
Γ = 2.5, but with different fluxes contributing to 1 and 20% of the 2–20 keV flux. Right: hard tails with different photon index (Γ = 2 and 2.5), but
a constant flux contributing to 10% of the 2–20 keV flux.

AX J1745.6-2901, Bianchi et al. (2017) tested the case where                4.1. Changes in the disk wind properties during spectral
the column density is equal to the one deduced from the Fe XXV                   transitions
and Fe XXVI absorption lines. This low temperature phase, if
present on the line of sight, would then block all the radiation            4.1.1. From hard-to-soft
in the soft X-rays. On the other hand, Bianchi et al. (2017) esti-          As shown in Sect. 3, only a few temperature domains are ther-
mate the filling factor of this phase to be very low. So this strong        mally stable during hard states (see Fig. 2b) either at very high
absorption would only be observed as a sporadic change in the               temperature (>3 × 10⁷ K) or in a localized region around 106 K,
persistent neutral absorption and, in the case of AX J1745.6-               2 × 10⁵ K, or at a low temperature
A&A 649, A128 (2021)
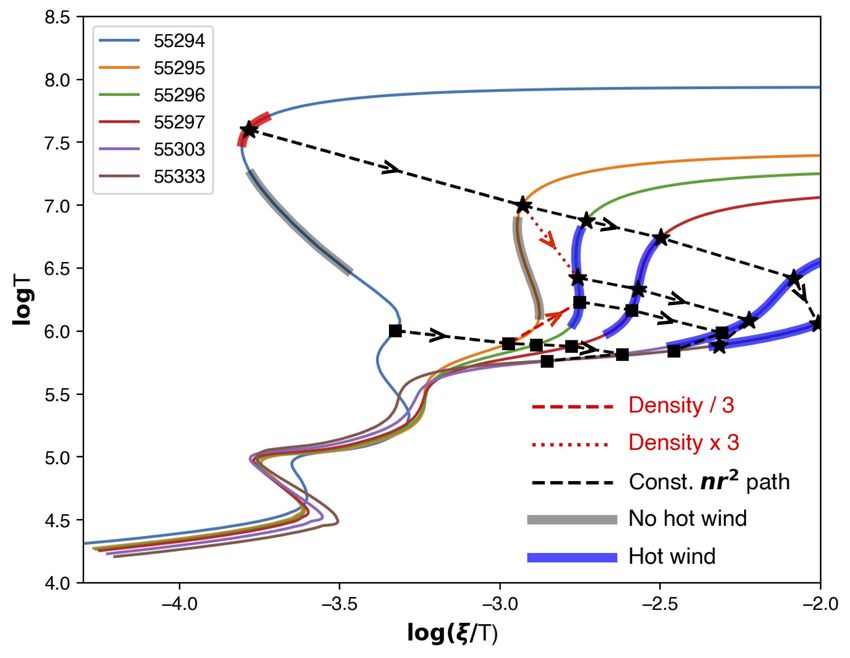
Fig. 4. Colored lines are the photoionization stability curves during the Fig. 5. Colored lines are the photoionization stability curves during the
hard-to-soft transition (see Fig. 2 for the meaning of the blue and gray soft-to-hard transition (see Fig. 2 for the meaning of the blue and gray
segments). The black dashed lines (squares and dashed line; star and segments). The black stars and dashed line correspond to a path of con-
dashed line) correspond to different paths with constant nr2 . The red stant nr2 from MJD 55565 until MJD 55594. The vertical red dotted
lines are the paths followed by the wind assuming an increase (red dot- lines correspond to isobaric (constant ξ/T ) evolutions of the wind. The
ted path) or decrease (red dashed path) in the wind density by a factor black square and dashed lines correspond to a path of constant nr2 start-
of 3 between MJD 55295 and MJD 55296. See Sect. 4.1.1 for the small ing from MJD 55594. The arrows indicate the time evolution.
temperature domain underlined in red on the stability curve of MJD
55294. The arrows indicate the time evolution.
requires a change in the wind temperature and density. Locally,
as soon as the plasma reaches a new (stable) temperature, the
very limited range of temperatures and ionization parameters in
new ionization equilibrium is expected to settle in almost imme-
the hard state. To reach the soft state, it appears more reason-
diately (Gonçalves et al. 2007). Of course, the complete migra-
able to assume a change in the physical characteristics of the
tion of the gas from a thermally unstable to a thermally stable
wind during the transition (i.e., nr2 does not stay constant). As state, which is itself a mix of hot and cold phases in interaction,
an example, we over-plotted in red dashed lines the paths fol-
takes some time. This is expected to occur on a timescale tmigr on
lowed by the wind if its density increases (red star and dashed the order of ∆H/c s where ∆H is the thickness of the thermally
line) or decreases (red square and dashed line) by a factor of 3 unstable region and c s is the sound velocity in the cold phase
between MJD 55295 and MJD 55296. In both cases, the change (see discussion in Gonçalves et al. 2007). This translates to
in density significantly modifies the paths compared to the con-
stant nr2 cases and they now cross the “hot wind” domains dur- N23
ing almost the entire soft state. Although empirical, this strongly tmigr . 2 × 10⁴ 1/2
(in units of s), (1)
T 5 n12
supports the need for a change in the wind properties during the
hard-to-soft transition in order to have detectable Fe XXV and where N23 is the column density in units of 1023 cm−2 , n12 is the
Fe XXVI lines in the soft states. In fact, the minimal increase in hydrogen density in units of 1012 cm−3 , and T 5 is the temperature
density to reach a stable “hot wind” domain when coming from of the cold gas in units of 105 K . Assuming a maximal extension
the black star and dashed line path is of about 30%, while the of the disk wind on the order of the binary separation in GX 339-
minimal decrease in density when coming from the black square 4, that is ∼1012 cm (Zdziarski et al. 2004, 2019), and an optically
and dashed line path is of about a factor of 2. thin wind, tmigr is shorter than a day. Thus the migration can eas-
ily occur between two RXTE pointings (generally separated by
4.1.2. From soft-to-hard 1 day).
The vertical dotted segments in Fig. 5 indicate the cases
We can repeat a similar procedure to follow the evolution of the where the evolution of the gas after MJD 55594 occurs at a con-
wind thermal state during the transition from the soft to the hard stant pressure (isobaric evolution i.e., a constant ξ/T ) and is fast
state. This is now illustrated in Fig. 5. We assume that at the begin- enough to assume that the average distance of the gas to the
ning of the transition, the wind is in the conditions where Fe XXV X-ray source would not change. In this case, the wind plasma
and Fe XXVI lines are detectable (black star on the MJD 55593 can transition to two different stable solutions, one hotter and
stability curve). Then a path at constant nr2 (black dashed line) the other colder, indicated by the upper and lower red squares,
reaches the unstable temperature domain of the stability curve respectively, on the MJD 55594 stability curve. It is also possi-
of MJD 55594 (black star on the MJD 55594 stability curve). In ble that the wind evolves into a mix of these two different plasma
fact, looking at the shape of the stability curves, this evolution phases where colder (and denser) structures are embedded in a
does not strongly depend on the starting point in the “hot wind” hotter (less dense) gas. This situation would be very similar to
domain of the soft states (MJD < 55594), and, as long as nr2 stays the one discussed by Bianchi et al. (2017) in the case of the wind
constant, the wind inevitably reaches an unstable state when the evolution observed in the neutron star AX J1745.6-2901 between
X-ray source enters in the hard state at MJD 55594. its soft and hard state. After MJD 55594, each of the two pos-
The evolution of the wind after MJD 55294 is thus quite sible wind phases keep on evolving depending on the spectral
unknown. The thermal instability forces the wind plasma to evolution of the X-ray source. As examples, we over-plotted in
leave the thermally unstable temperature domain and to reach Fig. 5 in red dashed lines the two possible paths where nr2 is
the other stable branches of the stability curve. This necessarily assumed to be constant.
A128, page 8 of 13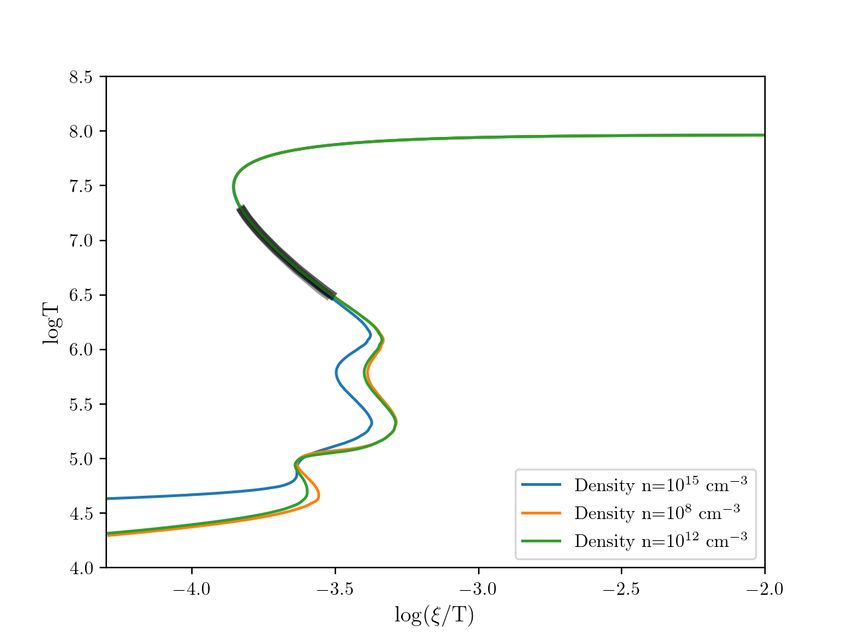
P.-O. Petrucci et al.: Expected evolution of disk wind properties along an X-ray binary outburst

4.1.3. A very favorable configuration for disk wind detection            et al. 2019; Kimura & Done 2019). But for the present discus-
                                                                         sion, we assume Cirr to be constantly equal to 0.05. Equation (2)
Interestingly, during the soft-to-hard and hard-to-soft transitions,     then shows that heating through irradiation is directly related to
the shape of the stability curve becomes almost vertical in the          the X-ray luminosity. The thermal timescale on which the disk
ionization range compatible with Fe XXV and Fe XXVI ions                 matter is heated is given by (e.g., Gonçalves et al. 2007)
(see e.g., the stability curve of MJD 55296 in Fig. 2h). This cor-
responds to a situation where the pressure equilibrium is satisfied                T5
in this ionization domain and this is a quite favorable mechanical       tth ∼           sec,                                             (3)
                                                                                 n12 Λ23
configuration for the wind. This could explain why we generally
observe the strongest wind absorption features in the middle of
                                                                         where, as in Eq. (1), n12 is the density expressed in 1012 cm−3 ,
the transition states (see Ponti et al. 2012).
                                                                         T 5 is the temperature in 105 K, and Λ23 is the cooling function in
                                                                         10−23 erg cm3 s−1 . It is thus reasonable to expect thermalization
4.2. Disk irradiation as a potential driver of the change in the         timescales of seconds to minutes. The travel time for the X-ray
     disk wind properties during the hard-to-soft transition             photons produced at a few Rg from the black hole and then to
As shown in Sect. 4.1.1, if we want to observe a hot wind at             the outer disk (R > 104 Rg ) is of the same order of magnitude.
the end of the hard-to-soft transition, an increase (or a decrease       Finally the density adjustment of the wind follows the thermal
depending on the wind phase at the beginning of the transition)          adjustment of the underlying disk on, typically, the local Keple-
in the wind density seems to be needed to make the wind evolve           rian timescale which is less than a day even at a disk radius of
into the stable ionization range for Fe XXV and Fe XXVI ions.            105 Rg (assuming a 10 solar mass black hole). Overall the entire
It is hard to estimate the timescale for such evolution given the        process (irradiation and wind density adjustment) is expected to
lack of long (several days) and continuous monitoring of a hard-         occur in less than a day.
to-soft state transition of an XrB. But the fact that absorption              We have reported the X-ray luminosity LX computed from
features are regularly observed in soft states suggests that the         the SED between 1 and 100 keV in Table 1. The luminosity
wind properties should evolve rapidly (for approximately days)           LX increases rapidly at the beginning of the transition with
after its entry in the soft state. This is somewhat problematic if       an increase of a factor of ∼1.5–2 between MJD 55294 and
the wind density scales only with the local disk density. Since          MJD 55303, while the accretion rate stays roughly constant (see
the latter scales with the disk accretion rate, the wind density         Table 1). Our qualitative estimates then suggest an increase in
would be expected to increase and then decrease during the out-          the disk surface heating through irradiation by the inner X-ray
bursting cycle. However, the disk wind region is estimated to            source during the hard-to-soft transition and, consequently, a
be located quite far away, beyond 104 Rg . There is, therefore, no       potential increase of the disk wind mass loading and wind den-
reason why the slow time evolution of the far-out wind driving           sity in a short (less than a day) timescale. Thus, looking at Fig. 4,
zone should always be contemporaneous with the rapid spectral            our result supports the scenario with an increase in the wind
changes of the SED emitted from the innermost disk regions.              density during the transition. A more quantitative impact on the
Irradiation of the outer disk by the inner X-ray emission seems          wind density would require, however, a precise modeling of the
the most natural process to link these two very distant regions          thermal balance of the disk outflowing disk surface layers which
on a very short timescale. Such radiative feedback of the inner          is out of the scope of the present paper.
regions on the outer disk wind properties is plausible, since
the deposition of any additional power Q at the disk surface
                                                                         5. Concluding remarks
leads to the enhancement of mass loss, both in magnetically-
driven (e.g., Casse & Ferreira 2000) and thermally-driven (e.g.,         We studied the expected evolution of the thermal properties of
Higginbottom & Proga 2015) outflows.                                     a hot disk wind (e.g., characterized by the presence of absorp-
     The amount of X-ray luminosity incident on the disk at a            tion lines of Fe XXV and Fe XXVI ions) in a low-mass X-ray
radius r = R/Rg in a ring of thickness ∆r depends on the exact           binary assuming it is present during the entire outburst (e.g.,
geometry. Estimates from a simple radial profile of the disk             Sánchez-Sierras & Muñoz-Darias 2020). For that purpose, we
aspect ratio provide an X-ray irradiation that is too low; this          have used the best fit SEDs obtained by Marcel et al. (2019) to
does not fit with the required disk accretion transport to explain       reproduce the RXTE/PCA data of GX 339-4 during the 2010–
the XrB outburst light curve durations (e.g., Dubus et al. 2001;         2011 outburst of the source. These broad-band SEDs have been
Tetarenko et al. 2018a, 2020). Following Dubus et al. (2001),            obtained in the JED framework described in Ferreira et al.
the intercepted and reprocessed X-ray irradiation (which corre-          (2006), Marcel et al. (2018a,b). For each of the 274 SEDs, we
sponds to the heating power deposit Q we are looking for) by a           computed the corresponding stability curve using the CLOUDY
disk ring can be simply expressed as                                     software. We were then able to follow the evolution of these sta-
            LX                  ∆r                                       bility curves all along the outburst. Our main conclusions are as
Q ' Cirr       2
                 2πrdr = Cirr LX ,                                 (2)   follows.
           4πr                  2r
                                                                           – All hard-state observations are characterized by stability
with Cirr being a parameter which encapsulates our ignorance                  curves where the ionization domain that is compatible with
concerning the irradiation geometry, the X-ray albedo, and                    Fe XXV and Fe XXVI ions is thermally unstable. On the
X-ray irradiating spectral shape. We note that Cirr is estimated              contrary, in all the soft state observations, this ionization
to be '0.05 to explain the XrB outburst light curve durations                 domain is thermally stable.
(see Tetarenko et al. 2018b and references therein). Actually, a           – During the spectral state transitions, the evolution of the sta-
(weak) radial dependence of Cirr is expected due to the radial                bility curve from stable to unstable conditions (in the soft-
variation of the disk aspect ratio (see Dubus et al. 2019 and ref-            to-hard transition) and reversely (in the hard-to-soft transi-
erences therein). The scattering of the X-rays by the disk wind               tion) can occur rapidly (a day timescale) due to the change
itself can also have some impact on the disk irradiation (Dubus               in the illuminating ionizing SED.
                                                                                                                           A128, page 9 of 13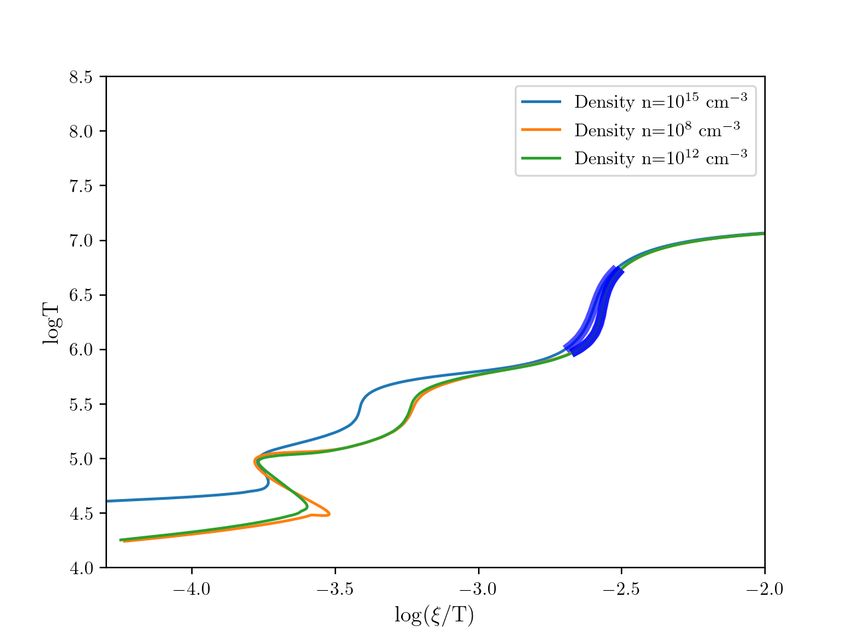
A&A 649, A128 (2021)

  – During the hard-to-soft transition, the common observations                   Ferland, G. J., Porter, R. L., van Hoof, P. A. M., et al. 2013, RM&AC, 49, 137
    of hot wind signatures in the soft states and their absence in                Ferreira, J. 2002, in Star Formation and the Physics of Young Stars, eds.
    the hard states suggests a rapid evolution of the disk wind                      J. Bouvier, & J. P. Zahn, EAS Pub. Ser., 3, 229
                                                                                  Ferreira, J. 2008, New Astron. Rev., 52, 42
    properties, most likely a significant increase (or decrease                   Ferreira, J., Petrucci, P.-O., Henri, G., Sauge, L., & Pelletier, G. 2006, A&A,
    depending on the ionization state of the wind at the begin-                      447, 813
    ning of the transition) in its density. Moreover, this evolution              Gatuzz, E., Díaz Trigo, M., Miller-Jones, J. C. A., & Migliari, S. 2019, MNRAS,
    must occur quasi simultaneously with the change in the spec-                     482, 2597
    tral state of the inner X-ray source located 104 –105 Rg away                 Gonçalves, A. C., Collin, S., Dumont, A. M., & Chevallier, L. 2007, A&A, 465,
    from the wind production site.                                                   9
                                                                                  Hameury, J. M. 2020, Adv. Space Res., 66, 1004
  – A heat deposit at the disk surface through X-ray irradiation                  Heida, M., Jonker, P. G., Torres, M. A. P., & Chiavassa, A. 2017, ApJ, 846, 132
    by the inner X-ray source could drive the required increase                   Higginbottom, N., & Proga, D. 2015, ApJ, 807, 107
    in the disk wind density in a short timescale (less than a day).              Higginbottom, N., Proga, D., Knigge, C., & Long, K. S. 2017, ApJ, 836, 42
  – During the soft-to-hard transition, if a hot wind is present in               Higginbottom, N., Knigge, C., Sim, S. A., et al. 2020, MNRAS, 492, 5271
    the soft states, the hardening of the X-ray emission unavoid-                 Homan, J., & Belloni, T. 2005, Ap&SS, 300, 107
    ably puts the hot wind into an unstable part of the stability                 Homan, J., Neilsen, J., Allen, J. L., et al. 2016, ApJ, 830, L5
                                                                                  Hynes, R. I., Haswell, C. A., Cui, W., et al. 2003, MNRAS, 345, 292
    curve in the hard states. Then the wind plasma necessarily                    Hynes, R. I., Steeghs, D., Casares, J., Charles, P. A., & O’Brien, K. 2004, ApJ,
    moves to a hotter or a colder (or a mix of the two) phase                        609, 317
    where Fe XXV and Fe XXVI ions cannot exist and, in con-                       Jacquemin-Ide, J., Ferreira, J., & Lesur, G. 2019, MNRAS, 490, 3112
    sequence, cannot be detected.                                                 Jacquemin-Ide, J., Lesur, G., & Ferreira, J. 2021, A&A, 647, A192
We note that the first item is also consistent with our initial                   Kallman, T. R., Bautista, M. A., Goriely, S., et al. 2009, ApJ, 701, 865
                                                                                  Kimura, M., & Done, C. 2019, MNRAS, 482, 626
assumption that hot winds are always launched from the out-                       Krolik, J. H., McKee, C. F., & Tarter, C. B. 1981, ApJ, 249, 422
skirts of the accretion disk, regardless of the spectral state of the             Kubota, A., Dotani, T., Cottam, J., et al. 2007, PASJ, 59, 185
innermost region. But they are only observable in soft states dur-                Liska, M., Tchekhovskoy, A., & Quataert, E. 2020, MNRAS, 494, 3656
ing which the required thermal stability occurs.                                  Marcel, G., Ferreira, J., Petrucci, P. O., et al. 2018a, A&A, 615, A57
    Recent numerical simulations (e.g., Zhu & Stone 2018;                         Marcel, G., Ferreira, J., Petrucci, P. O., et al. 2018b, A&A, 617, A46
                                                                                  Marcel, G., Ferreira, J., Clavel, M., et al. 2019, A&A, 626, A115
Jacquemin-Ide et al. 2019 and references therein) show that disk                  Marcel, G., Cangemi, F., Rodriguez, J., et al. 2020, A&A, 640, A18
winds are expected from low magnetized turbulent accretion                        Mata Sánchez, D., Muñoz-Darias, T., Casares, J., et al. 2018, MNRAS, 481,
disks threaded by a large-scale magnetic field, which would cor-                     2646
respond to our SAD. For high magnetization, however, which                        Meyer, F., & Meyer-Hofmeister, E. 1981, A&A, 104, L10
would correspond to our JED, powerful jets are rather produced                    Miller, L., Turner, T. J., & Reeves, J. N. 2008a, A&A, 483, 437
(e.g., Liska et al. 2020). Our results thus provide a case for                    Miller, J. M., Raymond, J., Reynolds, C. S., et al. 2008b, ApJ, 680, 1359
                                                                                  Miller, J. M., Fabian, A. C., Kaastra, J., et al. 2015, ApJ, 814, 87
the presence in XRBs of a large-scale magnetic field through-                     Muñoz-Darias, T., Casares, J., & Martínez-Pais, I. G. 2008, MNRAS, 385, 2205
out the entire accretion disks and whose magnetization would                      Muñoz-Darias, T., Casares, J., Mata Sánchez, D., et al. 2016, Nature, 534, 75
evolve from high values in the inner regions (i.e., Liska et al.                  Muñoz-Darias, T., Casares, J., Mata Sánchez, D., et al. 2017, MNRAS, 465,
2020 configuration), to much lower values in the outer regions,                      L124
where a disk wind would be launched (i.e., Zhu & Stone 2018                       Neilsen, J., & Homan, J. 2012, ApJ, 750, 27
                                                                                  Neilsen, J., Rahoui, F., Homan, J., & Buxton, M. 2016, ApJ, 822, 20
or Jacquemin-Ide et al. 2019 configuration). In recent 3D simu-                   Parker, M. L., Tomsick, J. A., Kennea, J. A., et al. 2016, ApJ, 821, L6
lations (Jacquemin-Ide et al. 2021), such a radial stratification of              Ponti, G., Fender, R. P., Begelman, M. C., et al. 2012, MNRAS, L417
the magnetization is expected as the outcome of a global read-                    Ponti, G., Bianchi, S., Muñoz-Darias, T., et al. 2015, MNRAS, 446, 1536
justment of the disk (see also Scepi et al. 2019, 2020). If true,                 Ponti, G., Bianchi, S., Muñoz-Darias, T., et al. 2016, Astron. Nachr., 337, 512
this could have a significant impact on the secular evolution of                  Rahoui, F., Coriat, M., & Lee, J. C. 2014, MNRAS, 442, 1610
the accretion flow.                                                               Remillard, R. A., & McClintock, J. E. 2006, ARA&A, 44, 49
                                                                                  Sánchez-Sierras, J., & Muñoz-Darias, T. 2020, A&A, 640, L3
                                                                                  Scepi, N., Dubus, G., & Lesur, G. 2019, A&A, 626, A116
Acknowledgements. Part of this work has been done thanks to the financial         Scepi, N., Lesur, G., Dubus, G., & Jacquemin-Ide, J. 2020, A&A, 641, A133
supports from CNES and the French PNHE. SBi acknowledges financial sup-           Schulz, N. S., & Brandt, W. N. 2002, ApJ, 572, 971
port from the Italian Space Agency under grant ASI-INAF 2017-14-H.O. G. P.        Schulz, N. S., Kallman, T. E., Galloway, D. K., & Brandt, W. N. 2008, ApJ, 672,
acknowledges funding from the European Research Council (ERC) under the              1091
European Union’s Horizon 2020 research and innovation program (grant agree-       Shakura, N. I., & Sunyaev, R. A. 1973, A&A, 24, 337
ment No. [865637]).                                                               Shidatsu, M., & Done, C. 2019, ApJ, 885, 112
                                                                                  Shidatsu, M., Done, C., & Ueda, Y. 2016, ApJ, 823, 159
                                                                                  Smak, J. 1984, Acta Astron., 34, 161
References                                                                        Tarter, C. B., Tucker, W. H., & Salpeter, E. E. 1969, ApJ, 156, 943
                                                                                  Tauris, T. M., & van den Heuvel, E. P. J. 2006, Formation and Evolution of
Begelman, M. C. 2012, MNRAS, 420, 2912                                               compact Stellar X-ray Sources, 39, 623
Bianchi, S., Ponti, G., Muñoz-Darias, T., & Petrucci, P.-O. 2017, MNRAS, 472,     Tetarenko, B. E., Sivakoff, G. R., Heinke, C. O., & Gladstone, J. C. 2016, ApJS,
   2454                                                                              222, 15
Blandford, R. D., & Begelman, M. C. 1999, MNRAS, 303, L1                          Tetarenko, B. E., Lasota, J. P., Heinke, C. O., Dubus, G., & Sivakoff, G. R. 2018a,
Casse, F., & Ferreira, J. 2000, A&A, 361, 1178                                       Nature, 554, 69
Chakravorty, S., Lee, J. C., & Neilsen, J. 2013, MNRAS, 436, 560                  Tetarenko, B. E., Dubus, G., Lasota, J. P., Heinke, C. O., & Sivakoff, G. R. 2018b,
Chakravorty, S., Petrucci, P.-O., Ferreira, J., et al. 2016, A&A, 589, A119          MNRAS, 480, 2
Clavel, M., Rodriguez, J., Corbel, S., & Coriat, M. 2016, Astron. Nachr., 337,    Tetarenko, B. E., Dubus, G., Marcel, G., Done, C., & Clavel, M. 2020, MNRAS,
   435                                                                               495, 3666
Coriat, M., Corbel, S., Buxton, M. M., et al. 2009, MNRAS, 400, 123               Ueda, Y., Murakami, H., Yamaoka, K., Dotani, T., & Ebisawa, K. 2004, ApJ,
Dannen, R. C., Proga, D., Waters, T., & Dyda, S. 2020, ApJ, 893, L34                 609, 325
Díaz Trigo, M., & Boirin, L. 2016, Astron. Nachr., 337, 368                       Waters, T., Proga, D., & Dannen, R. 2021, ApJ, submitted. [arXiv:2101.09273]
Done, C., Gierlinski, M., & Kubota, A. 2007, A&ARv, 15, 1                         Zdziarski, A. A., Gierlinski, M., Mikołajewska, J., et al. 2004, MNRAS, 351,
Dubus, G., Hameury, J. M., & Lasota, J. P. 2001, A&A, 373, 251                       791
Dubus, G., Done, C., Tetarenko, B. E., & Hameury, J.-M. 2019, A&A, 632, A40       Zdziarski, A. A., Ziółkowski, J., & Mikołajewska, J. 2019, MNRAS, 488,
Dunn, R. J. H., Fender, R. P., Körding, E. G., Belloni, T., & Cabanac, C. 2010,      1026
   MNRAS, 403, 61                                                                 Zhu, Z., & Stone, J. M. 2018, ApJ, 857, 34

A128, page 10 of 13
P.-O. Petrucci et al.: Expected evolution of disk wind properties along an X-ray binary outburst
Appendix A: The JED-SAD framework
The SEDs used in this study were computed in the JED-SAD
framework described in detail in Marcel et al. (2018b,a, 2019).
While the reader is referred to these papers for more details,
we briefly recall the main characteristics of this model here.
JED solutions assume the existence of a large-scale vertical
magnetic field Bz threading the disk. The JED magnetization
µ = Bz /(µ0 Ptot ), where Ptot includes the plasma and radiation
pressures, is in the range from [0.1–1]. In these conditions, in
a JED, part of the accreted matter is ejected and the accretion
rate is a function of the radius, that is to say Ṁ(R) ∝ R p with
p being the ejection parameter6 . In contrast with the ADIOS
model (Blandford & Begelman 1999; Begelman 2012), the ejec-
tion efficiency p is not a free parameter in the JED model, but
it is a consequence of the disk properties (magnetization, tur-
bulence). Its value results from the resolution of the full set of
MHD equations governing the interdependent accretion-ejection
physics in the presence of a large-scale magnetic field (see
Ferreira 2002, 2008 for reviews).
The SEDs of a JED-SAD configuration combine the emis-
sion of the JED, which is present between RISCO and a transition
radius Rtr , and the emission of the nonejecting SAD extending
beyond Rtr . The JED thermal structure was computed taking into
account the local turbulent heating, coulomb heat exchange (i.e., Fig. A.1. Results of the fitting procedure of Marcel et al. (2019) applied
a two-temperature plasma), heat advection, and cooling using to the 2010–2011 outburst of GX 339-4. The black markers are fits
a bridge formula for optically thick and thin plasmas. The opti- taken from Clavel et al. (2016) reported with their error bars when
cally thin cooling processes are bremsstrahlung, synchrotron and reliable, while color lines display the best fit values obtained with the
local, and nonlocal (on the soft photons emitted by the outer JED-SAD SED: Green, blue, yellow, and red correspond to hard, hard-
SAD) Compton scattering processes. The SED mainly depends intermediate, soft-intermediate, and soft states, respectively. From top
to bottom: 3–200 keV total luminosity, L3−200 (in Eddington units), the
on two parameters: the transition radius Rtr and the inner disk
power-law luminosity fraction L pl /L3−200 , defined as the ratio of the
accretion rate Ṁ(RISCO ) (simply noted Ṁ hereafter) at RISCO . The power-law flux to the total flux in the 3–200 keV range, and the power-
global spectrum emitted by a JED-SAD disk configuration char- law index Γ. The transparent colored areas correspond to the confidence
acterized by (Rtr , Ṁ) was self-consistently computed along with intervals of a 5% and 10% error margin (see Marcel et al. 2019). The
the disk thermal and dynamical states. It appears that the JED vertical dashed line corresponds to the MJD reported in Table 1.
can play the role of the hot corona needed to explain the hard
X-ray emission in XrB. Its emission dominates the high energy
part of the SED, while the multicolor disk emission from the discussed in detail in Marcel et al. (2019) (the three other out-
SAD dominates at low energy (Marcel et al. 2018a). We note bursts of this source during the RXTE era have been analyzed in
that for Rtr = RISCO , there is no JED. The entire accretion flow, Marcel et al. 2020). We have reported the comparison between
then, is a SAD and the source is in a soft state. On the contrary, the observations and the model in Fig. A.1. The observed
large Rtr (
RISCO ) characterize hard states, while Rtr on the order values of the 3–200 keV total luminosity, the power-law lumi-
of a few RISCO are typical of (either hard or soft) intermediate nosity fraction L pl /L3−200 (defined as the ratio of the power-law
states. flux to the total flux in the 3–200 keV range), and the power-law
This model was applied with success to the RXTE/PCA data index Γ obtained by Clavel et al. (2016) are reported with black
of the 2010–2011 outburst of GX 339-4. In this case, for RISCO , markers at the top, middle, and bottom panels, respectively. The
a black-hole mass of 5.8 solar masses7 and a black hole spin corresponding values produced by the best fit SED obtained by
a = 0.94 are assumed (see references in Marcel et al. 2019). The Marcel et al. (2019) are over-plotted with colored markers. The
distance of GX 339-4 is also assumed to be 8 kpc (Hynes et al. MJD of Table 1 are also indicated with dashed vertical lines. The
2004; Zdziarski et al. 2004; Parker et al. 2016). These results are best fit SEDs reproduce the observations very well except in the
soft state for what concerns the power law component (middle
6
The ejection parameter is labeled ξ in Marcel et al. (2019). It was and bottom panels, red markers). In the soft states, however, the
changed to p, which is not to be confused with the ionization parameter statistics at high energy (>10 keV) of the RXTE/PCA data is too
of the wind.
7 low to provide good constraints on this power law and the com-
Multiple studies have been performed to constrain the BH mass in
GX 339-4 and have led to different estimations (e.g., Hynes et al. 2003; parison is not relevant. In Fig. A.2, we have also reported the
Muñoz-Darias et al. 2008; Parker et al. 2016; Heida et al. 2017). For SED for MJD 55617, 55208, and 55297, detailing the impor-
simplification, and since there is no consensus about the GX 339-4 tance of the different radiative processes (bremsstrahlung, syn-
mass, we chose for it to be the central value. chrotron, and Compton).
A128, page 11 of 13A&A 649, A128 (2021)
10-9
10-10
Flux
Flux
10-10
10-11
SAD SAD
Total Total
Brem Brem
Syn 10-11 Syn
Compton Compton
10-12
10-2 10-1 100 101 102 103 10-2 10-1 100 101 102 103
Energy (keV) Energy (keV)
10-8
Flux
10-9
SAD
Total
Brem
10-10 Syn
Compton
10-2 10-1 100 101 102 103
Energy (keV)
Fig. A.2. JED-SAD SED for MJD 55617 (top left), 55208 (top right), and 55297 (bottom left). The different radiative processes (bremsstrahlung,
synchrotron, and Compton) are plotted in colored, thick dashed lines (see the legends). We have also separated the Compton component in external
Compton (thin blue dashed line), comptonized bremsstrahlung (thin blue dot-dashed line), and comptonized synchrotron (thin blue dotted line).
Appendix B: Effect of density on the stability curve
shape
In Fig. B.1, we have reported the stability curves computed
with CLOUDY for MJD 55293 (top) and MJD 55297 (bottom)
for different values of the plasma density varying between 108
and 1015 cm−3 . If differences at low ξ are visible, although not
large enough to qualitatively change the general behavior of the
curves, at high ξ the stability curves are almost independent of
the density. The reason for this is that Compton scattering domi-
nates there and both heating and cooling terms scale with density
in the same way.
Fig. B.1. Stability curves computed with CLOUDY for MJD 55293
(top) and MJD 55297 (bottom) for different values of the plasma density
varying between 108 and 1015 cm−3 .
A128, page 12 of 13P.-O. Petrucci et al.: Expected evolution of disk wind properties along an X-ray binary outburst
Appendix C: Ion fraction
Fig. C.1. Fe XXV (solid lines) and Fe XXVI (dashed lines) ion frac-
tions for three MJD of the 2010–2011 outburst of GX 339-4. They were
computed by using the SED of Marcel et al. (2019). The vertical dot-
ted lines define, for each curve, the range in log ξ used to create the
highlighted (blue or gray) areas on the stability curves presented in this
paper. The lower limit in log ξ for each range corresponds to an ionic
fraction equal to 90 percent of the ionic fraction peak of Fe XXV, while
the upper limit corresponds to an ionic fraction equal to 90 percent of
the ionic fraction peak of Fe XXVI. If this upper limit is larger than five
(like for MJD 55450), it is put equal to five.
In Fig. C.1, we have reported three examples of ion fractions for
three MJD of the 2010–2011 outburst of GX 339-4.
A128, page 13 of 13You can also read