State of Working Pennsylvania 2020 - September 2020 by Stephen Herzenberg, Muhammad Maisum Murtaza, and Claire Kovach - Pennsylvania Budget ...
←
→
Page content transcription
If your browser does not render page correctly, please read the page content below

State of Working Pennsylvania 2020

                    September 2020

    by Stephen Herzenberg, Muhammad Maisum Murtaza,
                    and Claire Kovach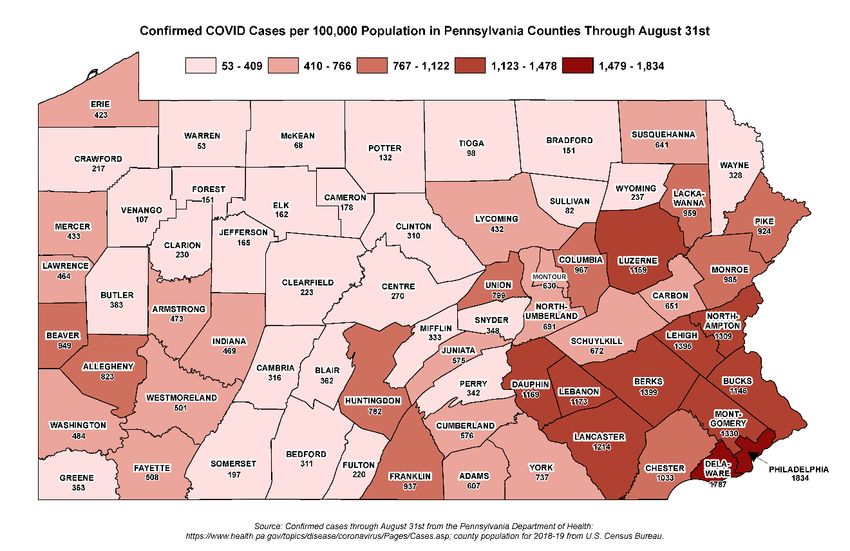
The Keystone Research Center (KRC) was founded in 1996 as an independent, non-partisan research
and policy organization to broaden public discussion on strategies to achieve a more prosperous and
equitable Pennsylvania economy. Since its creation, KRC has become a leading source of independent
analysis of Pennsylvania’s economy and public policy. KRC is located at 412 North Third Street, Harrisburg,
Pennsylvania 17101‐1346. Most of KRC’s original research is available on the KRC/PBPC website at www.
krc-pbpc.org. KRC welcomes questions or other inquiries about its work at 717‐255‐7181.

About the Authors

Stephen Herzenberg, KRC’s executive director, holds a PhD in economics from MIT. He writes widely
on how Pennsylvania and the United States can achieve an economy that works for all. His writings for
national audiences include Towards an AI Economy That Works for All, Keystone Research Center, 2019;
Losing Ground in Early Childhood Education, Economic Policy Institute (EPI), 2005; New Rules for a New
Economy: Employment and Opportunity in Postindustrial America, Cornell/ILR Press, 1998; U.S.-and Mexico
Trade: Pulling Together or Pulling Apart?, Office of Technology Assessment, U.S. Congress, 1992.

Muhammad Maisum Murtaza is a research associate who joined KRC in 2020 after interning for the
organization in summer of 2019. He has an undergraduate degree in economics from Pennsylvania
State University where he also got experience teaching and organizing lesson plans for an ecology
course that he approached from a sustainability perspective. He was later a guest lecturer, for that same
course, tackling the basic economic trade-offs of expanding conservation and social services. During his
internship with KRC, Maisum helped Stephen Herzenberg write The State of Working Pennsylvania 2019
and is now working on several projects on sustainability, immigration, and new developments in the labor
force.

Claire Kovach is KRC’s senior research analyst. She is a Ph.D. candidate at Pennsylvania State University
and holds a master’s degree in sociology from the University of Akron (OH). She interned with The Center
on Budget and Policy priorities in Washington, D.C. where she worked on data-driven poverty and
immigration policy topics. Her dissertation centers on multidimensional hardship experience and the
importance of studying hardship without over-relying on income measures. Her most recent work for a
national audience is Poverty and the Incidence of Material Hardship, Revisited.

Acknowledgments

Thanks to Stephanie Frank, KRC office manager, for generating the charts, figures and cover for this report;
Kirstin Snow, communications director for KRC and its Pennsylvania Budget and Policy Center (PBPC), for
assistance with the release of the report; and to Erica K Freeman, deputy communications director, for
editing the document.

Support KRC

The work of KRC is supported by grants from charitable foundations, research contracts with various
organizations, and contributions from organizations and individuals who share KRC’s vision of broadly
shared prosperity in Pennsylvania. To learn how you or your organization can support KRC, please visit the
KRC website at www.krc-pbpc.org or call 717‐255‐7181.
Executive Summary
Since the spread of COVID-19 accelerated in mid-March of this year, the sharp decline in U.S. economic
growth has been faster than at any previous time in recorded economic history—even the Great
Depression. The first part of this decline was, in large part, deliberate—stopping non-essential work so
that people could social distance at home and stem rising infection rates. The length, and now the
depth, of the crisis are increasingly self-inflicted wounds—the consequence of the lack of clear and
effective national policies to contain the virus and now the failure to extend the economic relief families
need to pay rent, put food on the table, and cover other essentials. A central message of this report is
that it matters a great to working people in Pennsylvania that now, and over the next several years, the
nation and state adopt policies that promote a strong and just economic recovery.

In the first quarter of 2020, U.S. Gross Domestic Product (GDP) plunged 9.5%, an annual rate of decline
of nearly a third. (State GDP data for the second quarter are not yet available.)

Pennsylvania’s economy shrank faster than the nation’s, then partially recovered. Jobs and
unemployment data show that Pennsylvania’s economy shrank more quickly than the nation’s at first,
but our job growth then improved relative to the nation’s in June and July.

    •   From February to April, Pennsylvania lost 1.1 million jobs, 18% of the February total. The U.S.
        lost 22 million jobs, 15% of the February total. By July, Pennsylvania had regained nearly half
        (48%) of the jobs it lost from February to April versus 42% in the United States.
    •   The Pennsylvania unemployment rate climbed to 16.1% in April versus 14.7% in the U.S. The
        U.S. unemployment rate has since fallen to 10.2% versus 13.7% in Pennsylvania.
    •   The Pennsylvania employment rate—jobs as a share of the population aged 16 and over—is a
        better measure of overall joblessness than unemployment because unemployment does not
        include large numbers of jobless and underemployed. The Pennsylvania employment rate
        plummeted from 59% in February to 49% in April, then rebounded to 54%. The national rate
        declined from 59% to 50%, then also rebounded to 54%.

Our state’s rapid economic decline and then more rapid job growth may reflect Governor Wolf’s success
in shutting down the economy and the start of a payoff for declining infection rates. If more businesses
feel safe to reopen and more people feel they can safely return to work, the economy can grow more
quickly.

This recession has brought with it a cruel, triple whammy that harms many vulnerable workers,
including low-wage workers, women, and people of color.

    1. The industries forced to shut down to allow social distancing—restaurants, bars, and in-store
       retail—disproportionately employ women and people of color.
    2. The essential workers that have endured increased health risks on the job because of
       the importance of their industries to the general population—such as health care,
       grocery stores, and distribution—are nearly two-thirds female. These workers are 50%
       more likely to be Black and slightly more likely to be Hispanic than the Pennsylvania
       workforce as a whole.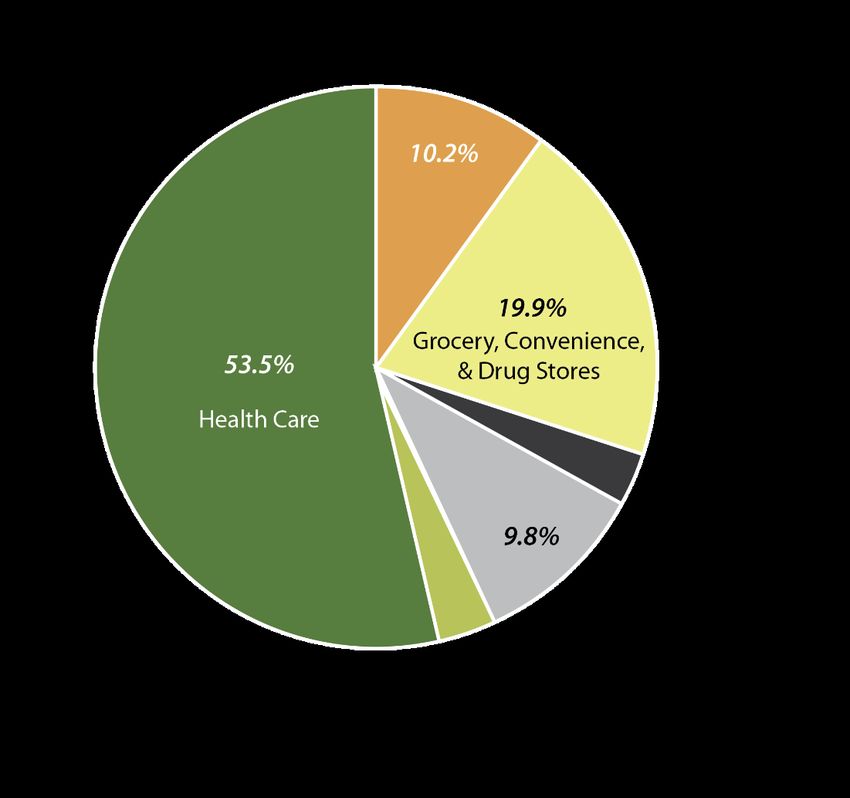
3. Many immigrants, despite risking their lives for the rest of us as essential workers, have been
       denied access to pandemic social benefits.

Within Pennsylvania, unlike prior recessions, unemployment rates have not increased more in
rural than urban areas. Instead, on average, unemployment has risen more where COVID
infection rates are higher. This underscores the importance of reining in the virus so that
businesses and people feel safe restarting the economy.
While most of this report uses data available at least quarterly, the penultimate section examines
annual wage data through 2019, shortly before the COVID-19 outbreak.

    •   Inflation-adjusted wages in the bottom half of the Pennsylvania wage distribution only reached
        their 2006 level in 2015-17. The recession now threatens to reduce wages below 2006 levels.
    •   At the low end of the earnings distribution, Pennsylvania workers have experienced lower
        recent wage gains than workers in neighboring states. From 2018 to 2019, wages of
        Pennsylvania low-wage workers declined slightly. Their neighboring state peers enjoyed gains of
        3.5% to 5%.
    •   The reason for this divergent experience is blindingly simple: state minimum wage policies. In
        neighboring states, lawmakers have increased their state-level minimum wage above the
        federal $7.25 per hour, sometimes by a lot. Pennsylvania lawmakers have not.

In sum, the COVID crash has made more visible what “The State of Working Pennsylvania” has
documented since 1996. Working people in the United States and in Pennsylvania have taken it on the
chin for 40 years. With incomes stagnant, many families live paycheck to paycheck, especially Black,
Latinx, and female-headed households. These families desperately need a quick and just recovery, one
that addresses the immediate deprivation from COVID and long-term inequality.

Given how our economy works, we won’t get a strong recovery without a just recovery. Since workers’
buying power drives the economy forward, when their incomes stagnate so does the economy. In the
short run, to avoid a downward spiral of the economy into depression, we need another injection of
federal relief that puts money in the pockets of people who will spend it, including:

    •   Extension of the $600-per-week boost in federal unemployment benefits. As a result of our
        early, rapid rise in unemployment, Pennsylvanians received $10 billion (over $800 million per
        week) in extra unemployment benefits from the federal CARES Act by the end of June—6.6% of
        total national benefits. Removing that income and buying power from Pennsylvania’s economy
        could make the slow job growth associated with Governor Corbett’s $1 billion cut in education
        funding in 2011 seem like a picnic.
    •   More relief for state and local government. Without this, deep cuts in government jobs and a
        collapse in the buying power of public employees will drag the economy into deeper recession.
    •   A federal stimulus that invests in infrastructure and reducing carbon emissions, work performed
        outside and with less risk of triggering further upticks in COVID-19 cases.

With Pennsylvania, the state should:

    •   Put the state’s minimum wage on a path to $15 per hour as three of our neighbors have already
        done.

                            The State of Working Pennsylvania 2020 | 2
• Take additional state actions necessary to prevent an eviction tsunami to complement the
Centers for Disease Control extension of the federal eviction moratorium on public health
grounds that was just announced on September 1.
• Identify shovel-ready infrastructure and green growth projects that could absorb federal
stimulus investments, including in universal, high-quality broadband.
• Capitalize on federal subsidies to expand work sharing—reduced work hours and partial
unemployment benefits. Work sharing reduces workers’ income losses, helps businesses bounce
back when the economy kicks into gear, and can lower unemployment in future recessions.
Long-term, the minimal wage gains from 2006 to 2019 remind us that the policies in place today—rigged
heavily against working people—result in rising inequality, including based on race. Achieving shared
prosperity that can end low growth due to slowly growing incomes requires structural changes that
rebalance the scales between workers and corporations. State and federal lawmakers’ top priority
should be enacting policies that raise wages and strengthen workers’ rights so that we can achieve the
economy we want—an economy that works for all—not the economy we’ve had.
The COVID Crash
As in prior versions of “The State of Working Pennsylvania,” this year’s Keystone Research
Center report looks at the economy from the perspective of working people. Because the
economic impact of COVID-19 has unfolded over weeks and months, not years, we rely on data
sources available weekly, monthly, or at least quarterly more than we have in prior years. When
we look further back, we often use 2006 as our starting point. That year was the peak of the
economic expansion prior to the one ended by COVID-19. The period 2006 until 2019 or early
2020 thus makes up a full business cycle and allows us to (a) compare unemployment,
employment, and wage trends at the same point in the business cycle pre-Great Recession and
pre-COVID and (b) to compare the current recession to the Great Recession.
An Unprecedented Plunge in GDP
The plunge of the U.S. economy since the COVID pandemic hit full force in mid-March 2020 has been
faster than at any previous time in recorded U.S. economic history. The Gross Domestic Product
dropped 9.5% in the second quarter of 2020—a stunning annual rate of 32.9%. This was the steepest
quarterly decline since at least 1875, according to economists Nathan S. Balke and Robert J. Gordon. 1 It
exceeded an 8.4% decline in the third quarter of 1893 after a financial panic and a run on the banks. It
also exceeded the 7.2% drop in the fourth quarter of 1937, after Congress and the Roosevelt
administration prematurely took their foot off the deficit-spending pedal in the Great Depression. 2 The
recent rise in U.S. unemployment also exceeds that at the start of the Great Depression.
1
See Nathan Balke and Robert J. Gordon, “Appendix B: Historical Data,” in Balke and Gordon (eds), The American
Business Cycle: Continuity and Change, University of Chicago Press, 1986, see pp. 789-842 for quarterly data;
online at https://www.nber.org/chapters/c10036.pdf. Cited in Rachel Siegel and Andrew Van Dam, “U.S. economy
contracted at fastest quarterly rate on record from April to June as coronavirus walloped workers, businesses;
https://www.washingtonpost.com/business/2020/07/30/gdp-q2-coronavirus/ (pp. 789-842).
2
For charts showing monthly GDP and unemployment changes in the first four months of the Great Depression and
the current recession, see David C. Wheelock, “Comparing the COVID-19 Recession with the Great Depression,”
Economic Synopsis, Federal Reserve Bank of St. Louis, August 12, 2020;
The State of Working Pennsylvania 2020 | 3The Economy Freezes Even More Quickly in Pennsylvania
While state-level GDP data for the second quarter are not yet available, jobs and unemployment data
show that, if anything, the pandemic has had an even larger immediate impact on the Pennsylvania
economy than the national one. To some extent, this was a deliberate outcome of the state’s more
decisive actions than some other states to freeze the economy and slow the spread of the coronavirus.
From February to April, Pennsylvania lost 1.1 million jobs, 18% of the February total, and the U.S. lost 22
million, 15% of the February total. By July, Pennsylvania had regained nearly half (48%) of the jobs it lost
from February to April versus 42% in the United States (Figure 1). That said, we still had 584,000 fewer
jobs in July than in February.
Figure 1.
Initial claims for unemployment available weekly (and, until recently, daily in Pennsylvania) were the
first data to show the unprecedented impact of the COVID-19 crisis on the economy (Figure 2). Nothing
like the spike that began in the third full week of March has ever happened before. For the eight weeks
from the weeks ending January 25, 2020, and March 14, initial claims in Pennsylvania averaged about
14,000. In the following week, ending March 21, initial claims jumped to 377,451, increasing further to
just over 400,000 in the following week. In the last four weeks of data currently available (through the
week ending August 22), the number of initial claims fell back down to a range of 25,000 to 30,000, still
twice the pre-COVID level.
https://research.stlouisfed.org/publications/economic-synopses/2020/08/12/comparing-the-covid-19-recession-with-
the-great-depression.
The State of Working Pennsylvania 2020 | 4Figure 2.
While a spike in initial unemployment claims can be seen across the country, Pennsylvania’s claims
increased more than twice as much as the nation’s (compared to the prior eight-weeks) in the first full
week of COVID, ending March 21—i.e., a difference of nearly 200,000 Pennsylvanians. For most of the
weeks since then, the increases in Pennsylvania initial weekly claims relative to the base period have
hovered around half as much as the national increases.
As a result of social distancing policies that slowed the economy to keep people safe, the national and
Pennsylvania unemployment rates rose in April 2020 to 14.7% and 15.1%, respectively.
The State of Working Pennsylvania 2020 | 5Figure 3.
Figure 4 takes a longer view of national and Pennsylvania unemployment over the last business cycle. In
2010, three years into the Great Recession, the three-month moving average of unemployment peaked
at 10% nationally and 9% in Pennsylvania. In just the first six weeks of the current economic freeze,
unemployment rates both nationally and in Pennsylvania increased roughly twice as much.
Figure 4.
The State of Working Pennsylvania 2020 | 6Box: Who Counts as Unemployed—and Who Doesn’t—in the Pandemic?
Official unemployment rates underestimate overall joblessness because they don’t count several groups
of jobless or underemployed (part-time) people as unemployed. For example, people not looking for
work, including because they are discouraged and do not think they could find work, are not considered
in the labor force. Involuntary part-time workers—people working part time for economic reasons—also
do not count as unemployed.
Both of these groups not counted as unemployed have likely grown in the current recession. 3 Many
people in recent months could not look for work because it is not safe to do so in the pandemic. In July,
the Bureau of Labor Statistics estimates this group at 6.5 million people nationally.
The Economic Policy Institute also highlights that the number of involuntary part-time workers roughly
doubled in the Great Recession, increasing by more than 4 million people. 4
Employment Rates: Initial Plunge with Some Recovery
Spikes in unemployment rates and unemployment insurance claims do not tell the whole story of
joblessness in the state, in part because some people are being told to stay at home for their health yet
are not counted as unemployed (Box 1). Therefore, many economists rely instead on the “employment
rate” to gauge the increase in joblessness in a recession. Here we define the employment rate as total
non-farm jobs as a share of the population aged 16 or over. Figure 5 shows that when Pennsylvania lost
over one million jobs between February and April, the Pennsylvania employment rate fell from 59.4%—
just above the U.S. 58.7% level—to 48.5%, more than a percentage point below the U.S. 50.1% level.
Both the Pennsylvania and the U.S. employment rates recovered by July to just shy of 54%.
3
For more detail on who the Bureau of Labor Statistics includes or excludes within the unemployed, including some
discussion and data related to these issues in the pandemic, go to https://www.bls.gov/cps/effects-of-the-
coronavirus-covid-19-
pandemic.htm#:~:text=(To%20be%20counted%20as%20unemployed,work%20or%20on%20temporary%20layoff.)
&text=The%20number%20of%20people%20not,7.0%20million%20versus%209.7%20million.
4
Elise Gould, “The unemployment rate is not the right measure to make economic policy decisions around the
coronavirus-driven recession. Policymakers should use the employment rate to continue or stop economic
assistance,” March 20, 2020; https://www.epi.org/blog/the-unemployment-rate-is-not-the-right-measure-to-
make-economic-policy-decisions-around-the-coronavirus-driven-recession/.
The State of Working Pennsylvania 2020 | 7Figure 5.
Figure 6 shows that the plunge in the employment rate in Pennsylvania from February to April was two
and a half times larger than the drop over the entire Great Recession.
Figure 6.
The State of Working Pennsylvania 2020 | 8Unemployment Increases More in Areas With Higher COVID Rates
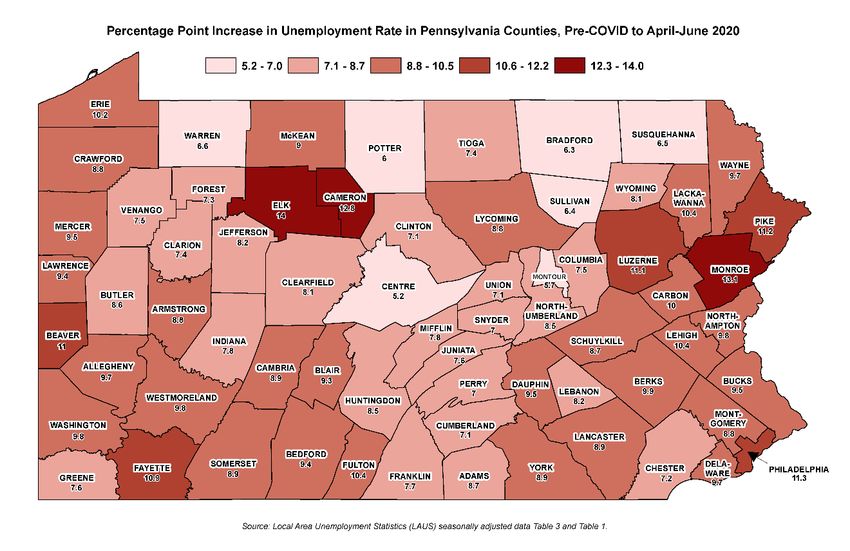
Within Pennsylvania, in prior recent recessions, unemployment rates generally increase more in rural
than urban areas. As Map 1 shows, this has not been the case in this downturn. Unemployment has
increased slightly more in urban than rural areas, and Pennsylvania’s “T,” except for Elk and Cameron
Counties, has experienced low increases in unemployment. The overall (employment-weighted) average
increase in the unemployment rate in rural Pennsylvania counties, pre-COVID (Dec. 2019 to Feb. 2020)
to now (April to June 2020) is 8.7%. For urban counties the same figure is 9.6%.
Map 1.
Why is the unemployment rate increasing more in rural than urban areas in this recession unlike
previous ones? Map 2 suggests that one factor could be the incidence of COVID-19. The rural T has
much lower case rates for the coronavirus rates than urban areas. The statistical correlation between
COVID rates and the increase in county unemployment rate since the three months before March 2020
is 0.33, indicative of a relationship between the two variables although other factors also contribute to
variations in the increase in unemployment at the county level.
The State of Working Pennsylvania 2020 | 9Map 2.
The relationship between COVID rates and increases in the unemployment rate may be multi-faceted.
Lower COVID rates allowed counties to proceed more quickly to “green” during Pennsylvania’s
economic reopening. In addition, lower COVID rates may have made businesses more willing to reopen
and workers more willing to go back to the job. Higher COVID rates correlate with higher increases in
unemployment underscores the importance of stemming the further spread of the virus, showing that
there is no trade-off between public safety and economic growth. The economic recovery will be choked
off if Pennsylvania opens in unsafe ways and COVID incidence rises sharply again.
Workers of Color and Women Face a Triple Whammy in the COVID Crash
This section examines a cruel triple whammy in the current recession that harms many vulnerable
workers, including low-wage workers, women, and people of color. The industries unable to operate
with workers at home, but forced to shut down to allow social distancing—such as restaurants, bars,
and in-store retail—disproportionately employ women and people of color. Second, essential workers
who are required to continue working despite the health risks because of their importance of their
industries to the general population—such as health care, grocery stores, and distribution workers—also
heavily employ women and people of color. Third, many immigrants, despite risking their lives for the
rest of us, have been denied access to pandemic social benefits.
Unemployment Rates Spike More Among Workers of Color, Women, and Low-Wage Workers
One likely consequence of the concentration of women and people of color in businesses forced to close
by the pandemic is that unemployment rates have likely increased more for these groups than overall.
Table 1 shows that this is the case for people of color. In both Pennsylvania and nationally, Black and
Hispanic people saw a jump in their unemployment rate of 11% to 12% from the first to second quarter
The State of Working Pennsylvania 2020 | 10of this year, compared to about 8% for whites. The Black unemployment rate in Pennsylvania was 22%
in the second quarter of 2020 and the Hispanic one almost 20%.
Table 1. Black and Hispanic People in Pennsylvania and Nationally Experienced a Larger
Increase in Unemployment from 2020 Q1 to 2020 Q2
Pennsylvania Unemployment Percentage Point Increase in Unemployment
Rate from Q1 to Q2
Q1 2020 Q2 2020 Pennsylvania United States
All 5.1% 14.2% 9.1% 9.2%
White 4.0% 12.2% 8.2% 7.8%
Black 10.2% 22.0% 11.8% 11.1%
Hispanic 8.3% 19.7% 11.4% 12.1%
Source: Keystone Research Center based on Economic Policy Institute analysis of LAUS data and CPS data.
Women also have borne more than their share of the economic fallout from the COVID recession,
especially initially. 5 Women’s unemployment rate was 3% lower than men’s in the nation in the three
months before COVID (December 2019 to February 2020). In April, it was 20% higher, 36.6% versus
27.6%. Since then the gap has closed, with women’s unemployment rate in July 10.6% versus men’s
9.8%. Older women in July still had much higher unemployment rates than men (9% vs. 6.7% for those
aged 45-54 and 9.6% versus 8% for those aged 55 and over).
Women, Workers of Color, and Low-Wage Workers Make Up More of the PA Frontline
Workforce
Figure 7 shows a breakdown of some of the frontline industries on which all Pennsylvanians depend in
the pandemic. Over half of Pennsylvanians in the shown industries work in health care and another fifth
in groceries, convenience stores, and drug stores. This data source does not classify food processing as
frontline, such as meatpacking plants which have experienced some of the highest documented COVID
rates in Pennsylvania and nationally. If it did, the share of Hispanic workers risking their health and lives
to keep the rest of us fed would grow.
5
This paragraph is based on Keystone Research Center analysis of Bureau of Labor Statistics data online at
https://www.bls.gov/web/empsit/cpseea10.htm.
The State of Working Pennsylvania 2020 | 11Figure 7.
Figure 8 shows that in Pennsylvania the workers in frontline industries are nearly two-thirds female.
Black people make up one-seventh of essential workers compared to less than one-tenth of all
Pennsylvania workers. Foreign-born and Hispanic workers represent slightly more of the essential than
overall workforce, a share that would probably grow if immigrants were not undercounted and if food
processing and agriculture were included as frontline sectors.
The State of Working Pennsylvania 2020 | 12Figure 8.
Low-wage workers are also over-represented in the frontline workforce (Figure 9), especially in building
cleaning; child care and social services; and the grocery, convenience, and drug store industries.
Figure 9.
The State of Working Pennsylvania 2020 | 13Exclusion of Immigrants and Their Dependents From Relief
The third part of the triple whammy faced by some vulnerable workers is the exclusion of immigrants
and their families from federal COVID relief—even though many of these immigrants jeopardize their
health by continuing to work in industries that sustain the lives of other Pennsylvanians. The Migration
Policy Institute estimates that 183,000 people (undocumented immigrants and their families) in
Pennsylvania are ineligible for any federal stimulus. 6 This number includes many dependents of
undocumented immigrants who hold green cards and/or are U.S. citizens. Among our surrounding
states, Maryland, New Jersey, and New York all have a larger ineligible population because they have a
larger immigrant population overall.
Figure 10.
6
Migration Policy Institute (MPI) data only covers undocumented populations in each state and their dependents
and thus underestimate the total number of immigrants denied support from the CARES Act. MPI data, for example,
exclude legal immigrants with a variety of different visa statuses, including workers with specialized skills and
students who work part-time or full-time but who can no longer work (and earn income to support themselves)
because of the coronavirus. For more discussion of these issues, see Cyierra Roldan, “1.2 Million New Yorkers
Excluded from the CARES Act,” http://fiscalpolicy.org/1-2-million-new-yorkers-excluded-from-the-cares-act. For
analysis of how the HEROES Act passed by the U.S. House would address the CARES Act limitations with respect
to immigrant workers, see Meg Wiehe and Lisa Christensen Gee, “Analysis: How the HEROES Act Would Reach
ITIN Files, May 14, 2020; https://itep.org/analysis-how-the-heroes-act-would-reach-itin-filers/.
The State of Working Pennsylvania 2020 | 14Wages of Low-Wage Workers and Black People in Pennsylvania Fall Farther
Behind
While this report focuses most on labor market trends since the beginning of 2020, this section analyses
wage trends in earlier periods of time to highlight two critical current issues in Pennsylvania: racial
inequality and the state minimum wage.
Lawmakers’ Inaction Leaves Pennsylvania Low-Wage Workers Trailing Those in Neighboring
States
Below, Figure 11 tells a stark and important story about low-wage Pennsylvania workers being deprived
of the benefits of economic growth even at the end of the long expansion, while neighboring-state
workers in the bottom 30% of the wage distribution enjoyed inflation-adjusted wage increases of 3.5%
to 5% from 2018 to 2019.
Figure 11.
Over a six-year period, 2013-19, Pennsylvania low-wage workers received a wage increase, but the gap
between Pennsylvania workers’ wage growth at the 20th percentile and that of neighboring states was
even larger—8 percentage points (Figure 12).
The State of Working Pennsylvania 2020 | 15Figure 12.
Table 2 presents a simple explanation for these differences in wage trends at the low end of the job
market. Starting in 2014, but especially in 2019, our neighboring states increased their minimum wage
above the federal level. In fact, in 2019 alone, our six neighbors increased their state minimum wage by
more than $1 per hour on average, including $2.50 per hour in New Jersey, $1.40 in New York, and 90
cents and $1 per hour in Maryland and Delaware. Workers and their families enjoyed the benefits of
these increases, some getting on a firmer financial footing before the COVID crash. Pennsylvania low-
wage workers and their families did not enjoy the benefits of a rising minimum wage.
Table 2. The Minimum Wage in Pennsylvania and Neighboring States, 2013 to 2019
State 2013 2014 2015 2016 2017 2018 2019
Pennsylvania 7.25 7.25 7.25 7.25 7.25 7.25 7.25
Delaware 7.25 7.75 8.25 8.25 8.25 8.25 9.25
Maryland 7.25 7.25 8.25 8.75 8.75 10.10 11.00
New Jersey 7.25 8.25 8.38 8.38 8.44 8.60 11.00
New York 7.25 8.00 8.75 9.00 9.70 10.40 11.80
Ohio 7.85 7.25-7.95 7.25-8.10 7.25-8.10 8.15 8.30 8.70
West Virginia 7.25 7.25 8.00 8.75 8.75 8.75 8.75
Source: https://www.dol.gov/agencies/whd/state/minimum-wage/history
The State of Working Pennsylvania 2020 | 16The Pennsylvania Black-White Wage Ratio Falls Below Three-Quarters
To shed light on the issue of racial inequity, which has been much in the news recently, Figure 13 shows
a three-year moving average of the ratio of Black to white workers’ median wages in Pennsylvania. (The
year 2018 on the chart is the average of the Black/white median ratio in 2017, 2018, and 2019). In
Pennsylvania, the Black median wage was 95% of the white in 1986-88 but has fallen to below 75% in
the three decades since. In a period when white workers saw limited gains in wages, the relative decline
of Black median wages is stunning.
Figure 13.
Pennsylvania Workers Shared Little in the Gains of Growth Over the Entire 2006-2019
Business Cycle
Figure 14 displays a three-year average of wage levels at three points in the Pennsylvania earnings
distribution from 2006 to 2019, the complete last business cycle. Workers at the 80th percentile—
relatively high-wage workers—experienced no wage decline after the Great Recession and then enjoyed
faster wage growth towards the end of the expansion, for a peak-to-peak increase of 12%. Middle- and
low-wage workers at the 50th and 20th percentiles experienced declining wages in the slow-growth first
half of the expansion (2009-14), with their wages rising above the 2006.
The State of Working Pennsylvania 2020 | 17Figure 14.
National data through 2018 (not available for states) show that, after broadly shared income declines in
the Great Recession, the trend of unequal growth, with the top 1% receiving a large share of the total
expanding pie, continued unabated. 7 Excluding capital gains, the top 1% garnered a steadily rising share
of national income during the period 2006-2018. Including capital gains, the top 1% accounts for half
(49%) of the total national income loss in the period 2007-09. The top 1% then received nearly half
(45%) of the gain in income in 2009-18.
Conclusion: We Need Policies to Lift Us Out of Recession and Create an Economy
That Works for All
The data reviewed in this report drive home that the COVID crash has made more visible what “The
State of Working Pennsylvania” has documented since 1996. Working people in the United States and in
Pennsylvania have taken it on the chin for 40 years. With incomes stagnant, many families live paycheck
to paycheck, especially Black, Latinx, and female-headed households. These families desperately need a
quick and just recovery, one that addresses the immediate deprivation from COVID and long-term
inequality.
Given how our economy works, we won’t get a strong recovery without a just recovery. John Maynard
Keynes first convinced policymakers in the 1930s to recognize the impact of fiscal policy (government
spending), public investment, and workers’ consumption to driving the economy forward. Today, even
the favorite punching bag of progressives, Clinton and Obama administration economist Larry Summers,
argues that our economy suffers from “secular stagnation” because of insufficient demand and excess
7
The rest of this paragraph draws from Emmanuel Saez, “Striking it Richer: The Evolution of Top Incomes in the
United States” (updated with 2018 estimates), UC Berkeley, February 2020. See especially Table 1 and Figure 1;
https://eml.berkeley.edu/~saez/saez-UStopincomes-2018.pdf.
The State of Working Pennsylvania 2020 | 18savings, driven in part by economic inequality: the fact that workers—people likely to spend most of
what they earn—aren’t seeing the gains in incomes needed to steadily increase buying power.[1]
In the short run, to avoid a downward spiral of the economy into depression, we need another injection
of federal relief that puts money in the pockets of people who will spend it, including:
· Extension of the $600-per-week boost in federal unemployment benefits. As a result of our
early, rapid rise in unemployment, the $600 boost to weekly unemployment benefits in the
federal CARES Act provided over $10 billion to Pennsylvanians (more than $800 million per
week) by the end of June—6.6% of total national benefits. For those who remember that
Governor Corbett’s $1 billion cut in education spending over a year plunged Pennsylvania to 50th
for job growth, it takes little imagination to recognize the economic disaster that could result
from slashing nearly that much spending power every week.
· More relief for state and local government. Without this, deep cuts in government jobs and a
collapse in the buying power of public employees will drag the economy into deeper recession.
· A federal stimulus that invests in infrastructure and reducing carbon emissions, work performed
outside and with less risk of triggering further upticks in COVID-19 cases. For a more detailed
discussion of how federal climate response could increase economic opportunity and lower
carbon emissions in Pennsylvania and neighboring states, creating a “New Deal That Works for
Us,” go to reimagineappalachia.org.[2]
Pennsylvania should:
· Identify shovel-ready infrastructure and green growth projects that could absorb federal
stimulus investments likely later this year and/or next year. Like a good Boy Scout, Pennsylvania
should anticipate these federal investments and “be prepared.”
o Governor Wolf and legislative leaders should establish a commission on infrastructure
and green growth stimulus (CIGGS) to identify priority projects for investment, based on
criteria such as there being “shovel ready,” maximizing near-term job creation,
increasing the state’s long-run productivity and competitiveness, and reducing carbon
emission/promoting climate justice.
o Update data on broadband quality in Pennsylvania so that the state knows the priority
places to access federal funds for universal high-quality broadband—sustain rural and
neighborhood businesses and communities, and to support online and blended (online
and in person) learning during and after the pandemic.[3]
· Capitalize on federal support for work sharing in the CARES Act, support that includes grant
funds through 2022 and a 100% subsidy for unemployment benefits through the end of the year
that could be extended.
· Capitalize on federal subsidies to expand work sharing. Through December, the CARES Act
provides 100% subsidy for states to expand work sharing programs under which states provide
partial unemployment benefits for workers whose hours are cut (e.g., 40% unemployment
benefits for workers cut back to 60% time). The CARES Act makes available grant funding to
expanding work sharing over the next several years. Work sharing reduces workers’ income
losses compared to layoff, helps businesses bounce back when the economy kicks into gear—
they can just increase workers’ hours back to full time, and can lower unemployment in future
recessions.
· Put the Pennsylvania minimum wage on a path to $15 per hour as three of our neighboring
states have already done. Pennsylvania lawmakers have not. Changes in the Pennsylvania House
may make progress on the Pennsylvania minimum wage possible. In late 2019 and 2020, the
The State of Working Pennsylvania 2020 | 19Pennsylvania Senate passed a modest minimum wage increase that Governor Wolf would have
signed, even though it was far below his original proposal to phase in an increase to $15 per
hour and had other compromises. The House leadership at that time failed to bring that bill up
for a vote. A much stronger proposal should be advanced later this year or early next year.
· Take additional state actions necessary to prevent an eviction tsunami to complement the just-
announced Centers for Disease Control extension of the federal eviction moratorium on public
health grounds.[4] For example, the state should:
o Make the rental assistance program easier to access, raise the cap on monthly rent, and
add $100 million to the program;
o Require landlords to make payment agreements with tenants that allow them to pay
their back rent over the course of a year.
o Provide funding for tenant counseling and legal services.
Long-term, the minimal wage gains from 2006 to 2019 remind us that the policies in place today—rigged
heavily against working people—result in rising inequality, including based on race. Achieving shared
prosperity that can end low growth due to slowly growing incomes requires structural changes that
rebalance the scales between workers and corporations. State and federal lawmakers’ top priority
should be enacting comprehensive policies that raise wages and strengthen workers’ rights so that we
can achieve the economy we want—an economy that works for all—not the economy we’ve had.[5]
__________________________________
[1]
For some of Summers’s writing on secular stagnation for policy audiences, see
http://larrysummers.com/category/secular-stagnation/. See also, “Equitable Growth in Conversation: an Interview
with Lawrence H. Summers,” Center for Equitable Growth, February 11, 2016;
https://equitablegrowth.org/equitable-growth-in-conversation-an-interview-with-lawrence-summers/.
[2]
The Reimagine Appalachia policy blueprint is at https://reimagineappalachia.org/wp-
content/uploads/2020/07/ReImagineAppalachia_Blueprint.pdf. The powerful Reimagine Appalachia video—which
is a great way to spend three minutes—is at
https://www.facebook.com/ReImagineAppalachia/videos/331010637929441. Watch the video, endorse the
Reimagine Appalachia campaign, and let the campaign know how you want to help.
[3]
The Legislature’s Center for Rural Pennsylvania published one of the most comprehensive studies ever of real
broadband access in a state in 2019. That study, however, was based on data collected in 2018 and should be
updated. See Sascha D. Meinrath, “Broadband Availability and Access in Rural Pennsylvania,” Center for Rural
Pennsylvania, June 2019;
https://www.rural.palegislature.us/broadband/Broadband_Availability_and_Access_in_Rural_Pennsylvania_2019_R
eport.pdf.
[4]
This bullet is based on Marc Stier, “Here’s how we stop the coming eviction and foreclosure tsunami,”
Pennsylvania Capital Star, August 28,
https://www.penncapital-star.com/commentary/heres-how-we-stop-the-coming-eviction-and-foreclosure-tsunami-
opinion/.
[5]
For more detail on how to strengthen labor unions and raise wages, see the following four We The People
Pennsylvania briefs: “Strengthen Labor Unions,” https://drive.google.com/file/d/1CkJ5vdkTwXFza99d2T-
5TmIqoPR98LLp/view; “Raise the Minimum Wage,” https://drive.google.com/file/d/1JHYfi-
budfdp8FirvH72ub4vvnSHiEEO/view; “Prevailing Wage Laws,” https://drive.google.com/file/d/11bI-
tCVhSQZAyCWabcfAansY6QnJfm0J/view; and “One Fair Wage: Eliminate the Tipped Minimum Wage,”
https://drive.google.com/file/d/1XIffcfNAs3EGJ1oUrtEuJFoOLPw0z-k2/view; and “Wage Theft,”
https://drive.google.com/file/d/1uxV3VG-X-a85PRR2QuIjlv8xIdw2ebWg/view. Policymakers interested in
additional detail in any of these areas should contact the Keystone Research Center.
The State of Working Pennsylvania 2020 | 20You can also read