Workforce Management and Succession Plan - 2017-2021 Office of Statewide Health Planning and Development
←
→
Page content transcription
If your browser does not render page correctly, please read the page content below

Office of Statewide Health Planning and Development

Workforce Management and
           Succession Plan
                                    2017-2021
Table of Contents

Director’s Message.............................................................................................................................. 3

Introduction....................................................................................................................................... 4-5

Overview............................................................................................................................................... 6

   Challenges ......................................................................................................................................... 6

   Methodology ...................................................................................................................................... 6

Workforce Overview ....................................................................................................................... 7-13

   Workforce Profile ............................................................................................................................... 7

   Demographic Overview................................................................................................................. 7-13

Workforce Gap Analysis .............................................................................................................. 14-17

   Bench Strength Challenges ............................................................................................................. 14

   Recruitment and Retention Data Challenges.............................................................................. 14-15

   Recruitment Gaps and Risks ...................................................................................................... 15-16

   Retention Gaps and Risks ............................................................................................................... 16

   Knowledge Transfer Gaps and Risks.......................................................................................... 16-17

   Succession Planning Gaps and Risks ............................................................................................. 17

Action Plan ......................................................................................................................................... 18

References and Data Sources .......................................................................................................... 19

OSHPD Workforce Management and Succession Plan – 2017-2021                 2

Director’s Message

                                          I am pleased to introduce the 2017-2021 Workforce Management
                                          and Succession Plan for the Office of Statewide Health Planning and
                                          Development (OSHPD). This is the first such plan for OSHPD, which
                                          was developed to closely align with our Strategic Plan. A workforce
                                          plan helps ensure an organization’s human workforce has the skills
                                          and capacity necessary to support the organization’s business needs
                                          and goals.

                                          During the Strategic Plan refresh process, staff at all levels reassessed
                                          OSHPD’s vision, mission, goals, and values. Goal objectives
                                          and performance metrics were updated to strengthen OSHPD’s
                                          ability to anticipate and respond to change. The goals identified in
                                          OSHPD’s Strategic Plan require a talented, professional, and skilled
                                          workforce to achieve them. OSHPD has already started strategic
                                          workforce development by realigning our organizational structure and
                                          streamlining business processes to maximize effectiveness. OSHPD
                                          must continue to work diligently to recruit and retain a highly skilled,
                                          diverse team of professionals dedicated to the mission of advancing
access to health care throughout California.

In this Workforce Plan, we outline the current composition of the OSHPD workforce, identify knowledge, skill
gaps, and risks within the workforce, and discuss strategies for mitigating these concerns.

Thank you for your interest in OSHPD’s Workforce Plan, which will guide our workforce development activities
over the next five years.

Very truly yours,

Robert P. David
Director

                                                        3
Introduction

Forward                                                           Strategic Direction
The purpose of workforce and succession planning                  OSHPD’s strategic direction will continue to support
is to align the needs and goals of an organization                the Department’s vision, mission, and goals. OSHPD’s
with the appropriate number of staff with the requisite           goals and performance metrics were recently updated,
knowledge, skills, and abilities. The ever-changing               with input from its community of stakeholders, to
economic and technological environments demand                    strengthen OSHPD’s ability to anticipate change and
that workforce and succession planning be active and              to provide greater flexibility to respond to change
ongoing processes that will enable the organization to            while increasing fiscal efficiency, customer service,
proactively plan its workforce in anticipation of future          and transparency across the organization. OSHPD’s
changes. Public sector agencies must also realign                 strategic direction will be regularly adjusted to adapt to
their priorities to changes in legislation, budget funding,       political, economic, and technological changes.
and authorized positions, as well as to the knowledge,
skills, and abilities required of its workforce.                  Vision:
                                                                  Access to safe, quality healthcare environments that
To be competitive in the workforce marketplace, private           meet California’s dynamic and diverse needs.
and public sector companies must actively manage
their recruitment methodologies. Dynamic workforce                Mission:
planning is even more critical in the public sector,              To advance access to safe, quality healthcare
where salaries are often below those in the private               environments through innovative and responsive
sector. Public sector recruitment methodologies must              services and information.
incorporate evolving and innovative strategies to be
competitive and to ensure maximization of workforce               Goals:
talent in support of the agency’s goals.                          • Provide Valuable Public Service

The Office of Statewide Health Planning and
                                                                  •   Advance Operational Excellence

Development’s (OSHPD) vision is to provide access                 •   Foster a Dynamic OSHPD Community
to safe, quality healthcare environments that                     •   Optimize Fiscal Stewardship
meet California’s dynamic and diverse needs. To
accomplish this vision,
OSHPD relies on its
skilled, knowledgeable,
and dedicated workforce.

The success of this
high            functioning
workforce depends on
the    recruitment      and
retention of highly trained
specialized staff, the
transfer of specialized
knowledge, and effective
training and promotional
opportunities.

                                                              4
Introduction, cont.

OSHPD’s Strategic Plan 2016-2018 can be found at               OSHPD’s diverse programmatic divisions are listed
 http://www.oshpd.ca.gov/documents/OSHPD-                      below:
 Strategic-Plan-2016.pdf
                                                               •   The Facilities Development Division regulates the
                                                                   design and construction of healthcare facilities
History                                                            to ensure they are safe and capable of providing
                                                                   services to the public.
OSHPD was created in 1978 to provide Californians
with an enhanced understanding of the structure and            •   Cal-Mortgage Loan Insurance Division administers
function of its healthcare delivery systems. Over the              the California Health Facility Construction
years, the role has evolved to include programs and                Loan Insurance Program and provides credit
services designed to promote healthcare accessibility              enhancement for eligible nonprofit healthcare
throughout California. OSHPD is the statewide leader               facilities when they borrow money for capital
in collecting data and disseminating information about             needs.
California’s healthcare infrastructure, promoting
an equitably distributed healthcare workforce, and             •   The Healthcare Workforce Development Division
                                                                   collects, analyzes, and publishes data about
publishing valuable information about healthcare                   California’s healthcare workforce and health
outcomes.                                                          professional training, identifies areas of the state in
                                                                   which there are shortages of health professionals
OSHPD also monitors the construction, renovation,                  and service capacity, and coordinates with other
and seismic safety of hospitals and skilled nursing                state departments in addressing the unique
facilities, and provides loan insurance to facilitate              medical care issues facing California’s rural areas.
the capital needs of California’s nonprofit healthcare
facilities.                                                    •   The Health Professions Education Foundation, a
                                                                   nonprofit 501(c)(3) corporation, improves access
OSHPD has five programmatic areas (four divisions                  to healthcare in underserved areas of California
and one foundation) that are advised by five boards                by providing scholarships, loan repayments, and
and commissions. With 481.6 authorized positions                   programs to health professional students and
in Fiscal Year (FY) 2017-18 operating in Sacramento                graduates who are dedicated to providing direct
and Los Angeles, OSHPD serves a variety of                         patient care in those areas.
constituencies, including hospitals, insurers, health
plans, patients, the building and construction industry,       •   The Information Services Division integrates
                                                                   and centralizes enterprise data operations with
academia, healthcare professionals, and healthcare
students and graduates.                                            healthcare analytics, using common technology
                                                                   infrastructure to improve data accessibility and
                                                                   usage to better serve all OSHPD clients and
                                                                   stakeholders.

                                                           5
Overview
The importance of workforce and succession                     Challenges
planning cannot be overemphasized. The ability of a
department to achieve its mission and goals depends            The global phenomenon of an aging population and
on its workforce. OSHPD’s 2017-2021 Workforce                  the associated retirement risks are at the forefront of
Management and Succession Plan (Plan) identifies               government and business workforce planning. With
challenges and workforce gaps that could threaten              a large percentage of employees preparing to leave
the Department’s ability to develop and retain the             the workforce, employers are working to retain as
knowledge and expertise needed to provide quality              much corporate knowledge as possible before the
services to the state or its external stakeholders, or         mass exodus occurs. Successful implementation
to accomplish the Department’s mission to advance              of a transition plan to a younger workforce that has
access to safe, quality healthcare environments                the expertise and training necessary to continue the
through innovative and responsive services and                 Department’s mission and vision requires that OSHPD
information.                                                   overcome challenges presented by workforce gaps
                                                               in the areas of recruitment, retention, critical skills
The Plan presents an analysis of the Department’s              and expertise, knowledge transfer, and succession
historical and current employment and retirement data,         planning. Most of these challenges are endemic in
and workforce practices that impact staffing. This is          California state government, while a few are unique
followed by discussions of the challenges and risks that       to OSHPD.
result from workforce gaps. Finally, the Plan presents
a series of action strategies directed at minimizing           Methodology
the risks and workforce gaps. The strategies will be
implemented over a period of six months to five years.         In developing its Plan, OSHPD applied the basic
The Plan will be regularly reviewed and updated.               process model of the workforce management model
                                                               recommended by the California Department of Human
                                                               Resources (CalHR) through its Statewide Workforce
                                                               Planning and Recruitment Unit1. The model includes
                                                               data gathering, analytics, and action steps as
                                                               represented in the sub-sections of the Plan:
                                                               1. Strategic Direction (part of Introduction)
                                                               2. Workforce Overview
                                                               3. Workforce Gap Analysis
                                                               4. Action Plan

                                                           6
Workforce Overview

Workforce Profile                                              Demographic Overview
OSHPD is one of the smaller California state                   Ethnicity and Gender
departments, with 481.6 authorized positions in
FY 2017-18. Much of its workforce has come from                CalHR issued its 2016 Annual Workforce Analysis
within state service. There is, however, a significant         of OSHPD’s workforce composition, which included
number of positions requiring specialized college              a review of OSHPD’s 2016 workforce analysis and
degrees, such as engineering, which present                    employment goals. The Department was found
recruitment challenges when competing with private             to have four classification groups with significant
sector firms that pay higher salaries than the State of        underutilization by race/ethnicity or gender.
California.                                                    Underutilization means that there was a statistically
                                                               significant lower percentage of persons of a specific
The Department’s small size also limits the scope              race/ethnicity or gender in an occupation or at a
of some career paths, which then limits promotional            particular level in that state agency than would be
opportunities for employees in those classifications,          reasonably expected by that group’s percentage in the
and can negatively impact employee retention.                  relevant labor force. (“Relevant labor force” is defined
                                                               by CalHR as the pool of individuals who possess the
One of the most significant current and                        requisite qualifications for the job within the geographic
near-term workforce risks is related to the “silver            areas in which the agency can reasonably be expected
tsunami” of retiring baby boomer employees. Per                to recruit.) The significant underutilizations by race/
California Public Employees’ Retirement System                 ethnicity or gender are listed below:
(CalPERS) pension information2, the average age of
FY 2014-15 state miscellaneous service retirees at             •   In the classification groups of Staff Services and
                                                                   Civil Engineers, OSHPD was deficient in ethnically
retirement was 60 years old with an average 23.2 years
of state service credit. Over 50 percent of OSHPD                  white individuals.
employees are age 50 and older, and over 17 percent
are age 60 and older. This longevity is a source of core       •   In the classification groups of Staff Services,
                                                                   Information Systems/System Software, and
strength for many areas of the Department because
                                                                   Construction Inspectors, OSHPD was deficient in
it represents years of accumulated knowledge and
                                                                   the male gender category.
passionate, dedicated employees.

Analysis of OSHPD data (employee age, state service,
                                                               •   In the classification groups of Civil Engineers and
                                                                   Construction Inspectors, OSHPD was deficient in
and recent retirement history), however, shows that                ethnically Hispanic individuals.
retirement risk is an issue, particularly in executive
and supervisory/managerial classifications.                    Disabled Employee Representation
Addressing this retirement risk will require the               As of December 2015, disability representation
Department’s immediate focus on related knowledge              for OSHPD was 31.7 percent an increase of
transfer and succession planning gaps.                         8.2 percent from the prior year’s representation of
                                                               23.5 percent. Although the Department exceeds the
Recruitment, employee retention, knowledge transfer,           state’s goal setting threshold of 13.3 percent, OSHPD
and succession planning gaps and risks are discussed           continues its efforts to focus on disability awareness.
in detail and are addressed in the Action Plan.                OSHPD also sponsors an active Disability Advisory
                                                               Committee that regularly offers lunchtime videos
                                                               for the entire Department to promote disability and
                                                               diversity awareness, celebrates national disability

                                                           7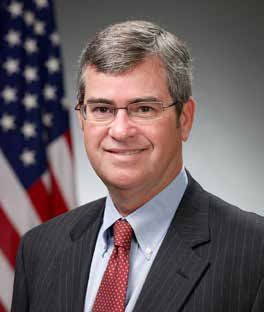
Workforce Overview, cont.
awareness efforts, and sponsors fund raisers to contribute 40 percent of the household income4. The
support local nonprofit organizations that provide wage gap is not just a women’s issue — it’s a family
services to disabled persons. OSHPD will continue to issue.
advance and regularly examine its actions in this area.
Theservices
support local non-profit organizations that provides genderto disabled
pay gappersons.
issue OSHPD
is particularly
will relevant
Gender Pay Gapcontinue to advance and regularly examine its actions in this area.
for OSHPD’s employees. Table 1 below shows the
number of OSHPD employees by gender in each
Gender Pay Gap
A different but related issue is that of the gender pay of the Bargaining Units (BUs) except BUs 48, 97,
gap. In November 2016, CalHR released its 2014
A different but related issue is that of the gender and
pay 99.
gap. Also listed is8,the
On November associated
2016, CalHR average total
Report on Women’s Earnings in State Civil Service
released its 2014 Report on Women’s Earnings compensation
in State Civil (sum
Service of average
Classifications. wages,
The benefits, and
conclusion was that the overall
Classifications. The conclusion was that the overall gender-pay-gap issue in the California civil service system
overtime) of each BU taken from CalHR’s California is not
the result of women receiving less pay than men for the
State same job, Total
Employee but reflects the fact that Reports.
Compensation more (Males
gender-pay-gap men issueareinemployed
the California civil service
in higher paying job classifications while more women are employed in lower
system is not thepaying
resultclassifications.
of women receiving The reportlessshows pay and females in the same BU were
that, while there has been some progress in reducing assumed to receive
than men for the same job, but
the gender payreflects the fact that
gap in California civil more
service, thethe same average
composition of womenCalHR compensation.
in male-dominated and CalHR’s
men are employed higher-paying occupations
in higher paying still lags behind the rest
job classifications statewide average
of the United Statescompensation was used rather
and California’s overall
while more women workforce
are demographic.
employed inThis lowerissuepaying
is relevant than
because thehalf of allcompensation
actual jobs in the U.S. are
for now
OSHPDheld employees
by women3, and working mothers generally contribute 40 percent of the household income4.
classifications. TheThereport
wage gapshowsis notthat,
just while
a women's has— it'stoa remove
thereissue any other variables that may contribute to
family issue.
been some progress in reducing the gender pay gap differences in total average compensation between
in California civil The
service,
genderthe paycomposition of women
gap issue is particularly relevantmales and females.)
for OSHPD’s employees. Table I below shows
the number of OSHPD
in male-dominated and higher-paying occupations employees by gender in each of the Bargaining Units (BUs) except BUs
48, 97 and 99. Also listed is the associated average As can be seen from (sum
total compensation Tableof1,
average
the number of women
still lags behind the rest of the United States and
wages, benefits, and overtime) of each BU taken from CalHR’s California State Employee Total
California’s overallCompensation Reports. (Males and females in the same BU were assumed to receive the than
workforce demographic. This in the highest-paying BUs was fewer samethe number
issue is relevant because half ofcompensation.
average CalHR all jobs in theCalHR’s
U.S. are of men. Only 20 percent of
statewide average compensation was used rather than BU 2 Attorneys and
now held by women , andcompensation
the actual
3
working mothers for OSHPD employeesHearing
generally to remove Officers
any otherwere women
variables and only 17 percent
that may
contribute to differences in total average compensation between males and females.)
Table1 Average Statewide Compensation by Bargaining Unit Applied to
OSHPD’s Permanent Workforce
(As of August 2016, Excludes Retired Annuitant, Limited Term, and TAU or Temp. Exempt)
Average Total
1
Annual
BU Title Compensation Females Males
1 Professional, Administrative, $102,389 2 121 96
Financial, and Staff Services
2 Attorneys and Hearing Officers $170,625 2 1 4
4 Office and Allied $68,621 2 30 12
9 Professional Engineers $161,971 3 23 111
10 Professional Scientific $112,151 3 5 4
Total employees 4 180 227
Calculated average annual compensation $105,025 $131,113
1 Sum of average wages, benefits, and overtime as reported in CalHR’s California State
Employee Total Compensation Reports listed below
2 CalHR, 2014 California State Employee Total Compensation Report for
Bargaining Units 1, 2, 3, 4, 7, 11, 13, 14, 15, 16, 17, 18, 19, 20, and 21, January 12, 2016
3 CalHR, 2013 California State Employee Total Compensation Report for
Bargaining Units 6, 9, 10, and 12, Revised May 2015
4 The compensation for 25 employees in BUs 48, 97, and 99 (defined as "excluded" by
Government Code 3527 [b]) is not included since it is not defined in the CalHR reports.
8
OSHPD WORKFORCE MANAGEMENT AND SUCCESSION PLAN – 2017-2021 Page 9
Workforce Overview, cont.

           As can be seen
of BU 9 Professional          from Table
                           Engineers   wereI, the number This
                                                women.     of women   in the
                                                                    Age       highest-paying BUs was less than the
                                                                          Demographics
           number    of men.   Only  20  percent
fact considerably reduces the average compensationof BU  02  Attorneys  and  Hearing  Officers were women and
           only  17 percent   of BU  09  Professional
of OSHPD females compared to OSHPD males. It is        Engineers   were   women.    This
                                                                    The average age of   factanconsiderably    reduces employee
                                                                                                 OSHPD permanent
           the  average   compensation     of OSHPD
well known that the engineering field continues to be  females   compared    to OSHPD    males.    It is well known
                                                                    as of August 2016 was 48 years old. As shown in
           that the engineering field continues to be male dominated, for various reasons. While OSHPD
male dominated, for various reasons. While OSHPD                    Figure 1 below, 52 percent of employees were age 50
           cannot address all the factors that contribute to this phenomenon, it can make sure that its own
cannot address     all the  factors  that  contribute   to  this
           hiring and employment practices apply equitably toand     menolder.    This picture of an aging workforce is part
                                                                           and women.
phenomenon, it can make sure that its own hiring and                of a worldwide phenomenon. Over growing concern
employment     practices
           OSHPD’s          apply
                        plans       equitably
                              to address         to men
                                           diversity issuesand
                                                             may beabout
                                                                     foundthe    potential
                                                                             in the        loss of
                                                                                    Action Plan       critical
                                                                                                  section      knowledge
                                                                                                            of this Plan. through
women.                                                              pending retirements, many companies are seeking
           Age Demographics                                         ways to retain experienced workers to act as mentors
OSHPD’s plans to address diversity issues may be                    and teachers.
found in the Action
           The         Planage
                 average     section
                                of an of this Plan.
                                      OSHPD      permanent employee as of August 2016 was 48 years old. As
            shown in Figure 1 below, 52 percent of employees were age 50 and older. This picture of an
            aging workforce is part of a worldwide phenomenon. Over growing concern about the potential
            loss of critical knowledge through pending retirements, many companies are seeking ways to
            retain experienced workers to act as mentors and teachers.

            Figure 1 Age Profile of Permanent OSHPD Workforce

                                       Age Profile of Permanent OSHPD Workforce
                                          (As of August 2016, Excludes Retired Annuitant,
                                             Limited Term, and TAU or Temp. Exempt)

                                                                7%

                                                                           18%
Workforce Overview, cont.
OSHPD’s aging profile also needs to be viewed for retirement. While these individuals currently make
in relation to the number of years of state service. up only five percent of all OSHPD employees, it is
The combination of age and years of state service, important to note the potential retiree pipeline over the
as shown in Table 2 informs management on the next several years.
near-term risks of retirement.
Over 37 percent of OSHPD employees are age 50+
Table 2 shows that, as of August 2016, there were with 10+ years of state service. These employees
22 OSHPD employees who were age 60+ with 20+ will be age 60+ with 20+ years of state service within
years of state service. Per CalPERS data on the the next 10 years. If these employees remain with
average age and years of state service at retirement the Department until retirement, almost 40 percent
of FY 2014-15 retirees (60 years old and 23.2 years of OSHPD’s workforce could turn over in the next
of state service credit), these 22 employees are “ripe” 10 years.
OSHPD’s aging profile also needs to be viewed in relation to the number of years of state
service. The combination of age and years of state service, as shown in Table 2 informs
management on the near-term risks of retirement.
Table 2 State Service Credit Profile of Permanent OSHPD Workforce Age 50+
(As of August 2016. Excludes Retired Annuitant, Limited Term, and TAU or Temp. Exempt)
Percent Percent
Number of Age of Total
Age Group and Service Credit Ees Group Ees
Age 50 and over: 226 52%
10 or more years state service 159 70% 37%
20 or more years state service 76 34% 18%
Age 60 and over: 74 17%
10 or more years state service 51 69% 12%
20 or more years state service 22 30% 5%
Table 2 shows that, as of August 2016, there were 22 OSHPD employees who were age
60+ with 20+ years of state service. Per CalPERS data on the average age and years of state
service at retirement of FY 2014-15 retirees (60 years old and 23.2 years of state service
credit), these 22 employees are “ripe” for retirement. While these individuals currently make up
only five percent of all OSHPD employees, it is important to note the potential retiree pipeline
over the next several years.
Over 37 percent of OSHPD employees are age 50+ with 10+ years of state service. These
employees will be age 60+ with 20+ years of state service within the next 10 years. If these
employees remain with the Department until retirement, almost 40 percent of OSHPD’s
workforce could turn over in the next 10 years.
OSHPD’s own recent retirement history, shown in Figure 2, indicates that retirements have
been increasing since 2012. (OSHPD’s averages in terms of age at retirement and years of
state service are only slightly different from CalPERS averages for FY 2014-15 state
miscellaneous retirees.)
10Workforce Overview, cont.
OSHPD’s own recent retirement history, shown in Figure 2, indicates that retirements have been increasing since
2012. (OSHPD’s averages in terms of age at retirement and years of state service are only slightly different from
CalPERS averages for FY 2014-15 state miscellaneous retirees.)
Figure
Figure 2 OSHPD
2 OSHPD Six Six Years
Years Retirement
Retirement DataData
Number
Number of OSHPD
of OSHPD Service
Service Retirements,
Retirements,
Average
Average AgeAge
andand Years
Years of State
of State Service
Service
70
70
60 64.3
60 64.3 61.8 61.7
61.8 60.9 61.5 61.3
60.9 61.5 61.7 61.3
50
50
40
40
30 23.9 23.8 25.0
30 21.9 22.9 23.9 21.9 23.8 25.0
21.9 22.9 21.9
20
20 22
22 19 21
19 21
10 16
10 16 13
9 13
0 9
0
2010 2011 2012 2013 2014 2015
2010 2011 2012 2013 2014 2015
# service retirements Avg yrs state service
# service retirements Avg yrs state service
Avg age (yrs) at retirement
Avg age (yrs) at retirement
Data provided by CalPERS
Data provided by CalPERS
It is also important to know if the aging phenomenon affects any rank level more than others.
It is Figure
also important
3 showsto know if the
OSHPD’s aging phenomenon
employee age profile inaffects
terms any ranklevel
of rank levelasmore than others.
Executive,
Figure 3 shows OSHPD’soremployee
Supervisor/Manager, Rank andage profile
File. in terms
As can of rank
be seen, level as of
69 percent Executive,
executives and
Supervisor/Manager, or Rank and File. As can be seen, 69 percent of
62 percent of supervisors/managers are age 50+. This data reinforces the needexecutives and
to address
62 percent of supervisors/managers are age 50+. This data reinforces the need to address
existing knowledge transfer gaps and to develop leadership qualities within the rank and file.
existing knowledge transfer gaps and to develop leadership qualities within the rank and file.
Figure 3 Permanent OSHPD Employees, Percentage by Age Group and Rank Level
Figure 3 Permanent OSHPD Employees, Percentage by Age Group and Rank Level
(As of August 2016. Excludes Retired Annuitant, Limited Term, TAU or Temp. Exempt)
(As of August 2016. Excludes Retired Annuitant, Limited Term, TAU or Temp. Exempt)
80%
80%
69%
70% 69%
70% 11 62%
60%
62%
60%22 21
19
10 16
13
9
0
2010 2011 2012 2013 2014 2015
# service retirements Avg yrs state service
Avg age (yrs) at retirement
Workforce Overview, cont.
Data provided by CalPERS
It is
is also
alsoimportant
importanttotoknow
knowif the aging
if the phenomenon
aging phenomenon affects any rank
affects anylevel
rankmore
levelthan
moreothers.
thanFigure
others.3 shows
OSHPD’s employee age profile in terms of rank level as Executive, Supervisor/Manager,
Figure 3 shows OSHPD’s employee age profile in terms of rank level as Executive, or Rank and File. As
can be seen, 69 percent of executives and 62 percent of supervisors/managers
Supervisor/Manager, or Rank and File. As can be seen, 69 percent of executives and are age 50+. This data reinforces
62 percent of supervisors/managers are age 50+. This data reinforces the need to address and file.
the need to address existing knowledge transfer gaps and to develop leadership qualities within the rank
existing knowledge transfer gaps and to develop leadership qualities within the rank and file.
Figure 3 Permanent OSHPD Employees, Percentage by Age Group and Rank Level
(As of August 2016. Excludes Retired Annuitant, Limited Term, TAU or Temp. Exempt)
80%
69%
70%
62%
60%
49%
50%
40%
30% 24%
23% 22%
20%
20%
13%
8% 9%
10%
0% 1%
0%Workforce Overview, cont.
Another
Another important
Another important metric
important is age
metric
metric isprofile
is age age in terms
profile
profile
in in of
terms generations,
termsof of since lifestyle
generations,
generations, since
since perspectives,
lifestyle
lifestyle motivations, and
perspectives,
perspectives,
work ethicAnother
motivations, can and
motivations, important
beand
very
work
work metric
different
ethic
ethiccanis age profile
between
can
bebe these
very
very in terms of
groups.
different
different generations,
Figure
between4 below
between thesesince
uses
these lifestyle
groups.
groups. perspectives,
the definitions
Figure shown
Figure4 belowin Table
4 belowuses 3.
uses
motivations, and work ethic can be very different between these groups. Figure 4 below uses
thethe
definitions
definitionsshown
shown
the definitions in in
shownTable
Table 3. 3.3.
in Table
Table
Table
3 Table
3Age
AgeRanges
Ranges
3 Age of of
Defined
Ranges DefinedGenerations
of DefinedGenerations
Generationsasas
asofofof
2016
2016
2016
Traditionalists Baby
Baby Boomers
Boomers Generation X X Generation Y
GENERATION Traditionalists
Traditionalists Baby
Boomers Generation
Generation X Generation
Generation
Y Y
GENERATION
GENERATION 1900 - 1945
1900
1900
- 1945
- 1945
1946 - 1964
1946
1965 - 1980
1946
- 1964
- 1964
1981 - 1999
1965
1965
- 1980
- 1980 1981
1981
- 1999
- 1999
Years of age in 2016 >70 52-70 36-51 17-35
Years
Years
of of
ageage
in 2016
in 2016 >70
>70 52-70
52-70 36-51
36-51 17-35
17-35
Figure 4 below shows that the percentage of permanent employees in Baby Boomer and
Figure
Figure 4Traditionalist
below
4 belowshows generations
shows thatthat has
thethe declined since
percentage
percentage of of 2013,
permanent while employees
permanent theemployees
percentage in in
in the
Baby
Babyyounger
Boomer
Boomer and and
Figure 4 below shows that
generations has the percentage
increased. (Thisofispermanent
due, in employees
part, to the 47 in Baby Boomer
retirements and Traditionalist
between July 2013 andgenerations
Traditionalist
Traditionalist
has declined
generations
since
generations hashasdeclined
declined since
since2013,
2013, while
whilethethepercentage
percentage in in
thethe
younger
2013, while the percentage in the younger generations has increased. (This is due, in part,
younger
August 2016.)
generations
generations hashasincreased.
increased. (This
(This
is due,
is due,
to the 47 retirements between July 2013 and August 2016.)in in
part,
part,
to to
thethe
47 47
retirements
retirements between
between July
July2013
2013 and
and
August
August 2016.)
2016.) data is important to the Department’s recruitment and retention efforts. Outreach
Generational
and training
Generational data is efforts
importantwill be mostDepartment’s
to the successful when communicated
recruitment in a manner
and retention that Outreach
efforts. will appealand to training
Generational
Generational
the data
data
is
employees’ important
is important
values and to to
the the
Department’s
motivations.Department’s recruitment
recruitment andand
retention
retention
efforts will be most successful when communicated in a manner that will appeal to the employees’ values efforts.
efforts. Outreach
Outreach
and
andandtraining
training
motivations. efforts
effortswillwill
bebe most
mostsuccessful
successful when
when communicated
communicated in in
a manner
a manner that
thatwillwill
appeal
appeal
to to
Figure 4 Permanent OSHPD Employees, By Generation
thethe
employees’
employees’
values
values andandmotivations.
motivations.
(As of July 2013 and August 2016. Excludes Retired Annuitant, Limited Term, TAU or Temp. Exempt)
Figure
Figure 4 4Permanent
Permanent
60% OSHPD
OSHPD Employees,
Employees, ByBy Generation
Generation
(As(As
of July
of July
2013
2013
andand
August
August
2016. 54%
2016.
Excludes
Excludes
Retired
Retired
Annuitant,
Annuitant,
Limited
Limited
Term,
Term,
TAUTAU
or Temp.
or Temp.
Exempt)
Exempt)
50% 47%
60%60%
40% 54%54%
34%
31%
50%50% 47%47%
30%
19%
40%40% 20%
34%34%
31%31% 12%
30%30% 10%
2% 0%
0% 19%19%
20%20% Traditionalists Baby Boomers Generation X Generation Y
1900 - 1945 1946 - 1964 1965 - 1980 198112% 12%
- 1999
10%10% 2013 2016
2%2% 0%0%
0%0%
Workforce Gap Analysis
Traditionalists
Traditionalists Baby Boomers
Baby Boomers Generation X X
Generation Generation Y Y
Generation
1900 - 1945
1900 - 1945 1946 - 1964
1946 - 1964 1965 - 1980
1965 - 1980 1981 - 1999
1981 - 1999
Bench Strength Challenges 2013
2013 2016
2016
OSHPD has determined that several areas of the organization exhibit a lack of bench strength.
A number of members of the leadership team are fairly new to the Department and are still
Workforce
WorkforceGap
GapAnalysis
Analysis
building their program knowledge and mastering their roles on the leadership team. Similarly,
13yet to master their program areas, duties and
several divisions have many new staff who haveWorkforce Gap Analysis
Bench Strength Challenges • Empower innovation at all levels.
OSHPD has determined that several areas of the • Enhance key skills, abilities, and transfer of
knowledge.
organization exhibit a lack of bench strength. A number
of members of the leadership team are fairly new to • Improve meaningful communication among and
the Department and are still building their program within divisions.
knowledge and mastering their roles on the leadership
team. Similarly, several divisions have many new staff • Model OSHPD values.
who have yet to master their program areas, duties,
The DynoCom committee is led by a committed group
and core skills. An additional risk is presented by a
of individuals who have developed surveys on the need
few program experts who are the only ones with the
for communication, with leadership and information
knowledge and experience to effectively perform the
forums on training/advancement/succession issues.
specific duties of their jobs.
The group will be providing lunchtime speakers on
these issues and will resurvey the community on a
In response to these challenges, OSHPD is developing
regular basis to refresh feedback.
initiatives and strategies to build leadership strength,
develop critical skills and competencies, and to ensure
OSHPD is also working on mechanisms to capture
the development of effective knowledge-transfer
data on employee experiences. In 2016, the
methodologies.
Department conducted an employee feedback survey
that collected input from the entire workforce. One
Recruitment and Retention Data result of the survey was an overwhelming sense of the
Challenges employees’ dedication to the mission of the Department
and to their individual programs. In August of 2016
Through the summer and fall of 2015, employee
and April of 2017, DynoCom provided responses to
feedback was sought through open forums with the
and updates on the progress in responding to the
community to revise the Strategic Plan, to map out
key survey issues, such as the requests for training
a clear vision and efficient processes to advance
and development assignments, cross-training, and
OSHPD’s mission, and to guide the work of the
mentoring opportunities. OSHPD intends to continue
Department over the next three years. The feedback
conducting annual surveys to collect feedback, assess
from this outreach led to an updated mission statement,
progress, and develop trends.
revised goal objectives, key performance indicators to
help measure progress towards meeting those goals,
The Department has also adopted onboarding
and an updated Strategic Governance Model to guide
guidelines that go beyond creating a welcoming work
the implementation of the new Strategic Plan.
environment to enable the new employee to feel
comfortable and ready to become an effective team
OSHPD’s governance model was developed with
member. The guidelines also provide the supervisor
department-wide participation and lead to, among
the core elements of the Department’s training and
other innovations, ongoing goal teams that are staffed
performance feedback processes (including probation
by representatives from each OSHPD division. The
reports) that are aimed at helping the employee
Dynamic OSHPD Community (DynoCom) team
develop skills to meet performance criteria.
specifically focuses on the workforce environment,
including the development of training and advancement
OSHPD currently has no process for exit interviews.
opportunities. This team meets regularly and
As a result, the reasons for employment separation
provides essential ongoing feedback from staff on
are largely anecdotal. The Department will research
the Department’s efforts in these areas. DynoCom’s
and review effective exit interview strategies before
goals are listed:
14Workforce Gap Analysis, cont.
beginning the development of its own standardized • The data sections of the Information Services
Division experiences challenges in recruiting for
format. In the Action Plans section of the Plan, the
Department proposes a strategy to address the need the Research Scientist classifications. The state
to develop departmental guidelines for exit interviews. specifications do not reflect what is really needed
in the position and should be updated to reflect the
Recruitment Gaps and Risks current direction of the business community and
research industry.
OSHPD faces several different kinds of recruitment
risks. Private sector competition, in the form of higher The recruitment risk when hiring into non-professional
wages and competitive benefits, is the single greatest classifications does not reflect a lack of candidates,
challenge to recruitment for professional positions. but a lack of candidates with the rights skills. Many
The state of the economy is also a significant factor. of the generalized classifications (such as Staff
There are more qualified professional applicants Services Analyst, Associate Government Program
when the economy is slow than when it is at full Analyst, Health Program Specialist, Research
employment. Private sector competition, the vagaries Program Specialist, and Staff Services Manager)
of the economy, and other factors present challenges within the Department have significant deficiencies
in recruiting for professional positions in several in communication (oral and written) skills, analytical
specific divisions: skills, and in the ability to produce completed staff
work. There is concern that some of the state
• The Facilities Development Division experiences examination processes pass candidates who are
private sector competition and the effects of the incapable of performing the job, placing a burden
economy when recruiting for any of its engineer on the Department to develop its own standardized
classifications, but most acutely when recruiting screening techniques to ensure hiring at the highest
structural engineers, who are required to be both skill level for each classification.
certified engineers and experienced in hospital
construction. Recruitment can also be hindered by The most effective recruitment measures will result
restrictions existing in the state hiring process. The in hiring the right person with the right skills for the
state exam and hiring process has become very right job at the right time. OSHPD has recruitment
protracted, often resulting in the loss of qualified risk related to the lack of a standardized assessment
individuals to other, more nimble, employers. tool to screen applicants for writing and analytical
competency.
• The Cal-Mortgage Loan Insurance Division hires
experienced banking professionals into its Health
Currently, the Department must provide training to
Facility Construction Financing series and has
employees who are deficient in the basic skills required
great difficulty competing with the private sector
of their classifications. The Department will develop
during a robust economy.
classification-appropriate writing and analytical
• The Information Services Division likewise
competes with the private sector when recruiting
competency assessment tools for use in recruiting
efforts across all divisions.
for any of its information technology systems
positions. Additional recruitment challenges are The Department will be developing strategies to
presented by the state exam process for information promote wide-ranging discussions of exam processes
technology systems positions. These exams are and the need for effective marketing techniques,
often considered confusing and non intuitive by including discussions with CalHR on current external
qualified private sector applicants due to outdated marketing methods and uniform skill assessment tools
terminology and antiquated qualifications required and exercises to determine qualified candidates.
for specific civil service classifications.
15Workforce Gap Analysis, cont.
Retention Gaps and Risks
Because OSHPD is a small department, career
paths are often limited. In some divisions, there may
be only one authorized position in an occupational
series, meaning that an incumbent who wants to
advance must seek promotion in another division or
outside OSHPD. Although the Department has not
conducted exit interviews, it is widely reported that
lack of promotional opportunity or poor fit of skills to
the position are the principal reasons people leave
their positions.
The risk of not addressing retention challenges is that
OSHPD may be unable to retain qualified candidates, The Department is also in the process of reorganizing
provide quality services, or meet its vision. Turnover divisions to properly align functions and establish
is expensive. New recruits must be trained and infrastructures that support employees and offer
work slows during the training process. Excessive some promotional opportunities. For example, the
turnover can place a burden on remaining staff who Healthcare Workforce Development Division recently
must carry the additional workload. Although OSHPD created a research unit, which established a career
cannot eliminate the problem of limited promotional path for research analysts/specialists.
opportunities, the Department can develop strategies
that will expedite training of new recruits, motivate Knowledge Transfer Gaps and Risks
employees, and assess employee satisfaction, with
the goal of maximizing the employee’s experience and Knowledge transfer gaps can present a real risk
productivity. to any department that experiences turnover or
succession planning issues, but are particularly risky
Retention also reflects the employee’s perception of to a department with limited promotional opportunities.
benefits and recognition in the workplace. Work life If trained employees do not promote within the same
balance, clear expectations, training and development unit, their knowledge base is gone when the employee
are key to employee satisfaction. OSHPD is already leaves the organization. On a positive note, the influx
addressing these issues through its DynoCom team, of new employees to replace exiting workers can
which focuses on the workforce environment, including infuse the workforce with new ideas and perspective,
the development of training and advancement as well as fresh skills. If the knowledge transfer is
opportunities. successful, the changeover can have positive impact
on the Department.
Existing knowledge transfer gap issues among
OSHPD divisions include the following:
• Dated, inconsistent, or nonexistent written desk
and process procedures. It is essential that current
desk and process procedures be in place to assure
that critical information is readily available to a new
employee and to back-up staff in the unit.
16Workforce Gap Analysis, cont.
• Dated or nonexistent core competency identifiers.
Identifying core competencies enables the
• There is no documented mentoring program
for professional development of managers or
assessment of an employee’s strengths in relation employees.
to the unit’s needs and helps prescribe necessary
training. Competency identifiers are particularly • There is a lack of comprehensive training programs
for all employees and a lack of identified training
important for identifying future leaders.
resources and tools.
• Incomplete standardization of training requirements
by classification or position. Ensuring that each Department-defined guidelines should be developed
person receives the appropriate training for his/her to address each of these gaps, with a requirement that
position is essential to success. each division document, within a defined time horizon,
the development of desk manuals and procedures
• Inconsistent individualized training and leadership
development opportunities. Identifying and
for key functions, succession plans, leadership
competency assessments, and professional mentoring
promoting individualized educational opportunities programs.
reduces the knowledge transfer gap and motivates
and enriches the employee, which can also reduce The 80 hours of supervisor training required by
the retention gap. SB 848 (Chapter 35, Statutes of 2016) addresses the
role of the supervisor and the techniques required to
The Department has prioritized the enhancement of key perform supervisory duties. Effective leadership is
skills, training, and knowledge transfer in its Strategic much more than the performance of supervisory tasks,
Plan as one of the goals of the DynoCom team. however. The Department should also address the
Additionally, the development of training curriculums development of leadership skills, particularly where
and key competencies by position/classification are leadership competency or aptitude is lacking. This
part of the Action Plan included in this Plan. will require assessment of coaching and mentoring
programs as well as possible collaboration with CalHR.
Succession Planning Gaps and Risks
These are longer range goals in the Department’s
Certain succession planning gaps appear throughout Action Plan, but their importance cannot be over
OSHPD: emphasized. OSHPD’s performance in a dynamic
future will require quality leadership to ensure
• Succession plans, if present, are not documented.
maximization of workforce talent in support of the
• Leadership competency has not been developed
for all divisions.
agency’s goals.
17Action Plan
Strategy Gap(s) Addressed Deadline Resources
Continue to improve the practices of the Disability Workforce demographics Annual review EEO Officer
Advisory Committee in response to OSHPD-specific
data to ensure a talented and diverse workforce.
Develop awareness of gender pay gap data and Workforce demographics June 2018 Human Resources
promote recruitment efforts to reduce gender pay Division Deputies
issues.
Research and develop recruitment strategies for hard- Recruitment June 2019 Human Resources
to-fill classifications. Division Deputies
Collect data and refresh on-boarding guidelines on a Recruitment and Annual review Human Resources
continuing basis. Include reasons for application and retention
acceptance of position.
Develop exit questionnaire to gather data on reasons Retention December 2017 Human Resources
for leaving and improvements needed.
Gather employee feedback on employee recognition Retention Annual review DynoCom
measures and on improving the employment
environment.
Develop training curriculum for each position/ Retention and knowledge June 2019 HR Manager, Training
classification and a history of each employee’s transfer Officer, and Division
training. Chiefs
Develop list of key competencies by position/ Retention and knowledge June 2020
2018 Human Resources
classification and track employees’ mastery. transfer Division Deputies
Develop generalized format for desk/process Knowledge transfer June 2018 Division Deputies
procedures and set a Department-wide date for
completion.
Develop formalized back-up plans by position and Knowledge transfer June 2018 HR Manager and
explore
Strategypossibility of job cross-training and rotation. Gap(s) Addressed Deadline Division
ResourcesDeputies
Explore other knowledge transfer processes, such as Knowledge transfer June 2018 HR Manager, Training
informal sharing/teaching sessions by units in a Officer, and Division
division. Chiefs
Develop and set a Department-wide date for Succession planning June 2020 Director, Human
OSHPD WORKFORCE
completion of leadershipMANAGEMENT AND SUCCESSION PLAN – 2017-2021
succession plans. Page 18
Resources, Division
Deputies
Develop a leadership mentoring program. Retention and succession June 2020 Director, Human
planning Resources, Division
Deputies
Develop a succession plan that identifies the Succession planning Ongoing Director, Human
following: Resources, Division
• Key leadership and highly technical positions that Deputies
are critical to the Department’s success
• Competencies required to fill these positions
• Leadership pipeline to potentially succeed these
positions, or fill them on an interim basis
• Methodology to assess leadership competencies
and readiness of those in pipeline
• Gap assessment of existing competencies
compared to needed competencies
• Realistic and achievable action plan with time-
based metrics to address succession planning
gaps
18References and Data Sources
All OSHPD employment data was provided by OSHPD Human Resources through its access to the State Controller’s Office,
Management Information Retrieval System.
OSHPD retirement and service credit data was furnished by CalPERS.
1. California Department of Human Resources, Workforce Plan Template,
http://www.calhr.ca.gov/_layouts/15/WopiFrame.aspx?sourcedoc=/Documents/wfp-workforce-plan-
template.docx&action=default&DefaultItemOpen=1
2. CalPERS FACTS AT A GLANCE, “PENSION INFORMATION (FY 2014-15 RETIREES)”, (Figures as of June 30, 2015),
https://www.calpers.ca.gov/docs/forms-publications/facts-at-a-glance.pdf
3. Bureau of Labor Statistics, Economic News Release, Table B-5. Employment of women on nonfarm payrolls by industry sector,
seasonally adjusted [November 2016 data] https://www.bls.gov/news.release/empsit.t21.htm
4. U.S. Senate, Joint Economic Committee, Press Release, New Report Examines the Causes and Effects of Gender Pay Inequality,
http://www.jec.senate.gov/public/index.cfm/democrats/pressreleases-671?ID=96EC0B5F-06E4-4748-AE70-250F6977A6A9
OSHPD WORKFORCE MANAGEMENT AND SUCCESSION PLAN – 2017-2021 Page 20
19You can also read