A GUIDE TO AUSTRALASIA'S GAMBLING INDUSTRIES CHAPTER ONE - Facts, Figures and Statistics - Australasian ...
←
→
Page content transcription
If your browser does not render page correctly, please read the page content below
A GUIDE TO AUSTRALASIA’S
  GAMBLING INDUSTRIES
      Facts, Figures and Statistics

        CHAPTER ONE
 The Australian Gambling Environment
                2018/19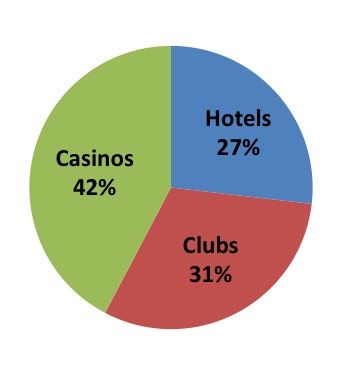
A Guide to Australasia’s Gambling Industries
                          Published and Prepared by the Australasian Gaming Council (AGC).

                                                           Melbourne 300
                                                           Victoria Australia
                                                           +61 3 96
                                                     info@austgamingcouncil.org.au
                                                     www.austgamingcouncil.org.au

DISCLAIMER
Whilst a great deal of care has been taken in the preparation of this publication, it is nevertheless necessary to caution users with regard to its
accuracy.

The information contained in this publication has been obtained from external sources and has not been independently verified by the Australasian
Gaming Council (“the Council”).

The Council expressly disclaims all and any liability (including all liability from or attributable to any neglect or wrongful act or omission) to any
persons in respect of anything done or omitted to be done by any person in reliance whether in whole or in part upon any material in this
publication.

The Australasian Gaming Council welcomes comments and suggestions on this publication. Please contact info@austgamingcouncil.org.au

This publication is copyright. No part may be reproduced by any process except in accordance with the provisions of the Copyright Act 1986.
A Guide to Australasia’s Gambling Industries 2018/19                                                            Australasian Gaming Council

 Chapter 1
 Australia’s Gambling Environment

 GAMBLING IN AUSTRALIA ..............................................................................................................1
 DEFINITIONS ..........................................................................................................................................2

 FORMS OF GAMBLING IN AUSTRALIA ..........................................................................................3
 GAMING IN AUSTRALIA ...................................................................................................................4
 CASINOS ................................................................................................................................................4

 ELECTRONIC GAMING MACHINES .............................................................................................................6

 KENO    ..................................................................................................................................................13
 LOTTERIES, LOTTO AND INSTANT LOTTERIES ..........................................................................................15

 ONLINE/INTERACTIVE GAMBLING IN AUSTRALIA.....................................................................18
 RACING AND WAGERING IN AUSTRALIA ....................................................................................19
 RACING     ...............................................................................................................................................19
 WAGERING...........................................................................................................................................24

 BETTING EXCHANGES ...........................................................................................................................24

 BOOKMAKERS ......................................................................................................................................24

 SPORTS BETTING           .................................................................................................................................25
 TOTALISATOR AGENCY BOARD (TAB/TOTE) .............................................................................................26

 LICENCE AND EXCLUSIVITY ARRANGEMENTS .........................................................................28
 CASINOS ..............................................................................................................................................28

 KENO    ..................................................................................................................................................30
 LOTTERIES ...........................................................................................................................................31

 WAGERING...........................................................................................................................................32

Version Control

 Version                   Date                          Explanation

 2016-17                   July 2019                     2016-17 Edition. Updated with statistics from Australian Gambling
                                                         Statistics, 34th Edition.

 2017-18                   January 2020                  2017-18 Edition. Updated with statistics from Australian Gambling
                                                         Statistics, 35th Edition.

 2018-19                   July 2021                     2018-19 Edition. Updated with statistics from Australian Gambling
                                                         Statistics, 36th Edition.

                                                                                1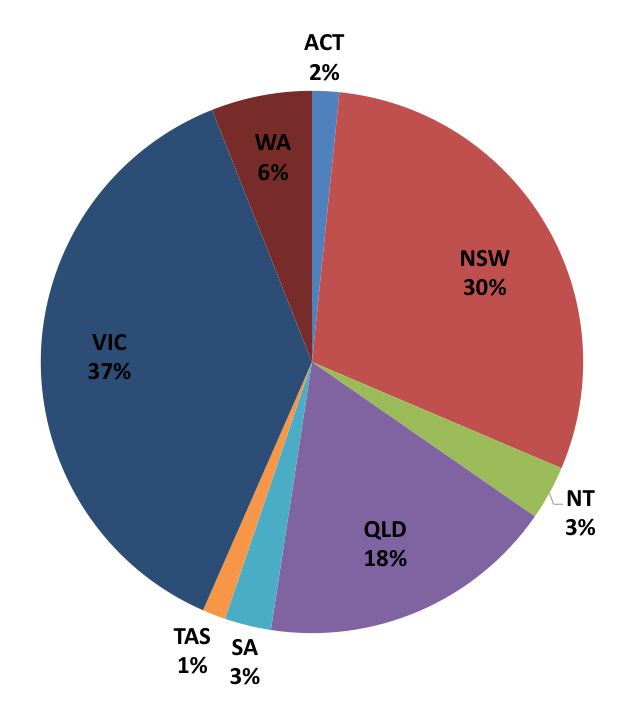
Chapter 1 – Australia’s Gambling Environment

GAMBLING IN AUSTRALIA

Definitions

Gambling
Gambling is the placement of a wager or bet on the outcome of a future uncertain event. Gambling in this
guide refers to gaming and wagering activities that are legally provided. 1

Gaming
Gaming refers to all legal forms of gambling other than wagering (i.e. race and sports betting), such as
lotteries, Electronic Gaming Machines (EGMs), casino games, keno, poker and minor gaming (which is the
collective name given to raffles, bingo and lucky envelopes etc…). 2

Interactive Gambling/Gaming

Interactive gambling is a term used to describe gambling activities conducted via the internet. In Australia the
Interactive Gambling Act 2001 strictly prohibits the offer of gaming activities (e.g. casino games, EGMs) via
the internet to Australians. 3 An exception is made for the provision of wagering activities on racing and sports.

Lotteries/Instant Lotteries

Lotteries are conducted in Australia by both government and commercial operators. There are three
components to a lottery – the purchase of a ticket, the draw and a prize. Lottery prizes are based on the total
amounts wagered after deduction of a set percentage by the operator to cover costs. Lottery tickets are sold
at various outlets around Australia – such as newsagents. The same operators may also conduct lotto, pools
and instant lottery. 4

Instant lotteries, also known as scratch cards, “scratch-its” or “scratchies”, operate in the same manner as
lotteries. Prizes, which are revealed by the player scratching the ticket, are paid on a set return to player
based on the number of tickets in any set, the cost to purchase the tickets and the percentage retained by the
operator to cover costs. 5

Race betting

Comprises legal betting with bookmakers and totalisators, both on and off-course, where bets are placed on
the outcome of local, national or international horse and/or greyhound races. 6

Social gaming

Social games are the activity or practice of playing an online game on a social media platform. While some
social games may have gambling related themes (casino style games) others do not. These games typically
operate on a freemium, free, paid or subscription model. 7 Gambling games, in contrast, are licenced services
offering people the possibility of placing a stake or bet with the chance of winning or losing money. Social
games are not covered in this guide.

Sports betting

Sports betting is wagering on approved types of local, national or international sporting activities (other than
horse and/or greyhound racing), whether on or off-course in person, via telephone or via the internet. 8

Wagering
Wagering refers to all legal forms of gambling on racing and sporting events. 9

1
  Queensland Government Statistician’s Office, Queensland Treasury (2021) Australian Gambling Statistics 1993-94 to 2018-19 (36th edition).
2
  Ibid
3
  The term ‘via the internet’ refers to sundry internet connected devices – including mobile devices.
4
  Queensland Government Statistician’s Office, Queensland Treasury (2021) Australian Gambling Statistics 1993-94 to 2018-19 (36th edition).
5
  Ibid
6
  Ibid
7
  For a more detailed definition and further information regarding social games see: http://www.i-sga.org/about-social-games/
8
  Queensland Government Statistician’s Office, Queensland Treasury (2021) Australian Gambling Statistics 1993-94 to 2018-19 (36th edition).
9
  Ibid
                                                                       2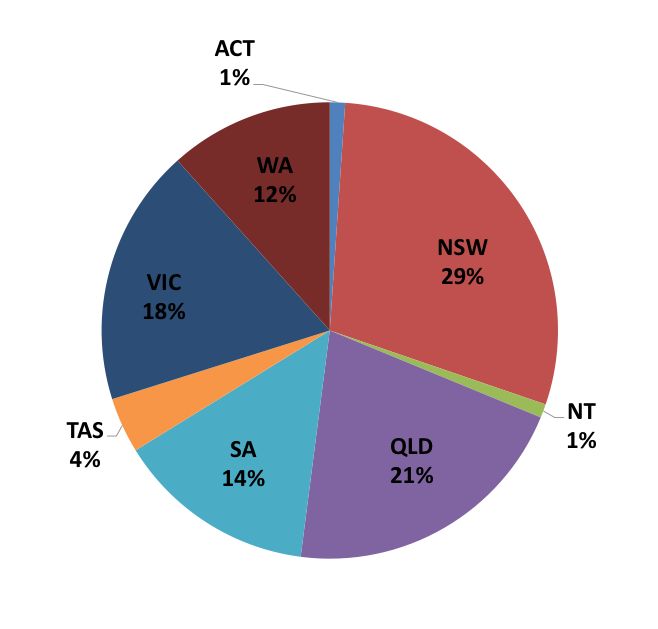
A Guide to Australasia’s Gambling Industries 2018/19 Australasian Gaming Council
FORMS OF GAMBLING IN AUSTRALIA
Table 1-1 Forms of gambling in Australia by state/territory
Gambling Form ACT NSW NT QLD SA TAS VIC WA
Tasmania’s betting exchange (Betfair) surrendered its licence in November 2016. Betting exchange wagering is
Betting exchange currently only undertaken in the Northern Territory.
Casino gaming
Football pools
Hotels
Gaming and Casino
Clubs
machines only
only 10
Casino
Keno only
Lotteries
Minor gaming
Interactive gambling in Australia is governed by the Interactive Gambling Act 2001. The Act prohibits the offer of
Online/Interactive interactive gaming (online casinos, EGMs etc…) to Australian residents but makes an exception for wagering in the
gambling form of race and sports betting. Lotteries may also offer ticket sales online. Interactive gaming exists in the
Northern Territory but is available only to overseas visitors.
Racing and
betting
Sports betting
Source: Queensland Government Statistician’s Office, Queensland Treasury (2021) Australian Gambling Statistics 1993-94 to 2018-19 (36th
edition). Refer to Australian Gambling Statistics Explanatory Notes for further information. 2019-20 status verified by the AGC.
10
The ACT government has passed legislation (2 November 2017) that will allow the ACT Casino to acquire up to 200 EGMs and 60 Fully Automated
Table Games (FATGs), under strict conditions, from within the existing state-wide cap. To date the casino does not offer EGMs.
3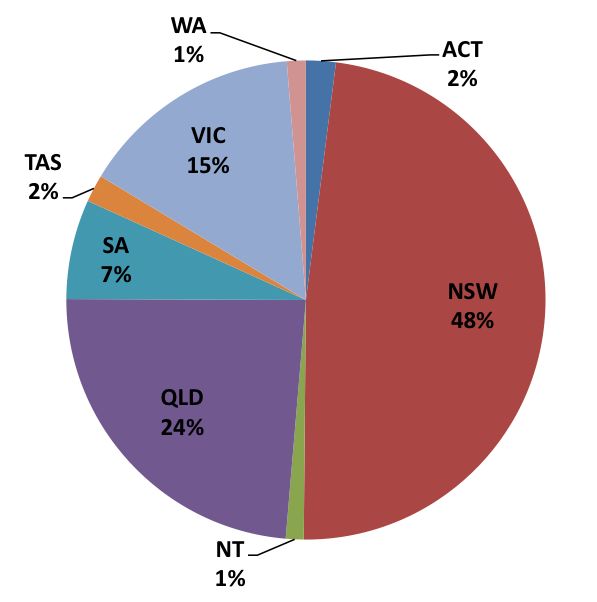
Chapter 1 – Australia’s Gambling Environment

GAMING IN AUSTRALIA

Casinos

Thirteen casinos operated throughout Australia in the periods from 2018-19 to 2019-20, many offering a
number of other amenities alongside gaming opportunities including:

     •     hotel and accommodation facilities;
     •     cultural and entertainment facilities – such as theatres, cinemas and showrooms;
     •     recreational facilities - such as games arcades, mini-golf, ten-pin bowling, pools and gyms;
     •     business facilities - such as conference centres and meeting rooms; as well as
     •     fine/casual dining options, bars, bistros and retail shopping outlets.

The provision of gaming at Australian casinos is highly regulated. Comprehensive rules and fixed odds
(approved by the relevant jurisdictional regulatory authorities) are in place.

Bets at casinos may be placed on various table games, fully and/or semi-automated table games, and
electronic gaming machines (which are available at all casinos in Australia with the exception of Casino
Canberra in the ACT 11 ).

Some of the table game varieties available at casinos in Australia include Baccarat, Roulette, Blackjack, Sic
Bo, Pai Gow, Poker and Big Wheel.

Some casinos may also provide outlets for race wagering and sports betting, keno and bingo.

Table 1-2              Number of casinos in Australia by state/territory
Location                                                                               Property Name         Number of casinos
Australian Capital Territory                       Canberra                           Casino Canberra                        1

New South Wales 12                                   Sydney                            The Star Sydney                            1

Northern Territory                                   Darwin            Mindil Beach Casino & Resort 13                            1
                                               Alice Springs                       Lasseters Casino                               1
                                                                                                                                  2
Queensland 14                                      Brisbane                          Treasury Brisbane                            1
                                                     Cairns                      The Reef Hotel Casino                            1
                                                 Gold Coast                        The Star Gold Coast                            1
                                                 Townsville                    The Ville Resort - Casino                          1
                                                                                                                                  4
South Australia                                     Adelaide                          SkyCity Adelaide                            1

Tasmania                                            Hobart                          Wrest Point Casino                            1
                                                Launceston                         Country Club Casino                            1
                                                                                                                                  2
Victoria                                          Melbourne                           Crown Melbourne                             1

Western Australia                                       Perth                              Crown Perth                            1

Total                                                                                                                            13
Note. Casinos operating in Australia for the periods 2018-19 to 2019-20.

11
   The ACT government has passed legislation (2 November 2017) that will allow the ACT Casino to acquire up to 200 EGMs and 60 Fully Automated
Table Games (FATGs), under strict conditions, from within the existing state-wide cap. To date the casino does not offer EGMs.
12
   On 8 July 2014, Liquor and Gaming NSW issued a restricted gaming licence to Crown Resorts Limited to operate a restricted gaming facility at
Barangaroo South, Crown Sydney Hotel Resort (Crown Sydney). Crown Sydney, also referred to as One Barangaroo, was opened in December 2020
(excluding gambling operations). Crown Resorts is working with the Independent Liquor and Gaming Authority (ILGA), the NSW regulator, to satisfy
casino licence requirements to commence gambling operations. https://www.traveller.com.au/crown-towers-hotel-opens-at-crown-sydney-barangaroo-
h1t2f9 (accessed 1 June 2021).
13
   The SKYCITY Entertainment Group sold the Darwin casino to Delaware North in 2018. On 4 April 2019, a share sale agreement in respect of
SKYCITY Darwin Pty Ltd was formally completed, and Delaware North Northern Territory Gaming and Entertainment Pty Ltd (Delaware
North) is now the owner of the Darwin Casino, trading as Mindil Beach Casino & Resort.
14
   In July 2015 the Destination Brisbane Consortium was announced as the preferred proponent to develop and operate an integrated resort at
Queen’s Wharf Brisbane. The resort is due for completion in 2022. Once complete the Treasury Brisbane casino will be repurposed.
                                                                           4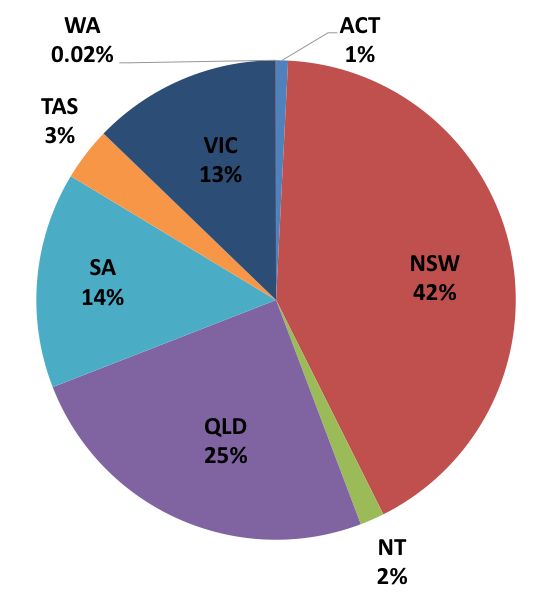
A Guide to Australasia’s Gambling Industries 2018/19                                                 Australasian Gaming Council

Table 1-3             Estimated number of casino table games and EGMs in Australia (2018-19)

Please note that figures in the following table are a snapshot, current only for the period stated. Total EGM
figures recorded are those reported as operational by the Queensland Government Statistician in the national
statistical volume as at 30 June 2019.

Location                                                Venue                              Tables                  EGMs 15
Australian Capital Territory    16
                                            Casino Canberra                                   49                      Nil

New South Wales                             The Star Sydney                                  323                     1,500

Northern Territory 17                       Mindil Beach Casino & Resort 18                   41                      676
                                            Lasseters Casino                                  22                      307
                                                                                              63                      983

Queensland 19                               The Star Gold Coast                              118                     1,519
                                            Treasury Brisbane                                 79                     1,586
                                            The Ville Resort - Casino                         21                      351
                                            The Reef Hotel Casino                             37                      454
                                                                                             255                     3,910

South Australia                             SkyCity Adelaide                                 82 20                   834 21

Tasmania                                    Wrest Point Casino                                24                      N/A
                                            Country Club Casino                               14                      N/A
                                                                                             38 22                 1,221    23

Victoria                                    Crown Melbourne                                 540 24                   2,628

Western Australia                           Crown Perth                                     350 25                   2,466

Total                                                                                       1,700                   13,542

Source: Queensland Government Statistician’s Office, Queensland Treasury (2021) Australian Gambling Statistics 1993-94 to 2018-19 (36th
edition), with updates by the AGC. Refer to Australian Gambling Statistics Explanatory Notes for further information.

15
   Operational EGMs as at 30 June 2019 as reported by Queensland Government Statistician’s Office, Queensland Treasury (2021) Australian
Gambling Statistics 1993-94 to 2018-19 (36th edition). Refer to Australian Gambling Statistics Explanatory Notes for further information.
16
   The ACT government has passed legislation (2 November 2017) that will allow the ACT Casino to acquire up to 200 EGMs and 60 Fully Automated
Table Games (FATGs), under strict conditions, from within the existing state-wide cap. To date the casino does not offer EGMs.
17
   Northern Territory Government (2019) Director-General of Licensing Annual Report 2018-19.
18
   The SKYCITY Entertainment Group sold the Darwin casino to Delaware North in 2018. On 4 April 2019, a share sale agreement in respect of
SKYCITY Darwin Pty Ltd was formally completed, and Delaware North Northern Territory Gaming and Entertainment Pty Ltd (Delaware
North) is now the owner of the Darwin Casino, trading as Mindil Beach Casino & Resort.
19
   Queensland Office of Liquor and Gaming Regulation (2020) 18-19 Statistical Report. Figures refer to operational rather than approved numbers.
20
   SkyCity (2019) Annual Report: Year Ended 30 June 2019. Note.Amendments to the Approved Licensing Agreement for Casino Adelaide in
February 2014 limit the maximum number of tables in operation at any one time to 200.
21
   In February 2014, the South Australian Government implemented reforms that will allow SkyCity Adelaide to increase the number of EGMs that can
be operated from 995 to 1,500. To allow for the operation of any additional EGMs, the casino will be required to purchase additional entitlements
through the Approved Trading Scheme.
22
   Tasmanian Government Department of Treasury and Finance, Table Gaming Activities in Tasmanian Casinos. Status as at 1 October 2019. All
tables may not be in operation.
http://www.treasury.tas.gov.au/liquor-and-gaming/legislation-and-data/gambling-industry-data/table-gaming-activities-in-tasmanian-casinos (accessed
22 January 2020).
23
   Please note that Queensland Government Statistician’s Office, Queensland Treasury (2021) Australian Gambling Statistics 1993-94 to 2018-19 (36th
edition) reports a total of 1,221 operational EGMs in Tasmania’s two casinos at 30 June 2019. This figure differs from the data available on the
website of the Tasmanian Liquor and Gaming Commission which reports that the number of casino EGMs stands at 1,185. Owing to this discrepancy
statistics are reported as published by the Queensland Government Statistician’s Office which are referenced but are not differentiated by property.
24
   Crown Resorts Ltd (2019) Annual Report 2019. Please note these are approved rather than operational numbers.
25
   Crown Resorts Ltd (2019) Annual Report 2019. Please note these are approved rather than operational numbers.
                                                                       5
Chapter 1 – Australia’s Gambling Environment

Electronic Gaming Machines
All states and territories in Australia have Electronic Gaming Machines (also known as gaming machines, EGMs,
poker machines or ‘pokies’) available at licensed venues (with the exception of Western Australia which permits
EGMs only at the casino).

Gaming machines can be defined as a device designed for the playing of a game of chance that pays out money
or tokens or registers a right to an amount of money to be paid. 26

Bets are placed on an EGM by selecting the lines to be played, the bet per line and then pushing a button that
places machine reels in motion.

Prizes are paid out according to the position of symbols displayed when the machine reels halt.

All EGM game results are determined by a Random Number Generator (RNG). The style of game and game
characteristics may vary somewhat between jurisdictions but are determined by state/territory government
legislation and regulations.

Restrictions on EGM availability (including EGM caps) apply throughout Australian jurisdictions - whether on a
state-wide, regional and/or venue basis.

Caps vary according to jurisdiction. Many have been accompanied by forfeiture requirements upon redistribution
and/or other arrangements.

Table 1-4             State-Wide EGM Caps
Location                           Clubs/Hotels           Casino(s)                                             Cap arrangements

                                                                             Changes to the Gaming Machine Act 2004
                                                                             commenced on 31 August 2015 as part of the
                                                                             Government's EGM reform package. The changes
                                                                             introduced a phased reduction in the number of EGMs
                                                                             operating in the Territory from 5,022 to 4,000 or fewer
                                                                             by 2020.

                                                                             The ACT has undergone a process of surrender of
Australian                                                                   authorisations to meet the reduced limit applicable
                                                               200 28
Capital Territory             4,000 (by 2020) 27                             by 2020.

                                                                             Number of authorisations in place: 29

                                                                              -    4,989 as at 30 June 2016
                                                                              -    4,985 as at 30 June 2017
                                                                              -    4,947 as at 30 June 2018
                                                                              -    4,001 as at 30 June 2019
                                                                              -    3,997 as at 30 June 2020

                                                                             A state-wide cap of 99,000 electronic gaming
                                                                             machines is permitted in NSW, of which 97,500
                                                                             are distributed amongst clubs and hotels, and
                                                                             1,500 permitted at The Star casino. 30
New South Wales                           97,500               1,500
                                                                             In March 2018 the NSW Government introduced a
                                                                             cap on existing gaming machine numbers in high-
                                                                             risk areas. 31

26
   Adapted from the Gaming Machines Act 2001 (NSW).
27
   On 23 August 2018 the ACT Government tabled the Pathway to reduce the number of gaming machine authorisations in the ACT via a two-step
approach of voluntary and compulsory surrender of gaming machine authorisations. https://www.gamblingandracing.act.gov.au/industry/gaming-
machines/pathway-to-4000-gaming-machines (accessed 22 January 2020).
28
   The ACT Casino (Electronic Gaming) Act 2017 introduced legislation that would allow the Canberra Casino to operate up to 200 EGMs, subject to
strict conditions, to be acquired through the existing trading scheme. To date the casino does not offer EGMs.
29
   ACT Government, Gambling and Racing Commission (2018) Gaming Machine Reform Package: Trading Scheme Information
https://www.gamblingandracing.act.gov.au/publications (accessed 22 January 2020)
30
   NSW Government, Gaming Machines Act 2001.
31
   NSW Government, Minister Paul Toole, Gaming machine numbers will not rise under new laws: Media Release, 12 March 2018.
                                                                        6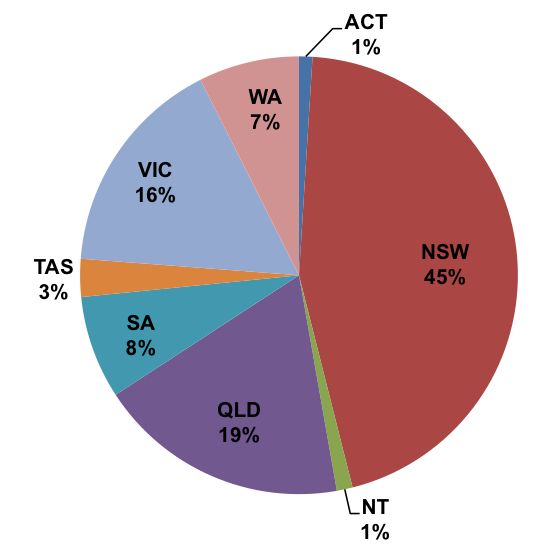
A Guide to Australasia’s Gambling Industries 2018/19                                             Australasian Gaming Council

Location                          Clubs/Hotels           Casino(s)          Cap arrangements
                                                                            There is a limit on how many gaming machines are
                                                                            allowed to operate in pubs and clubs in the
                                                                            Northern Territory.

                                                                            On 16 November 2016 a territory-wide cap on
                                                                            machines of 1,852 was announced.

                                                                            On 1 June 2018 the Northern Territory
                                                                            Government announced a lowering of the cap on
Northern
                                           1,699            No cap          community gaming machines from 1,852 to
Territory
                                                                            1,734. 32

                                                                            As at 2021, the maximum number allowed is
                                                                            1,699. 33

                                                                            Gaming machines in the Territory's two casinos
                                                                            are outside the cap limit and not included in the
                                                                            total. 34

                                                                            A state-wide cap of 19,500 EGMs for hotels and a cap
                                                                            of 24,705 EGMs for clubs applies. 35

                                                                            Casinos are limited by ratio of 12 gaming machines
                                                            Limited         per table game. 36
Queensland                                44,205
                                                            by ratio
                                                                            The Queen’s Wharf Brisbane (QWB) casino operator
                                                                            will have an entitlement to 2,500 gaming machines,
                                                                            although not all machines may be installed at
                                                                            opening. 37

                                                                            A state-wide objective of 13,081 EGMs, across all
                                                                            sector venues, has been established for the State.
                                                                            Forfeiture requirements are in place to reduce the
                                                                            number of EGMs to achieve a cap of 12,086
                                                                            electronic gaming machines in clubs and hotels in
                                                                            South Australia. 38
                                                           995 to           Under a new licensing agreement, the SkyCity
South Australia                           12,086
                                                           1,500            Adelaide casino will undertake an expansion that
                                                                            will allow it to increase the maximum number of
                                                                            EGMs it can operate from the current 995 to 1,500.

                                                                            The additional 505 entitlements granted to the
                                                                            casino are initially required to be purchased from
                                                                            within the existing Approved Trading Scheme. 39

                                                                            The maximum number of gaming machines that
                                                                            may be installed in Tasmania, across all premises,
Tasmania 40                                2,500              1,180         is 3,680, of which a maximum 2,500 are allocated
                                                                            to clubs and hotels. 41

32
   NT Government (2018) Less Pokies and Tackling Gambling Related Harm: Media Statement, Natasha Fyles, Attorney-General and Minister for
Justice.
33
   NT Government (2021) https://nt.gov.au/industry/gambling/licences/gaming-machines-in-clubs-pubs/gaming-machines-in-clubs-pubs (accessed April
2021)
34
   NT Government (2021) https://nt.gov.au/industry/gambling/licences/gaming-machines-in-clubs-pubs/gaming-machines-in-clubs-pubs (accessed April
2021.
35
   QLD Government, Gaming Machine Regulation 2002.
36
   QLD Government, Gaming Machine Regulation 2002.
37
   QLD Government (2021) https://www.statedevelopment.qld.gov.au/industry/queens-wharf-brisbane/probity-and-gaming (accessed July 2021).
38
   SA Government (2020) Gambling Reform Update - Gaming Machine Licensing: Key Reforms for Gaming Licensees.
39
   SA Government, Department of Treasury and Finance (2015) Approved Licence Agreement (SkyCity Adelaide), Government of South Australia,
Consumer and Business Services (2018) The Approved Trading System Explained: Gaming Machines Act 1992.
40
   Tasmanian Government, Gaming Control Act 1993.
41
   The state-wide cap does not include gaming machines operated on vessels operated by the Trans-Tasman-Line (TT Line Ferries which operate 36
EGMs).
                                                                       7
Chapter 1 – Australia’s Gambling Environment
Location Clubs/Hotels Casino(s) Cap arrangements
A state-wide cap of 30,000 gaming machines is
mandated in Victoria of which 2,628 are allocated
to the casino, and 27,372 are allocated to clubs
and hotels, split evenly between the two venue
types (13,686 entitlements for clubs and 13,686
entitlements for hotels).
Victoria 27,372 2,628
For EGM entitlements that take effect on or after
16 August 2022: 48.49% of those entitlements will
be allocated to clubs; and 51.51% will be allocated
to hotels. 42
Further caps – including regional and municipal
caps – and ownership restrictions also apply. 43
Western Western Australia’s casino has been allocated a
N/A 2,500
Australia cap of 2,500 electronic gaming machines.
Table 1-5 EGM cap arrangements in club venues by state/territory
Location Year legalised Cap arrangements
Australian Capital
1976 No venue cap.
Territory
Clubs must abide by a Gaming Machine Threshold (GMT)
applicable at each venue. Clubs may apply to increase their
New South Wales 1956
allocated GMT but must satisfy associated regulatory
requirements, including a local impact assessment.
Northern Territory 2014 55 EGMs per venue.
Queensland 1992 300 EGMs per venue.
South Australia 1994 40 EGMs per venue.
Tasmania 1997 40 EGMs per venue.
Victoria 1992 105 EGMs per venue.
Western Australia N/A Not applicable.
42
VIC Government (2018) Ministerial Order: Number of Gaming Machine Entitlements Victorian Government Gazette No. S 330, Monday 9 July 2018.
43
Regional caps were the first introduced in 2001 and there are currently 25 purpose-defined regions with specific caps. Municipal limits have been
calculated using the 2017 adult population, with the municipal limit set in most cases at 10 gaming machine entitlements per 1,000 adults. There are
exceptions for the Melbourne CBD, Southbank and Docklands areas. https://www.vcglr.vic.gov.au/gambling/gaming-venue-operator/understand-your-
gaming-licence/caps-and-limits?__cf_chl_jschl_tk__=pmd_78a2ebef55703af96be10522c06e2eae7475582e-1627405118-0-gqNtZGzNAjijcnBszQlO
(accessed July 2021)
8A Guide to Australasia’s Gambling Industries 2018/19 Australasian Gaming Council
Table 1-6 EGM cap arrangements in hotel venues by state/territory
Location Year legalised Cap arrangements
Taverns in the ACT are allowed a maximum of 2 Class B (draw
poker) gaming machines. Hotels with 12 or more units of
Australian Capital accommodation are allowed a maximum of 10 Class B gaming
1988
Territory machines, while hotels with less than 12 units of accommodation
are allowed a maximum of 2 Class B gaming machines.
New South Wales 1992 30 EGMs per venue.
Northern Territory 2014 20 EGMs per venue.
Queensland 2001 45 EGMs per venue.
South Australia 1994 40 EGMs per venue
Tasmania 1997 30 EGMs per venue.
Victoria 1992 105 EGMs per venue.
Western Australia N/A Not applicable.
Table 1-7 Estimated number of venues with EGMs in Australia (2018-19)
Location Hotels Clubs Casino(s) Other Total
Australian Capital Territory 44 5 45 0 50
New South Wales 45 1,390 1,102 1 2,493
Northern Territory 46 46 22 2 70
Queensland 47 713 399 4 1,116
South Australia 48 422 42 1 465
Tasmania 49 88 7 2 2 50 97
Victoria 51 260 236 1 497
Western Australia N/A N/A 1 1
Total 2,924 1,853 12 2 52 4,789
Note: Refers to operational gaming sites
Sources: ACT Gambling and Racing Commission, Northern Territory Director-General of Licensing, Queensland Government Office of Liquor
and Gaming Regulation, SA Department of Consumer and Business Services, Tasmanian Liquor and Gaming Commission, Victorian
Commission for Gambling and Liquor Regulation.
44
ACT Gambling and Racing Commission (2020) Annual Report 2018-19.
45
Queensland Government Statistician’s Office, Queensland Treasury (2021) Australian Gambling Statistics 1993-94 to 2018-19 (36th edition). Refer
to Australian Gambling Statistics Explanatory Notes for further information. Figures as at 30 June 2019.
46
Northern Territory Government (2019), Northern Territory Director-General of Licensing Annual Report 2018-19.
47
Queensland Government, Office of Liquor and Gaming Regulation (2020) 18-19 Statistical Report.
48
South Australian Department of Consumer and Business Services, Gaming Machine Licence Statistics 2018-19 Qtr 4.
49
Tasmanian Liquor and Gaming Commission (2019) Annual Report 2018-19, as at 30 June 2019.
50
Two Trans-Tasman Line Ferries are equipped with EGMs – please note that this figure is not included in the overall total
51
Victorian Commission for Gambling and Liquor Regulation (2019) Current Gaming Expenditure by Venue 2018-19. Figures as at 30 June 2019.
52
Please note the 2 TT Line Ferries that offer EGMs are not included in the national total of venues.
9Chapter 1 – Australia’s Gambling Environment
Table 1-8 Estimated number of venues with EGMs in Australia (2019-20)
Location Hotels Clubs Casino(s) Other Total
Australian Capital Territory 53 5 45 0 50
New South Wales 54 1,390 1,102 1 2,493
Northern Territory 55 46 22 2 70
Queensland 56 707 386 4 1,097
South Australia 57 451 44 1 496
Tasmania 58 87 6 2 2 59 95
Victoria 60 257 235 1 493
Western Australia N/A N/A 1 1
Total 2,943 1,840 12 2 61 4,795
Note: Refers to operational gaming sites
Sources: ACT Gambling and Racing Commission, Licencing NT, Queensland Government Office of Liquor and Gaming, SA Department of
Consumer and Business Services, Tasmanian Liquor and Gaming Commission, Victorian Commission for Gambling and Liquor Regulation.
Table 1-9 Estimated number of EGMs in Australia by venue type (2018-19) 62
Location Hotels Clubs Casino(s) Other Total
Australian Capital Territory 50 3,823 N/A 63 3,873
New South Wales 22,612 68,676 1,500 92,788
Northern Territory 624 717 983 2,324
Queensland 19,187 22,614 3,910 45,711
South Australia 10,907 1,223 834 12,964
Tasmania 2,218 127 1,221 36 64
3,566
Victoria 13,622 12,826 2,628 29,076
Western Australia N/A N/A 2,466 65
2,466
Total 69,220 110,006 13,542 36 66
192,768
Source: Queensland Government Statistician’s Office, Queensland Treasury (2021) Australian Gambling Statistics 1993-94 to 2018-19 (36th
edition). Refer to Australian Gambling Statistics Explanatory Notes for further information.
53
ACT Gambling and Racing Commission (2020) Annual Report 2019-20
54
Queensland Government Statistician’s Office, Queensland Treasury (2021) Australian Gambling Statistics 1993-94 to 2018-19 (36th edition). Refer
to Australian Gambling Statistics Explanatory Notes for further information. Figures as at 30 June 2019.
55
Northern Territory Government (2020) Licencing NT Annual Report 2019-20.
56
Queensland Government, Office of Liquor and Gaming Regulation (2020) 19-20 Statistical Report.
57
South Australian Department of Consumer and Business Services, Gaming Machine Licence Statistics 2019-20 Qtr 4.
58
Tasmanian Liquor and Gaming Commission (2020) Annual Report 2019-20, as at 30 June 2020.
59
Two Trans-Tasman Line Ferries are equipped with EGMs – please note that this figure is not included in the overall total
60
Victorian Commission for Gambling and Liquor Regulation (2020) Current Gaming Expenditure by Venue 2019-20. Figures as at 30 June 2020.
61
Please note the 2 TT Line Ferries that offer EGMs are not included in the national total of venues.
62
Operational EGMs as at 30 June 2019 as reported by Queensland Government Statistician’s Office, Queensland Treasury (2021) Australian
Gambling Statistics 1993-94 to 2018-19 (36th edition). Refer to Australian Gambling Statistics Explanatory Notes for further information.
63
The Casino (Electronic Gaming) Act 2017 has introduced legislation that would allow the casino to operate up to 200 EGMs, to be acquired through
the existing trading scheme. To date the casino does not offer EGMs.
64
This figure refers to the 36 EGMs available on Tasmania’s 2 Trans-Tasman Line Ferries. This figure is not included in the state total for Tasmanian
EGMs.
65
In December 2012 Crown Perth received approval for 500 additional gaming machines (to be phased in at 100 machines per year over five years)
and 100 additional tables (to be phased in at 25 tables per year over four years), which has taken the total number of gaming machines to a maximum
allowable of up to 2,500 in 2018.
66
Please note the 36 EGMs available on TT Line Ferries in Tasmania have not been included in the national total.
10A Guide to Australasia’s Gambling Industries 2018/19 Australasian Gaming Council
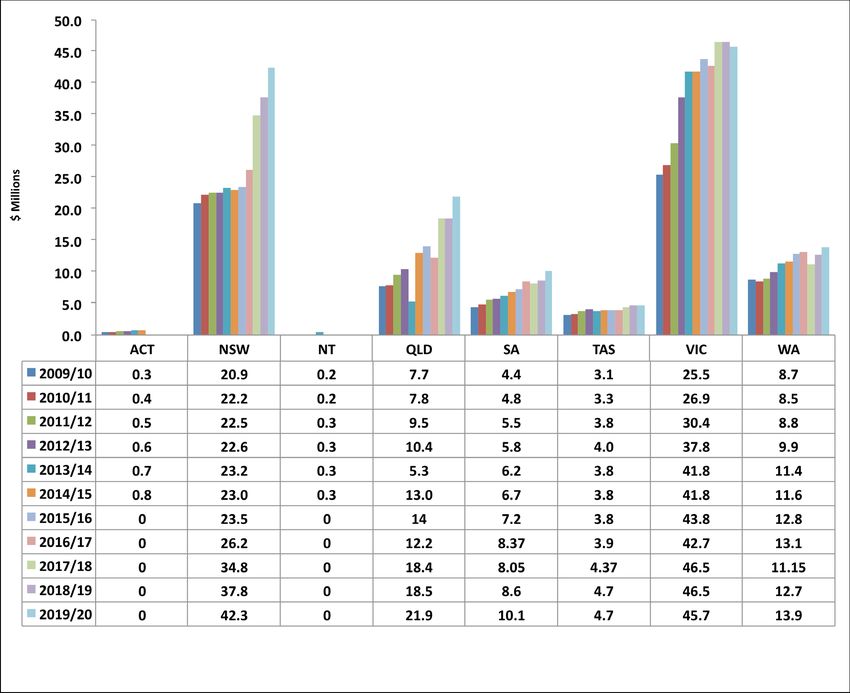
Figure 1-1 Estimated EGM distribution in Australia by venue type and state/territory (2018-19)
Australian EGM distribution by venue type Australian EGM distribution by state/territory
Source: Queensland Government Statistician’s Office, Queensland Treasury (2021) Australian Gambling Statistics 1993-94 to 2018-19 (36th
edition). Refer to Australian Gambling Statistics Explanatory Notes for further information.
Figure 1-2 Estimated EGM Distribution within Australian States/Territories (2018-19)
Australian Capital Territory New South Wales Northern Territory
Queensland South Australia Tasmania
Victoria Western Australia
11Chapter 1 – Australia’s Gambling Environment
Figure 1-3 Estimated EGMs per 1,000 adults (18+) in Australia (2018-19)
Source: Queensland Government Statistician’s Office, Queensland Treasury (2021) Australian Gambling Statistics 1993-94 to 2018-19 (36th
edition). Refer to Australian Gambling Statistics Explanatory Notes for further information.
Figure 1-4 Comparison of Estimated EGMs per 1,000 adults (18+) in Australia 2008-09
and 2018-19
Source: Queensland Government Statistician’s Office, Queensland Treasury (2021) Australian Gambling Statistics 1993-94 to 2018-19 (36th
edition). Refer to Australian Gambling Statistics Explanatory Notes for further information.
12A Guide to Australasia’s Gambling Industries 2018/19 Australasian Gaming Council
Keno
Keno is a game where a player wagers that their chosen numbers match any of the 20 numbers randomly
selected, via a computer system or a ball draw device, from a group of 80 numbers. Keno has a fixed pay
scale. The pay-out for each wager is established by rules and is independent of the total wagers made on the
game. 67
A computerised Keno system operates in clubs/hotels in a number of Australian jurisdictions and Keno is also
available at a number of casinos. In Western Australia the Crown Perth casino is the only Keno provider in
the state. Keno games may also be offered online or via lottery and TAB providers (e.g. SA Lotteries offers
Keno at its lottery outlets and at selected SA TAB outlets).
Table 1-10 Estimated number of Keno outlets (land-based) in Australia by state/territory
(2018-19)
Location Keno Outlets
Australian Capital Territory 34
New South Wales 1,766
Northern Territory 69 68
Queensland 1,049
South Australia 615 69
Tasmania 151 70
Victoria 539
Western Australia 1
Total 4,224
Source: Tabcorp Holdings Limited, Northern Territory Government - Licensing, Lotteries Commission of South Australia, Tasmanian
Government Department of Treasury and Finance, Crown Perth.
Table 1-11 Estimated number of Keno outlets (land-based) in Australia by state/territory
(2019-20)
Location Keno Outlets
Australian Capital Territory 34
New South Wales 1,768
Northern Territory 68 71
Queensland 1,047
South Australia 614 72
Tasmania 151 73
Victoria 540
Western Australia 1
Total 4,223
Source: Tabcorp Holdings Limited, Northern Territory Government - Licensing, Lotteries Commission of South Australia, Tasmanian
Government Department of Treasury and Finance, Crown Perth.
67
Queensland Government Statistician’s Office, Queensland Treasury (2021) Australian Gambling Statistics 1993-94 to 2018-19 (36th
edition). Refer to Australian Gambling Statistics Explanatory Notes for further information.
68
Northern Territory Government (2019) Director-General of Licensing Annual Report 2018-19.
69
Government of South Australia (2019) Lotteries Commission of South Australia: Information Supplementary to the Annual Report 2018-19.
70
Tasmanian Government, Department of Treasury and Finance, Liquor and Gaming, http://www.treasury.tas.gov.au/liquor-and-gaming/legislation-
and-data/gambling-industry-data/gaming-and-wagering-industry-data (status as accessed on 7 July 2021).
71
Northern Territory Government, (2020) Licensing NT Annual Report 2019-20.
72
Government of South Australia (2020) Lotteries Commission of South Australia 2019-20 Annual Report.
73
Tasmanian Government, Department of Treasury and Finance, Liquor and Gaming, http://www.treasury.tas.gov.au/liquor-and-gaming/legislation-
and-data/gambling-industry-data/gaming-and-wagering-industry-data (status as accessed on 7 July 2021).
13Chapter 1 – Australia’s Gambling Environment
Figure 1-5 Estimated Keno outlet distribution (land-based) in Australia by state/territory
2018-19 2019-20
Source: Tabcorp Holdings Limited, Northern Territory Government - Licensing, Lotteries Commission of South Australia, Tasmanian
Government Department of Treasury and Finance, Crown Perth.
14A Guide to Australasia’s Gambling Industries 2018/19 Australasian Gaming Council
Lotteries, Lotto and Instant Lotteries
Lotteries are conducted in Australia by both government and commercial operators although over recent years
there has been a trend towards the privatisation of previously state-run lottery operations with Western Australia
hosting the only remaining state-run lottery.
There are three components to a lottery; the purchase of a ticket, the draw and the prize. A person whose ticket
is selected in a lottery wins a prize based on the total amounts wagered after deduction of a set percentage by the
operator to cover costs.
Lottery operators may also conduct lotto, pools and instant lottery – and in some states, such as South Australia,
Keno.
Lotto players select any six numbers from 1-45 in anticipation that their chosen numbers will be among eight
subsequently drawn at random. Players win when their selected numbers match those randomly drawn in a set
combination.
There are a variety of lotto games available in Australia, some common product titles including Tattslotto, Gold
Lotto, Lotto, X-Lotto or Powerball (depending on the jurisdiction).
Instant lotteries are also known as scratch tickets, scratch-its or ‘scratchies’. Prizes in the instant lottery are paid
on a set return to player based on the number of tickets in a set, the cost to purchase a ticket and a set
percentage retained by the operator to cover costs.
Although lottery licensing regimes are state-based, Australia has a number of lottery games that may also be
operated as a bloc - where games are conducted nationally, pooling entries and winnings.
Lottery providers in Australia 74
Lottery, lotto and instant lottery tickets are commonly sold at stand-alone stores or through agencies – such as
newsagents and convenience outlets. Lottery products are also made available online and via mobile
applications.
Tatts Group Ltd was once the largest lottery operator in Australia with licences in all states and territories of
Australia, with the exception of Western Australia.
Following the combination of Tatts Group Ltd and Tabcorp Holdings Ltd on 22 December 2017, Tabcorp, under
the umbrella brand “the Lott”, is licenced to operate lotteries in the following states and territories: Australian
Capital Territory (in perpetuity) New South Wales (to 2050), the Northern Territory (to 2032), Queensland (to
2072), South Australia (to 2052), Tasmania (to 2025) 75 and Victoria (to 2028) 76.
The Lott was originally created in 2016 by Tatts Group to encompass all its jurisdictional lottery brands
(including Golden Casket, NSW Lotteries, Tatts, Tattslotto, SA Lotteries and Tatts NT) under a single entity.
The Lott’s game brands include TattsLotto, Powerball, Oz Lotto, Set for Life, Lucky Lotteries and Instant
Scratch-Its.
The West Australian lottery, trading as Lotterywest, is currently the only government operated lottery entity in
Australia and was initially constituted under the WA Lotteries (Control) Act 1954.
Lotterywest now operates under the WA Lotteries Commission Act 1990, with profits from the lottery operation
benefitting WA Health, Sports, the Arts and other eligible organisations. 77
74
Australian Competition Tribunal (2017) Proposed acquisition of Tatts Group Limited by Tabcorp Holdings Limited: Tatts Group Limited Statement, 8
March 2017.
75
Tasmanian lotteries operate under renewable five year permits.
76
Tabcorp Holdings Limited (2020) Annual Report 2020.
77
Lotterywest (2020) Lotterywest Annual Report 2019-20.
15Chapter 1 – Australia’s Gambling Environment
Table 1-12 Lottery/Instant lottery providers in Australia by state/territory 78
Location Licensee (Brand)
Australian Capital Territory Tabcorp Holdings Limited (The Lott – NSW Lotteries)
New South Wales Tabcorp Holdings Limited (The Lott – NSW Lotteries)
Northern Territory Tabcorp Holdings Limited (The Lott – Tattersall’s Sweeps & Golden Casket)
Queensland Tabcorp Holdings Limited (The Lott – Golden Casket)
South Australia Tabcorp Holdings Limited (The Lott – Tatts Lotteries SA)
Tasmania Tabcorp Holdings Limited (The Lott – Tattersall’s Sweeps & Golden Casket)
Victoria Tabcorp Holdings Limited (The Lott – Tattersall’s Sweeps)
Western Australia Lotterywest
Lottery Outlets in Australia (Land-Based)
Table 1-13 Estimated number of lottery/instant lottery outlets (land-based) in Australia
by state/territory (2018-19)
Location Lottery Outlets
Australian Capital Territory 47
New South Wales 1,267
Northern Territory 42
Queensland 904
South Australia 615
Tasmania 171
Victoria 792
Western Australia 505 79
Total 4,343
Source: Tabcorp Holdings Limited, Lotterywest.
Table 1-14 Estimated number of lottery/instant lottery outlets (land-based) in Australia
by state/territory (2019-20)
Location Lottery Outlets
Australian Capital Territory 48
New South Wales 1,297
Northern Territory 46
Queensland 911
South Australia 613
Tasmania 174
Victoria 790
Western Australia 501 80
Total 4,380
Source: Tabcorp Holdings Limited, Lotterywest.
78
On the 19 October 2016 the proposed combination of Tabcorp Holdings Ltd and Tatts Group Ltd was announced. On the 22nd December 2017
Tabcorp officially combined with Tatts Tabcorp Annual Reports 2017 and 2018.
79
Lotterywest (2019) Lotterywest Annual Report 2018-19.
80
Lotterywest (2020) Lotterywest Annual Report 2019-20.
16A Guide to Australasia’s Gambling Industries 2018/19 Australasian Gaming Council
Figure 1-6 Estimated lottery and instant lottery land-based outlet distribution in
Australia by state/territory
2018-19 2019-20
Source: Tabcorp Holdings Limited, Lotterywest
17Chapter 1 – Australia’s Gambling Environment
ONLINE/INTERACTIVE GAMBLING IN AUSTRALIA
Interactive gambling (also commonly termed Internet or online gambling) can be defined as gambling on
activities conducted via the Internet and is governed in Australia by the Interactive Gambling Act 2001 – which
is Commonwealth, rather than state/territory, legislation.
Interactive gambling is a broad term and can include various forms of remote gambling generally conducted
via digital means (such as digital television or mobile gambling platforms).
The Interactive Gambling Act 2001 prohibits the offer of interactive gambling services to Australians however it
contains an exception for wagering in the form of racing, sports-betting and lotteries.
The provision of internet casino gaming (such as poker, blackjack and roulette) and online EGM
gaming to Australians remains strictly prohibited.
The Federal Government Department of Communications 81 and the Australian Communications and Media
Authority (ACMA) provide information about online gambling services, prohibited content and resources for
consumers in Australia.
A list of licensed online wagering providers (TABs and corporate bookmakers), Betting Exchange and on-course
bookmakers, registered to offer their services online, is available on the website of the Australian
Communications and Media Authority (ACMA).
Table 1-15 Licensed Online Gambling Providers in Australia by Regulatory Jurisdiction 82
On Course Betting
Location Wagering 83 Lotteries Total
Bookmakers Exchange 84
Australian Capital Territory 1 0 0 1 2
New South Wales 4 31 0 1 36
Northern Territory 29 0 1 1 31
Queensland 1 0 0 1 2
South Australia 1 4 0 1 6
Tasmania 1 0 0 1 2
Victoria 2 35 0 1 38
Western Australia 1 21 0 1 23
Total 40 91 1 8 140
Source: Australian Communications and Media Authority (ACMA), Tabcorp Holdings Ltd, Lotterywest.
Figure 1-7 Legal Online Gambling Providers in Australia by Service Type 85
Source: Australian Communications and Media Authority (ACMA), Tabcorp Holdings Ltd, Lotterywest.
81
Federal Government Department of Infrastructure, Transport, Regional Development and Communications.
82
Current at July 2021.
83
Includes online TABs and corporate bookmakers.
84
The betting exchange Betfair moved to the Northern Territory licensing regime in September 2016 after betting exchange platforms were legalised
by the NT Government in April 2016.
85
Current at July 2021.
18A Guide to Australasia’s Gambling Industries 2018/19 Australasian Gaming Council
RACING AND WAGERING IN AUSTRALIA
Racing
Race betting on horse and greyhound races with bookmakers and totalisators, at racecourses and off-course
is legal in Australia. 86
Betting on the outcome of horse races was one of the first legal gambling activities in Australia. By the mid
1800’s horse racing was a popular recreational activity and the first Melbourne Cup was run in 1861. Today
the Australian thoroughbred racing industry is second in size only to that of the United States.
Thoroughbred Racing
Table 1-16 Number of thoroughbred race clubs, tracks, meetings and races in Australia
by state/territory (2018-19)
Location Clubs 87 Racetracks 88 Meetings Total Races
Australian Capital Territory 1 2 25 194
New South Wales 126 124 777 5,655
Northern Territory 5 5 73 417
Queensland 112 99 680 4,577
South Australia 25 25 186 1,423
Tasmania 4 5 71 544
Victoria 68 70 548 4,420
Western Australia 35 34 283 2,139
Total 376 364 2,643 19,369
Source: Racing Australia (2019) Fact Book 2018-19.
Table 1-17 Number of thoroughbred race clubs, tracks, meetings and races in Australia
by state/territory (2019-20)
Location Clubs 89 Racetracks 90 Meetings Total Races
Australian Capital Territory 1 2 23 184
New South Wales 129 97 729 5,313
Northern Territory 5 3 67 396
Queensland 117 81 620 4,401
South Australia 25 21 178 1,391
Tasmania 4 5 58 460
Victoria 69 67 540 4,367
Western Australia 37 31 270 2,097
Total 387 307 2,485 18,609
Source: Racing Australia (2020) Fact Book 2019-20.
86
Queensland Government Statistician’s Office, Queensland Treasury (2021) Australian Gambling Statistics 1993-94 to 2018-19 (36th edition).
87
Total reflects number of clubs that conducted a meeting during the season.
88
Total reflects number of unique racetracks that conducted a meeting during the season.
89
Total reflects number of clubs that conducted a meeting during the season.
90
Total reflects number of unique racetracks that conducted a meeting during the season.
19Chapter 1 – Australia’s Gambling Environment
Figure 1-8 Thoroughbred prize money ($ millions) in Australia by state/territory
(2009-10 to 2019-20)
Source: Racing Australia (2020) Fact Book 2019-20.
20A Guide to Australasia’s Gambling Industries 2018/19 Australasian Gaming Council
Harness Racing
Table 1-18 Number of harness racing tracks, meetings and races in Australia by
state/territory (2018-19) 91
Location Racetracks Meetings Races
Australian Capital Territory 92
N/A N/A N/A
New South Wales 31 489 4,017
Northern Territory 93
N/A N/A N/A
Queensland 5 283 2,397
South Australia 7 110 860
Tasmania 8 95 694
Victoria 27 440 3,867
Western Australia 12 259 2,233
Total 90 1,676 14,068
Source: Harness Racing Australia, Annual On-Line National Stakemoney Statistics, 2018-19.
Table 1-19 Number of harness racing tracks, meetings and races in Australia by
state/territory (2019-20) 94
Location Racetracks Meetings Races
Australian Capital Territory 95
N/A N/A N/A
New South Wales 25 478 3,874
Northern Territory 96 N/A N/A N/A
Queensland 4 292 2,518
South Australia 8 125 921
Tasmania 97
8 76 566
Victoria 27 445 3,689
Western Australia 12 259 2,152
Total 84 1,675 13,720
Source: Harness Racing Australia, Annual On-Line National Stakemoney Statistics, 2019-20.
91
Harness Racing Australia Annual Online Stakemoney Statistics. Please note that Harness Racing Australia provides stakemoney and racing
statistics on a tracks basis rather than on a clubs basis.
92
No information available.
93
No information available.
94
Harness Racing Australia Annual Online Stakemoney Statistics. Please note that Harness Racing Australia provides stakemoney and racing
statistics on a tracks basis rather than on a clubs basis.
95
No information available.
96
No information available.
97
Tasracing, after consultation with the Industry Group, have determined that Trotting races will no longer be included as part of the Tasmanian
program from 1 October 2021. https://tasracingcorporate.com.au/2021/04/01/trotting-to-cease-in-tasmania/ (accessed July 2021)
21Chapter 1 – Australia’s Gambling Environment
Figure 1-9 Harness racing total stakemoney ($ millions) in Australia by state/territory
(2009-10 to 2019-20)
Source: Harness Racing Australia, Annual On-Line National Stakemoney Statistics, 2019-20.
Greyhound Racing
Table 1-20 Number of greyhound racing clubs, meetings and races in Australia by
state/territory (2018-19)
Location Clubs Meetings Races 98
Australian Capital Territory 99 1 N/A N/A
New South Wales 33 1,104 10,913
Northern Territory 1 50 100 N/A
Queensland 6 559 5,623
South Australia 4 394 3,965
Tasmania 3 157 1,585
Victoria 11 1,189 N/A
Western Australia 3 315 3,487
Total 62 3,768 N/A
Source:, GRNSW Annual Report 2019, Darwin Greyhound Association, GRSA Annual Report 2019, Tasracing Annual Report 2019, Racing
Queensland Annual Report 2018-19, GRV Annual Report 2018-19, WAGRA Annual Report 2018-19.
98
Figures not available for the NT, SA and Victoria.
99
Figures not available for the ACT. The ACT Legislative Assembly passed laws to prohibit the racing and trialling of greyhounds in the ACT from 30
April 2018. The Canberra Greyhound Racing Club (CGRC) is still active using their Symonston track as a training facility but the club races at
Goulburn in NSW. https://www.act.gov.au/greyhound (accessed July 2021).
100
Approximate figure only. Darwin Greyhounds racing at Winnellie Park are conducted on a weekly basis.
22A Guide to Australasia’s Gambling Industries 2018/19 Australasian Gaming Council
Table 1-21 Number of greyhound racing clubs, meetings and races in Australia by
state/territory (2019-20)
Location Clubs Meetings Races 101
Australian Capital Territory 102 1 N/A N/A
New South Wales 32 1,103 10,890
Northern Territory 1 50 103 N/A
Queensland 6 575 5,893
South Australia 5 400 4,393
Tasmania 3 130 1,252
Victoria 13 1,198 N/A
Western Australia 3 328 3,731
Total 64 3,784 N/A
Source: GRNSW Annual Report 2020, Darwin Greyhound Association, GRSA Annual Report 2020, Tasracing Annual Report 2020, Racing
Queensland Annual Report 2019-20, GRV Annual Report 2019-20, WAGRA Annual Report 2019-20.
Figure 1-10 Greyhound racing stakemoney paid ($ millions) in Australia by state/territory
(2009-10 to 2019-20) 104
Source:,
GRNSW
Annual
Report 2020,
Darwin
Greyhound
Association,
GRSA
Annual
Report 2020,
Tasracing
Annual
Report
2020,
Racing Queensland Annual Report 2019-20, GRV Annual Report 2019-20, WAGRA Annual Report 2019-20.
101
Figures not available for the NT, SA and Victoria.
102
Figures not available for the ACT. The ACT Legislative Assembly passed laws to prohibit the racing and trialling of greyhounds in the ACT from 30
April 2018. The Canberra Greyhound Racing Club (CGRC) is still active using their Symonston track as a training facility but the club races at
Goulburn in NSW. https://www.act.gov.au/greyhound (accessed July 2021).
103
Approximate figure only. Darwin Greyhounds racing at Winnellie Park are conducted on a weekly basis.
104
Figures not available for the NT.
23Chapter 1 – Australia’s Gambling Environment
Wagering
Betting Exchanges
Betting exchanges offer a market place for gamblers to trade wagers and bet against each other (peer to peer
wagering platform) rather than against a bookmaker. The betting exchange then matches participant wagers
and earns revenue by charging a commission on net winning positions on a particular market.
Betfair is the only licensed betting exchange in Australia (licensed in Tasmania from November 2005 until
September 2016 and thereafter in the Northern Territory) and operates nationally.
Betfair customers pay a Betfair Commission. Each market bet on has a Market Base Rate. This rate is the
maximum percentage of winnings that are paid in commission and varies according to the market.
Bookmakers
On-course bookmakers
Wagering with bookmakers at a racetrack on horse and greyhound racing allows a player to wager any amount
above a set minimum and receive the odds at the time of making the wager. Those odds stand, irrespective of
whether the bookmaker alters the odds at a later time. Alterations to odds are calculated to reflect the weight of
betting on different race competitors. Bookmakers are licensed in each jurisdiction. 105
Off-course bookmakers
Wagering via off-course bookmakers allows a player to wager any amount above a set minimum and receive the
odds at the time of making the wager. Those odds stand, irrespective of whether the bookmaker alters the odds
at a later time. Bookmakers are licensed in each jurisdiction. 106
Table 1-22 Number of bookmakers in Australia (2015-16 to 2019-20)
Location 2015-16 2016-17 2017-18 2018-19 2019-20
Australian Capital Territory 10 9 7 7 5
New South Wales 157 144 129 129 120
Northern Territory 32 25 14 14 13
Queensland 72 77 77 77 75
South Australia 12 13 12 12 13
Tasmania 8 8 6 6 6
Victoria 180 163 162 162 145
Western Australia N/A 34 26 26 34
Total 471 473 433 433 411
Source: Racing Australia: Fact Book 2015-16, 2016-17,2017-18, 2018-19, 2019-20.
105
Queensland Government Statistician’s Office, Queensland Treasury (2021) Australian Gambling Statistics 1993-94 to 2018-19 (36th edition). Refer
to Australian Gambling Statistics Explanatory Notes for further information.
106
Queensland Government Statistician’s Office, Queensland Treasury (2021) Australian Gambling Statistics 1993-94 to 2018-19 (36th edition). Refer
to Australian Gambling Statistics Explanatory Notes for further information.
24A Guide to Australasia’s Gambling Industries 2018/19 Australasian Gaming Council
Figure 1-11 Estimated distribution of bookmakers in Australia
2018-19 2019-20
Source: Racing Australia: Fact Book 2018-19, 2019-20.
Sports betting
Sports betting refers to wagering on all types of local, national or international sporting activities (other than the
established forms of horse and greyhound racing), whether on or off-course, in person, by telephone or via the
internet. Bets may be laid on a variety of sporting events domestically and/or overseas. 107
In December 1992 the Northern Territory approved Australia’s first sports bookmaker, Centrebet in Alice Springs.
Centrebet commenced the provision of internet wagering in August 1996.
Today the Northern Territory hosts the majority of online sports betting providers in Australia with corporate
bookmakers allowed to trade 24/7.
Sports-betting is an area of significant growth in the Australian gambling environment and has seen increased
spend over the past decade as well as an ongoing shift from traditional offline betting channels to online channels
(internet, mobile, tablet).
Table 1-23 Australian Wagering Turnover (TAB and Bookmaker) By Code (2016-17 to 2019-20)
2016-17 % 2017-18 % 2018-19 % 2019-20 %
$ mill $mill $mill $mill
Thoroughbred Racing 18,063.53 55 19,554.22 55 20,944.19 55 21,087.71 51
Harness Racing 1,666.95 5 1,644.54 5 1,468.52 4 3,447.67 8
Greyhound Racing 3,200.56 10 3,265.41 9 3,136.37 8 6,997.80 17
Sports Betting 9,666.81 30 11,230.49 31 12,359.03 33 10,160.39 24
Total 32,597.85 100 35,694.67 100 37,908.11 100 41,693.57 100
Source: Racing Australia: Fact Book 2016-17, 2017-18, 2018-19, 2019-20.
107
Queensland Government Statistician’s Office, Queensland Treasury (2021) Australian Gambling Statistics 1993-94 to 2018-19 (36th edition).
25You can also read