GEANT4 simulation of a new range verification method using delayed γ spectroscopy of a 92Mo marker
←
→
Page content transcription
If your browser does not render page correctly, please read the page content below
GEANT4 simulation of a new range verification
                                                 method using delayed γ spectroscopy of a 92Mo
arXiv:2002.00543v1 [physics.med-ph] 3 Feb 2020

                                                 marker
                                                               E Kasanda1 , C Burbadge1 , V Bildstein1 , J Turko1 , A Spyrou2,3 ,
                                                               C Höhr4,5 and D Mücher1,4
                                                               1
                                                                 Department of Physics, University of Guelph, 50 Stone Rd E, Guelph, Ontario,
                                                               Canada N1G 2W1
                                                               2
                                                                 National Superconducting Cyclotron Laboratory, Michigan State University, East
                                                               Lansing, Michigan 48824, USA
                                                               3
                                                                 Department of Physics and Astronomy, Michigan State University, East Lansing,
                                                               Michigan 48824, USA
                                                               4
                                                                 TRIUMF, 4004 Wesbrook Mall, Vancouver, British Columbia, Canada V6T 2A3
                                                               5
                                                                 Department of Physics and Astronomy, University of Victoria, 3800 Finnerty Road,
                                                               Victoria, British Columbia, Canada, V8P 5C2
                                                               E-mail: dmuecher@uoguelph.ca

                                                               November 2019

                                                               Abstract. In this work, we propose a novel technique for in-vivo proton therapy
                                                               range verification. This technique makes use of a small hadron tumour marker, 92 Mo,
                                                               implanted at a short known distance from the clinical treatment volume. Signals emit-
                                                               ted from the marker during treatment can provide a direct measurement of the proton
                                                               beam energy at the marker’s position. Fusion-evaporation reactions between the pro-
                                                               ton beam and marker nucleus result in the emission of delayed characteristic γ rays,
                                                               which are detected off-beam for an improved signal-to-noise ratio. In order to deter-
                                                               mine the viability of this technique and to establish an experimental setup for future
                                                               work, the Monte Carlo package GEANT4 was used in combination with ROOT to
                                                               simulate a treatment scenario with the new method outlined in this work. These sim-
                                                               ulations show that analyzing the intensity of delayed γ rays produced from competing
                                                               reactions yields a precise measurement of the range of the proton beam relative to the
                                                               marker, with sub-millimetre uncertainty.

                                                               Keywords: proton therapy, range verification, GEANT4, simulation, tumour marker,
                                                               γ spectroscopy

                                                 1. Introduction

                                                 Despite the steady decline in cancer-related death rates for the past 30 years, cancer
                                                 remains the leading cause of death in the developed world, affecting nearly 1 in 2 people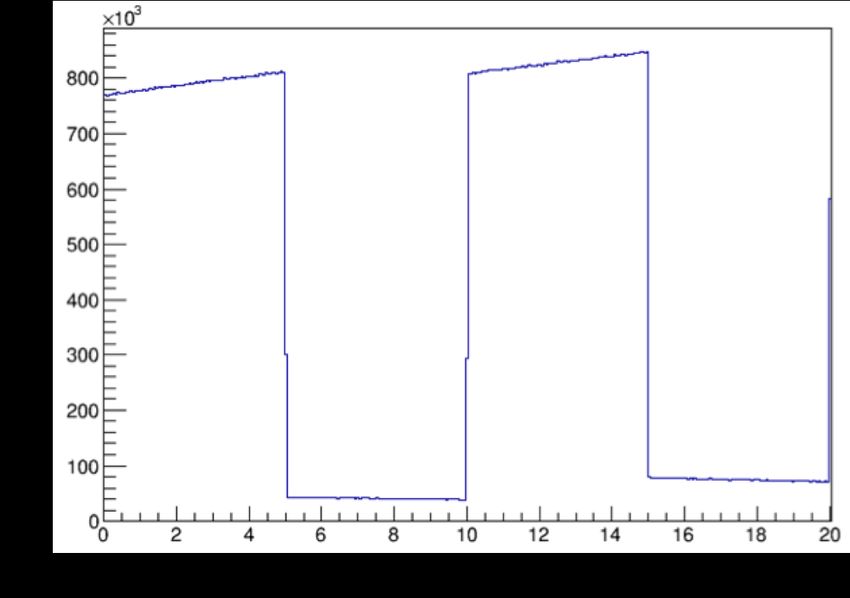
GEANT4 simulations of HTM RV                                                            2

in their lifetime (Canadian Cancer Statistics Advisory Committee 2017). Approximately
50% of all cancer patients undergo radiation therapy as a part of their treatment
(Barton et al. 2014, Tyldesley et al. 2011), often in combination with other methods
such as surgery and chemotherapy. In the past few decades, proton therapy (PT) has
gained popularity as a method of radiation therapy because of the advantage it offers
in terms of dose distribution compared to conventional radiation therapy (Knopf &
Lomax 2013, McGowan et al. 2013, Wilson 1946).
      Conventional radiation treatment methods make use of γ rays to deposit an ionizing
radiation dose to a targeted region of tissue. Exponential attenuation of the photons
delivered through this type of treatment results in a significant dose being delivered to
healthy tissue along the beam path, both before and after the targeted region. Modern
techniques using intensity modulation and multiple beam angles allow treatment plans
to compensate for this attenuation and minimize dose to healthy tissue. For heavy
charged particles like protons, the dose deposition in matter is fundamentally different
from that of photons (McGowan et al. 2013, Wilson 1946). The stopping power (energy
absorbed per unit length) of tissue is described by the Bethe equation (Bethe 1930),
which states that the stopping power for a proton is approximately inversely proportional
to the proton’s energy (Wilson 1946). Thus, protons deposit very little entry dose
in tissue. Instead, the stopping power increases non-linearly with depth, reaching its
maximum value near the end of the proton track. This results in an extremely sharp
dose deposition profile with no exit dose (McGowan et al. 2013, Wilson 1946). The
region of maximal dose deposition is referred to as the Bragg Peak, and its depth in
tissue is dependent on the initial energy of the proton beam and the proton stopping
power of the tissue (Wilson 1946). The highly localized nature of this dose profile
allows for precise irradiation of tumours with minimal dose delivered to the healthy
tissue surrounding the targeted volume (Knopf & Lomax 2013). Furthermore, the high
linear energy transfer (LET) of protons has been shown to result in an increased relative
biological effectiveness (RBE) when compared with low-LET radiation such as photons
(Ilicic et al. 2018). In combination, these factors make PT a promising method for
the treatment of malignant tumours. It has been shown that PT has the potential
to provide a highly localized and effective dose delivery with sub-millimetre precision
(Paganetti 2012).
      Since the majority of the proton dose is deposited in the span of a few millimetres,
it is crucial that the range of the beam inside the patient is precisely known in order
to avoid accidental irradiation of healthy tissue with the Bragg Peak and, consequently,
underdosing of the clinical target volume (CTV) (McGowan et al. 2013). Range
verification (RV) is an essential tool for characterizing the dose being delivered to
the CTV and surrounding tissue during fraction delivery. As it stands, uncertainty
in patient motion, tissue stopping powers and biological effectiveness contribute to
an overall range uncertainty on the order of millimetres (McGowan et al. 2013). To
account for this, current PT planning target volumes (PTVs) include a safety margin of
several millimetres, increasing the irradiated volume of healthy tissue in order to avoid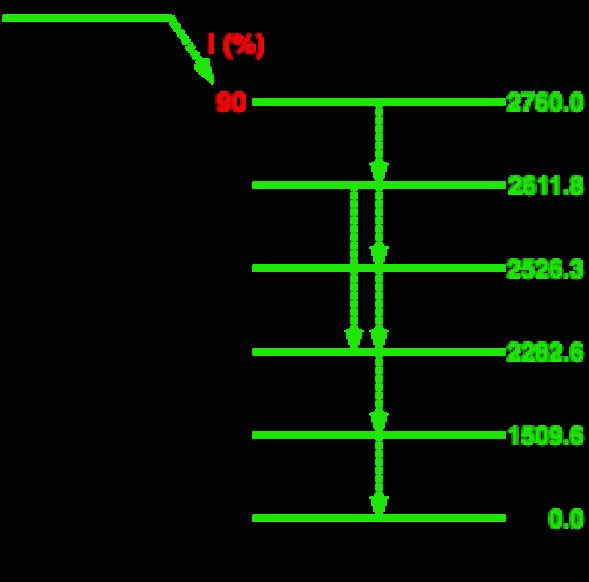
GEANT4 simulations of HTM RV                                                              3

underdosing the CTV (Knopf & Lomax 2013).
      While in principle, the lack of exit dose in PT could allow tumours to be targeted
near organs at risk (OARs) (McGowan et al. 2013), the range uncertainties are greater
than in conventional therapy, which increases the risk of irradiating nearby OARs with
the distal edge of the Bragg peak. To mitigate the risk of second malignancies, the
axial alignment of the proton beam with the OAR is sometimes avoided, preferentially
delivering dose to these tumours with the lateral edge of the beam as opposed to the
much sharper distal edge (Verburg & Seco 2014).
      Without an exit dose to be measured for dose verification purposes, most current
RV approaches in PT rely on the measurement of γ rays produced from proton activation
of tissue (Parodi et al. 2007, Parodi & Polf 2018, Paganetti & El Fakhri 2015).
      One of these approaches makes use of β-delayed positron annihilation events, which
are responsible for the production of high intensities of 511 keV γ rays in tissue along
the beam path (Parodi & Polf 2018, Tobias et al. 1977). These γ rays can be measured
with PET detectors to produce a spatial reconstruction of the beam’s path in the
patient. However, because protons primarily deposit energy through electromagnetic
interactions, the measured PET activation is not directly correlated with the dose
distribution and must be compared to a Monte Carlo (MC) simulation in order to
fully characterize the beam’s range inside the patient (Parodi & Polf 2018). Since PET
activation is not specific to any particular nuclear reaction, this MC simulation must
take into consideration the precise tissue composition of the patient, obtained through
a CT scan (Parodi et al. 2005). Uncertainties in the conversion of CT Hounsfield units
(HU) to tissue composition and scarcity of experimental data for isotope production
cross sections in a thick target both contribute to inaccuracies in the MC simulation
(Paganetti & El Fakhri 2015). When performed offline, PET RV measurements are
taken several minutes after fraction delivery. It has been shown that this time delay
can impact the range precision that can be achieved through this method due to the
decay of a significant portion of the positron emitters before the PET scan is performed
(Paganetti & El Fakhri 2015). To compensate for this, long acquisition times, typically
on the order of 20-30 minutes, are generally required in order to obtain sufficient
statistics for accurate range and dose calculation (Parodi et al. 2007). This long time
delay leaves room for the blurring effects of biological decay and washout, which are
difficult to predict due to the varying perfusion of different tissues (Parodi et al. 2007).
Online PET is an alternative RV method in which the PET scanner is located inside
the treatment room, incorporated with the proton beam “nozzle” and acquires data
during fraction delivery in order to minimize the effects of the time delay present in
offline measurements. High background γ rates during fraction delivery and limited
angle coverage due to spatial constraints are the main limiting factors of this method
(Paganetti & El Fakhri 2015, Parodi & Polf 2018). The spatial resolution of a PET
scanner is fundamentally limited by acollinearity and positron range, such that the
theoretical limit of the spatial resolution for PET is a 1.83 mm FWHM (Moses 2011).
Typical clinical uncertainties in PET RV are on the order of 3-5 mm (Paganetti &
GEANT4 simulations of HTM RV 4
El Fakhri 2015).
Prompt γ (PG) RV makes use of the multitude of prompt characteristic γ rays
which are emitted from nuclear interactions between the proton beam and tissue along
the beam path. Due to the short time scale in which they are emitted, the acquisition
time for this method is much shorter than that of PET, so the PG method has the
potential to provide immediate feedback on treatment quality. The prompt aspect of
the measurement allows PG RV to minimize the effects of biological washout and signal
decay that must be considered in offline PET RV. In addition, the use of characteristic
γ rays as opposed to annihilation γ rays minimizes the need to precisely estimate tissue
composition (Verburg & Seco 2014). Several different imaging configurations have been
investigated for PG RV. One basic setup makes use of passive collimation to ensure only
γ rays from a small region of the tissue are measured. Due to the high energy (up to
6 MeV) of the γ rays being emitted at high intensities, it is crucial that the collimator
is thick enough to sufficiently attenuate γ rays originating from outside the region of
interest (Verburg & Seco 2014). During treatment, the detector may either be focused
on one spatial region, or scan the range of the beam in the patient. The resulting energy
and timing distribution of the γ rays produced during treatment is then compared to
MC simulations in order to reconstruct the absolute range of the beam in a uniform
water-equivalent phantom with an uncertainty of 1.0-1.4 mm (Verburg & Seco 2014).
More recently, investigations of actively-collimated PG RV have been making use of a
Compton camera, whose position-sensitive detectors are arranged such that the γ-ray
angle of incidence can be reconstructed in 3D without the need of a collimator (Hueso-
González et al. 2016). The abundance of γ rays measured by a Compton camera can then
be mapped as a function of their origin in the tissue in order to detect shifts in the range
of the proton beam as small as 2 mm (Draeger et al. 2018). This reconstruction is very
complex and computationally intensive, and requires high statistics. In addition, the
demanding energy, timing, and spatial resolution requirements of the Compton camera
detectors make it a costly investment (Draeger et al. 2018). As with PET, all current
PG RV methods rely on comparison to MC simulations for range and dose verification.
In this work, we propose a novel technique for in-vivo PT RV, hereafter referred to as
HTM RV, that can be used in clinical practice. This technique involves the implantation
of a small Hadron Tumour Marker (HTM) in the beam path, at a short known distance
from the CTV. Signals emitted from the HTM during treatment can provide a direct
measurement of the proton beam energy at the marker’s position. The proximity of the
HTM interaction site to the end of the beam’s range allows for a higher-precision range
calculation than could be achieved by measuring the beam energy outside the patient.
An HTM is a small metal marker composed of materials with a favourable response
to proton activation. Factors considered in choosing a suitable HTM include the
magnitude and energy dependence of the nuclear reaction cross sections, the half lives
of the nuclei produced from these reactions, and the γ-ray energies emitted in the
decay of these nuclei, as well as their respective intensities. Other relevant factors from
a clinical perspective are the option to use natural materials as markers instead ofGEANT4 simulations of HTM RV 5
isotopically enriched ones, as well as biological and long-term radiation toxicity of the
marker. However, the primary focus of this work is to investigate the feasibility of this
method with regard to accuracy and sensitivity. Biological aspects will be discussed in
forthcoming publications.
Figure 1: Plot of select fusion-evaporation reaction cross sections for 92 Mo as a function
of incident proton energy, obtained using TALYS software.
Fusion-evaporation reactions between the proton beam and the HTM during
fraction delivery result in the production of stable and unstable nuclei. The marker
isotope 92 Mo was selected as a HTM candidate due to its response to proton activation.
Figure 1 shows a plot of different reaction cross sections for 92 Mo as a function of
incident proton energy, obtained using the TALYS software (version 1.8) (Koning &
Rochman 2012). The cross sections for competing reactions tend to be maximized at
different proton energies. This means that the intensity of the characteristic γ rays of
interest is correlated with the energy of the proton beam, and that the relative intensity
of γ rays produced from competing reactions can be used as a measurement of beam
energy at the position of the marker, without the need to refer to MC simulations. An
important advantage of measuring the proton energy at the marker location is that the
heterogeneity of tissue stopping powers upstream of the marker no longer contributes
to the range uncertainty, and the remaining range of the beam after the marker can
be estimated with minimal uncertainty. The measurement of these γ rays allows for
sensitive in-vivo RV for PT fraction delivery.
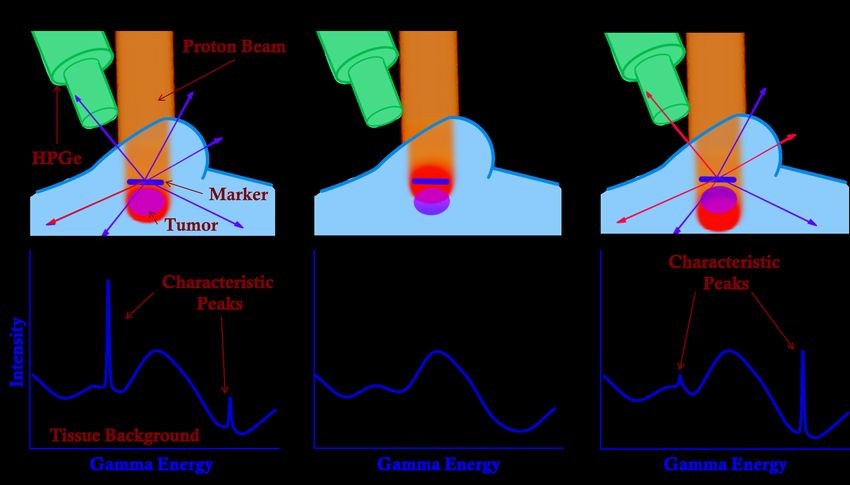
Figure 2 illustrates this concept in three different treatment scenarios. The main
advantages of this method are the energy-dependent cross sections of the fusion-
evaporation channels, and the specificity of γ rays produced through these interactions
to the marker isotope.
At proton energies near the Bragg Peak, 92 Mo most commonly undergoes one of
two reactions, as illustrated in Figure 3.
The first, 92 Mo(p,n)92 Tc, results in the emission of a 773.0(3) keV γ ray through
the β-decay of 92 Tc with a half life of 4.25(15) minutes (Baglin 2012). The second
reaction of interest is 92 Mo(p,pn)91m Mo. 91 Mo has a low-lying isomeric state that isGEANT4 simulations of HTM RV 6
Figure 2: Illustration of proton dose profile and corresponding γ spectrum achieved in
(a) an ideal treatment scenario, (b) a treatment scenario in which the beam falls short
of the expected range, such that no γ-ray line is observed as the proton energy incident
on the HTM is below the threshold for fusion-evaporation reactions, and (c) a treatment
scenario in which the the beam stops beyond the expected range, such that a different
ratio of the two characteristic γ lines is observed.
(a) (b) (c)
Figure 3: (a) Key low-energy reaction pathways from 92 Mo proton activation. In green,
the (p,n) path into 92 Tc is shown with the solid arrow, and the subsequent β-decay into
92
Mo is indicated with the dotted arrow. In blue, the (p,pn) path into 91 Mo is shown.
A partial level scheme for the decay of 92 Tc is shown in (b), indicating the energies
of relevant γ rays (black) and levels (green) in keV. The (p,pn) reaction populates an
isomeric state of 91 Mo, whose partial level scheme is similarly depicted in (c).GEANT4 simulations of HTM RV 7
populated through this reaction, and results in the emission of a 652.9(1) keV γ ray
with a half life of 64.6(6) seconds (Baglin 2013). The characteristic γ rays from these
two reactions are suitable indicators of marker activation because they are emitted with
high intensity, and the decays responsible for their emission have half lives on the scale
of typical fraction delivery times.
The clinical feasibility of HTM RV strongly depends on the half lives of these γ
rays. Due to the high intensity of prompt γ rays present during beam delivery, the
ability to measure the decay of the HTM reaction products after the beam has been
switched off is a powerful background-suppression tool. By periodic toggling the beam
during treatment in order to measure the signal from the marker once the prompt γ
background has subsided, a greatly amplified SNR can be achieved. In addition, one
advantage of the much lower γ rates of offline spectroscopy is the possibility of using
high purity Germanium (HPGe) detectors, which offer superior energy resolution on the
order of 0.2% at 1.173 MeV (Szymaska et al. 2008).
Although using γ spectroscopy for RV has been explored before, the concept of
looking at delayed characteristic γ rays from fusion-evaporation reactions in PT is a
new method that has not yet been investigated to our knowledge. Unlike PET and PG
RV, the beam energy measured using HTM RV is model-independent as it does not rely
on comparison to MC simulations.
2. Methods
In order to determine the feasibility of HTM RV, we make use of GEANT4 (v. 10.02), a
C++ -based platform for simulating the passage of particles through matter (Agostinelli
et al. 2002). The simulation geometry used in this work is illustrated in Figure 4.
The target geometry consists of an outer box, containing a 100 µm-thick marker
region. The box is composed of Poly(methyl methacrylate) (PMMA), which is included
in the GEANT4 material database as “G4 PLEXIGLASS”. PMMA is often used in
radiological phantoms because of its similar density, composition, and stopping power
to human soft tissue (Lourenço et al. 2017). Its purpose in this simulation geometry is
to provide a γ background similar to what would be expected if the marker was located
inside a the soft tissue of a phantom or a patient. The marker region is composed of
a custom isotope having the nuclear properties of 92 Mo (Z = 42, A = 92). A material
density of 10.28 gcm−3 was used, to approximate the density of naturally-abundant
molybdenum. The depth of the marker within the box was selected to be comparable
to that of a typical breast tumour (Wang et al. 2014). 76 MeV protons were generated
in vacuum (“G4 Galactic”) outside the target as primary events, and given momentum
in the direction of the target geometry. This energy was selected such that the protons
would be fully stopped inside the target, between the marker region and the far edge of
the PMMA box.
A modular physics list was created, using QGSP BIC as a base due to its
applicability in the study of primary protons whose energy is below 10 GeV. In addition,GEANT4 simulations of HTM RV 8
Figure 4: Sketch of 2D cross section of 3D simulation geometry. The tissue-equivalent
box is indicated in blue, and the marker region is indicated in orange. The primary
protons are generated outside the box, in vacuum. Here, the value MCD represents the
marker centre depth, which is varied in order to simulate different treatment scenarios.
the G4RadioactiveDecayPhysics constructor was added in order to accurately simulate
the decay of long-lived reaction products, and the G4HadronPhysicsQGSP BIC AllHP
constructor was included for the implementation of TENDL cross sections in the
simulation. The TENDL 1.3.2 library for proton-capture cross sections (Koning &
Rochman 2012) was used as it corresponded more closely to experimental results than
the default cross sections (Burbadge et al. 2019). In addition, the emission rate of the
characteristic γ ray of interest from 91m Mo was added artificially. When a 91 Mo nucleus
is detected as a reaction product, there is a 10% probability that a γ ray entry is created
with an energy of 652.9(1) keV and an exponentially distributed randomized time stamp
with a half life of 64.6 seconds. The probability of such a γ ray being created was set
to 10% in order to reproduce the relative population of 653 keV γ rays to 773 keV γ
in a similar experimental setup (Burbadge et al. 2019). This value is consistent with
the results of the aforementioned TALYS calculation, which shows that, at 22.75 MeV,
20.7% of the total (p,pn) reactions result in the production of the isomeric state, 91m Mo.
Combining this information with the γ intensities found on NNDC (Baglin 2013), we
calculate a maximum emission rate of 10.01(21)% of the 652.9(7) keV γ ray in a (p,pn)
reaction. Similarly, the average relative emission rate between 20 MeV and 30 MeV was
calculated to be 9.1(13)%.
To simplify the simulations, a realistic beam energy spread and spatial distribution,
as well as detector efficiencies and resolution, were not included. Instead, all γ rays
are recorded upon exiting the box, and detector resolution and efficiency are applied
during the data analysis using ROOT 6.10.8 (Brun & Rademakers 1997). The GEANT4
simulation tracked the instantaneous passage of 108 primary protons through the target
geometry, recording the energy and timing of all γ rays exiting the box. Based on
an intrinsic detector efficiency of 10%, and a geometric efficiency of 33%, the number
of primaries simulated produce statistics that are equivalent to those of a 2.7 Gy
fraction dose delivered with a pencil beam. In order to more accurately portray beam
intensities, a basic beam timing microstructure was implemented post-simulation inGEANT4 simulations of HTM RV 9
ROOT to approximate a treatment beam current. In order to simulate pulsed-beam
delivery, a beam timing macrostructure was also implemented in ROOT, allowing for
the periodicity of the beam pulses to be selected post-simulation.
3. Simulation Results
Figure 5 shows the simulated γ-ray intensity pattern observed using a periodic beam
macrostructure of 5 seconds on-beam, followed by 5 seconds off-beam, at a beam current
of 0.75 nA with 108 events.
Figure 5: Simulation results of γ intensity as a function of time for periodic beam
switching at 5 second intervals. This illustrates the immediacy and magnitude of the
reduction in background rates.
The majority of the γ-ray and neutron background is produced on-beam. By
periodically stopping the beam and performing γ-ray spectroscopy off-beam, the
SNR of the characteristic peaks can be drastically improved compared to on-beam
measurements. Due to the longer rise and decay times of their pulse signals, HPGe
detectors are more susceptible to large dead times at high γ-ray rates (above 100kHz)
(Twomey 2003). Thus, the reduction in γ-ray count rates achieved by measuring off-
beam is a crucial aspect of this RV method. The impact of the background reduction
in the off-beam window on the resulting simulated γ spectrum can be seen in Figures
6 and 7. Figure 7 shows the energy region containing the two peaks of interest for this
method. The 773 keV γ ray from the decay of 92 Tc, and the 653 keV γ ray from the
decay of 91m Mo. These gamma rays were selected as they have large branching ratios,
and are thus emitted at high intensities from the HTM. In addition, the similar energies
of these two gamma rays reduces the impact of energy-dependent detector efficiency and
tissue absorption on the measurement accuracy.
Here, a comparison of the simulated γ-ray spectra obtained by measuring both
prompt and delayed γ rays, as opposed to measuring only in the off-beam time window
is shown. The simulated data replicates the timing and energy resolution of a HPGeGEANT4 simulations of HTM RV 10 Figure 6: Simulated γ spectrum for 108 protons impinging on 92 Mo foil embedded in PMMA. The blue line shows a histogram of all γ rays produced, while the red line shows a histogram of only the γ rays produced in the off-beam window. The peaks labelled in violet correspond to the characteristic γ rays produced as a result of the decay of 92 Tc, which has a half life of 4.25 minutes, and the peak labelled in green is produced through the γ decay of 91m Mo. The peaks labelled in grey correspond to prominent background peaks from the tissue-equivalent plastic (PMMA). A Gaussian smear replicating an energy resolution of 0.2% was applied to these spectra. Figure 7: Same plot as depicted in Figure 6, focused on the region containing peaks of interest. detector. The result is a dramatic decrease in tissue background, and a significant increase in the SNR for the γ rays of interest.
GEANT4 simulations of HTM RV                                                            11

      Primary protons of various energies were generated and impinged on a 100 µm-thick
foil of 92 Mo in vacuum (G4 Galactic). In this low-background simulation environment,
the intensity of the γ rays of interest emitted from the marker were extracted with
high precision, with no gaussian energy smear, to produce a calibration curve. The γ-
ray intensities for the two peaks of interest were plotted in Figure 8a as a function
of the mean proton energy inside the marker region. Figure 8b depicts the same
simulation data, but the γ-ray intensity is expressed as a ratio of the peak integrals
of the 652.9(1) keV peak to the 773.0(3) keV peak, RMo . Expressing the γ-ray intensity
as RMo makes the curve shown in figure 8 independent of dose, beam intensity, and
deadtime. The simulation results depicted in Figure 8 were obtained without any
Gaussian smear applied to the time and energy of the γ rays, nor any energy-dependent
detector efficiency considerations. However, since the γ rays of interest are very close
in energy, the energy dependence of the energy resolution has a minimal impact on
calculations.

                   (a)                                               (b)

Figure 8: (a) Simulated counts of γ rays of interest (773.0(3) keV and 652.9(1) keV) as
a function of average proton energy in the marker. (b) Same data, with y-axis expressed
as a ratio of the intensity of the 652.9(1) keV peak to that of the 773.0(3) keV peak,
RMo . Note that as this data is directly extracted from the simulation, with no energy
resolution applied, error bars have not been included.

     In order to relate RMo to the range of the beam, the relationship between a proton’s
energy and its remaining range in tissue must be established. For this purpose, we make
use of a numerical solution to the velocity profile of protons developed by Martinez et al.
(2019).
     The numerical solution was applied to simulation data depicting depth of a proton
in PMMA as a function of its energy at that depth, yielding the plot shown in Figure
9a.
     Simulations of a 76 MeV proton beam impinging on an HTM embedded in PMMA
were performed at various marker depths within the plastic in order to characterize the
range sensitivity of HTM RV. In all simulations, 108 proton events were generated and
the reaction products were allowed to decay for 600 seconds. The simulated ratio, RMo ,
GEANT4 simulations of HTM RV 12
(a) (b)
was compared to Figure 9b in order to extract the remaining range of the proton beam
in the PMMA. It should be noted that due to the limited range of energies for which a
non-zero ratio can be measured, the projection of RMo alone onto the range axis does
not provide a unique solution. However, if the HTM is positioned in the most sensitive
region, approximately 6 mm from the distal edge of the beam, then a typical treatment
precision (Paganetti & El Fakhri 2015) should be sufficient to avoid any ambiguity in
the extracted range for a given RMo .
The “true remaining range” of the proton beam was determined by plotting the
average depth after the HTM centre at which simulated protons come to rest, then
extracting the mean by fitting the resulting Gaussian distribution, as shown in Figure
9.
Figure 9: Example histogram of depth in PMMA at which 76 MeV protons come to
rest. A Gaussian fit was used in order to extract the mean of this distribution.
The extracted remaining range from Figure 9b was compared to the true remainingGEANT4 simulations of HTM RV 13 range in Figure 10. The data plotted in red show the same results for delivery of only 0.27 Gy instead of 2.7 Gy, with the aforementioned detector efficiencies. Using a thicker marker would result improved peak SNR at the cost of a reduced precision in range due to the larger spread of proton energies interacting with the marker. Figure 10: (top) Beam range calculated using simulated RMo , compared to true range of protons after the marker, extracted from simulation data. The straight line indicates the expected value for these data points, i.e. the ideal case in which the true range and extracted range are identical. (bottom) Difference between calculated and expected values for proton range. The standard deviations of these data sets from expectations are σ2.7Gy = 0.32 mm, and σ0.27Gy = 0.84 mm. 4. Discussion The results of this feasibility study have shown that the intensity ratio of the competing reactions of interest, RMo , is a highly sensitive indicator of proton energy inside the marker. The RMo extracted from this method can be directly translated to the beams range relative to the marker as a form of in-vivo RV in real time, without the need to refer to MC simulations. The simulation results obtained here suggest that an SNR of up to 38(6) can be achieved for the 773.0(3) keV peak in the delayed-γ spectrum with an energy resolution typical for HPGe detectors. Due to the photon-energy dependence of the linear absorption coefficient of tissue, the selection of γ rays with similar energies is favourable for this analysis in order to minimize discrepancies. For a scenario in which the tumour is located deep inside the tissue, literature values (Salehi et al. 2015, Biswas et al. 2016) suggest that for the same number of emitted 600 keV and 800 keV γ rays passing through 20(1) cm of soft tissue, an uncertainty of 0.85% can be expected in RMo . This uncertainty is dependent to the depth of the marker inside the tissue and would thus be much smaller for tumours located closer to the surface of the skin.
GEANT4 simulations of HTM RV                                                             14

     The simulation results expressed in Figure 10 indicate that HTM RV provides a
precise reconstruction of the range of the beam with no offset. As indicated by the two
plotted data sets, the range in which this method will offer accurate range verification
will be dependent on the SNR that can be achieved clinically. For the setup investigated
in this work, the placement of the marker within the tissue that will offer the most
sensitive response is approximately 4.5 mm in front of the point at which the beam
should be stopped. At this position, and with the statistics used to generate the data
points representing the full fraction dose of 2.7 Gy, the marker’s response to proton
activation will allow for direct measurement of the difference in the beam’s range from
its target range, up to a difference of 2 mm in either direction. Outside this range, the
reduced cross section in one of the two peaks of interest results in larger uncertainties in
the reconstructed range. Since typical clinical precision of the range is generally under
2 mm, the application of HTM RV in the region of highest sensitivity can provide a
unique measurement of the beam’s range, with no degeneracy within the range of beam
energies expected. In addition, the reduction in beam energy induced by the passage of
the proton beam through a 100 µm HTM is minimal and can be well characterized to
reduce impact on fraction delivery.
     The beam pulsing technique utilized in obtaining this spectrum allows for a signal
enhancement of over an order of magnitude at the cost of an extension of the fraction
delivery duration. However, in specific cases such as the radiological treatment of breast
cancers, the timing of the fraction delivery may already be limited by the patients
breathing cycle, allowing for the implementation of HTM RV with minimal impact on
delivery times. It should be noted that this simulation does not take into consideration
the γ and neutron background in the treatment room, nor the effects of Compton
scattering.
     In general, PT fractions are delivered with a range of beam energies to ensure
full coverage of the CTV. Our method is well-suited for pencil-beam PT, where the
beam energy is well defined and can be varied over the course of the fraction delivery.
The results of the 0.27 Gy simulation suggest that our method could be used prior to
fraction delivery as a method of quality control, as well as during treatment for online
monitoring. The HTM would be surgically implanted near the CTV before treatment
(Tran et al. 2012). The position of the implanted HTM inside the tissue can be precisely
measured prior to treatment with a CT scan. Using a small portion of the dose delivered
with a mono-energetic beam, the RV method outlined in this work can provide a high-
precision measurement of the proton energy in the HTM before delivering the remainder
of the fraction. Thereafter, the signal from the HTM will continue to provide real-time
range feedback for the remainder of the fraction delivery. This particular method also
has applications in RV for FLASH PT, a promising new treatment method in which the
entire fraction dose is delivered at rates exceeding 40 Gy/s (van de Water et al. 2019).
It has been shown that FLASH dose delivery results in increased therapeutic index.
GEANT4 simulations of HTM RV 15
5. Conclusion
The in-vivo RV method outlined in this work is able to determine the absolute remaining
range of the beam inside the patient more precisely than any other RV method currently
in clinical use, without the need for comparison to complex MC simulations, and is
largely independent of tissue composition. The energy of the beam in the HTM is
directly measured through the peak intensity ratio, RMo , and the remaining sub-cm
range of the beam is calculated with a very small uncertainty. With a simple and
relatively cost-effective measurement setup consisting of a small γ-ray detector array and
a digital data acquisition system, this method is highly accessible for clinical use. With
acquisition times much shorter than PET, and range measurements taking place prior to
the completion of fraction delivery, this method is able to provide feedback on treatment
accuracy in real time, on a sub-mm scale. Future work will include the investigation of
the biological impact of the implanted markers, different HTM candidates, expansion
of the simulation to include more realistic background levels, as well as optimization of
detector geometries.
Acknowledgements
We acknowledge the support of the CIHR, NSERC and SSHRC (under Award No.
NFRFE-2018-00691). TRIUMF receives federal funding via a contribution agreement
with the National Research Council of Canada.
Bibliography
Agostinelli, S., Allison, J., Amako, K., Apostolakis, J., Araujo, H., Arce, P., Asai, M., Axen, D.,
Banerjee, S. & Barrand, G. (2002). Geant4 a simulation toolkit, Nuclear Instruments and
Methods in Physics Research Section A: Accelerators, Spectrometers, Detectors and Associated
Equipment 506: 250–303.
Baglin, C. M. (2012). Nuclear Data Sheets, 113: 2187. Data extracted from the ENSDF database
(2019-08-15).
Baglin, C. M. (2013). Nuclear Data Sheets, 114: 1293. Data extracted from the ENSDF database
(2019-08-15).
Barton, M. B., Jacob, S., Shafiq, J., Wong, K., Thompson, S. R., Hanna, T. P. & Delaney, G. P. (2014).
Estimating the demand for radiotherapy from the evidence: a review of changes from 2003 to
2012, Radiother Oncol 112(1): 140–4.
Bethe, H. (1930). Zur Theorie des Durchgangs schneller Korpuskularstrahlen durch Materie, Annalen
der Physik 397(3): 325–400.
Biswas, R., Sahadath, H., Mollah, A. S. & Huq, M. F. (2016). Calculation of gamma-ray attenuation
parameters for locally developed shielding material: Polyboron, Journal of Radiation Research
and Applied Sciences 9(1): 26–34.
Brun, R. & Rademakers, F. (1997). Root an object oriented data analysis framework, Nuclear
Instruments and Methods in Physics Research Section A: Accelerators, Spectrometers, Detectors
and Associated Equipment 389(1): 81–6. New Computing Techniques in Physics Research V.
Burbadge, C., Kasanda, E., Bildstein, V., Dublin, G., Olaizola, B., Spyrou, A., Höhr, C. & Mücher,
D. (2019). Range Verification in Proton Therapy using Delayed Gamma-Ray Spectroscopy of
a 92 Mo Tumour Marker, Physics in Medicine and Biology, Under Review .GEANT4 simulations of HTM RV 16
Canadian Cancer Statistics Advisory Committee (2017). Canadian cancer statistics 2017.
URL: www.cancer.ca/en/cancer-information/cancer-101/canadian-cancer-statistics-
publication
Draeger, E., Mackin, D., Peterson, S., Chen, H., Avery, S., Beddar, S. & Polf, J. C. (2018). 3d
prompt gamma imaging for proton beam range verification, Physics in Medicine & Biology
63(3): 035019.
Hueso-González, F., Fiedler, F., Golnik, C., Kormoll, T., Pausch, G., Petzoldt, J., Römer, K. E. &
Enghardt, W. (2016). Compton camera and prompt gamma ray timing: Two methods for in
vivo range assessment in proton therapy, Frontiers in Oncology 6: 80.
Ilicic, K., Combs, S. E. & Schmid, T. E. (2018). New insights in the relative radiobiological effectiveness
of proton irradiation, Radiat Oncol 13(1): 6.
Knopf, A.-C. & Lomax, A. (2013). In vivo proton range verification: a review, Physics in Medicine
and Biology 58(15): R131–60.
Koning, A. & Rochman, D. (2012). Modern nuclear data evaluation with the talys code system, Nuclear
Data Sheets 113(12): 2841–934. Special Issue on Nuclear Reaction Data.
Lourenço, A., Shipley, D., Wellock, N., Thomas, R., Bouchard, H., Kacperek, A., Fracchiolla, F.,
Lorentini, S., Schwarz, M., MacDougall, N., Royle, G. & Palmans, H. (2017). Evaluation of the
water-equivalence of plastic materials in low- and high-energy clinical proton beams, Physics in
Medicine and Biology 62(10): 3883–901.
Martinez, D. M., Rahmani, M., Burbadge, C. & Hoehr, C. (2019). A practical solution of the bethe
equation in the energy range applicable to radiotherapy and radionuclide production, Scientific
Report 9: 17599.
McGowan, S. E., Burnet, N. G. & Lomax, A. J. (2013). Treatment planning optimisation in proton
therapy, Br J Radiol 86(1021): 20120288.
Moses, W. (2011). Fundamental limits of spatial resolution in pet, Nuclear instruments and methods
in physics research. Section A, Accelerators, spectrometers, detectors and associated equipment
648 Supplement 1: S236–40.
Paganetti, H. (2012). Range uncertainties in proton therapy and the role of Monte Carlo simulations,
Physics in Medicine and Biology 57(11): R99–117.
Paganetti, H. & El Fakhri, G. (2015). Monitoring proton therapy with PET, Br J Radiol
88(1051): 20150173.
Parodi, K., Paganetti, H., Shih, H. A., Michaud, S., Loeffler, J. S., DeLaney, T. F., Liebsch, N. J.,
Munzenrider, J. E., Fischman, A. J., Knopf, A. & Bortfeld, T. (2007). Patient Study of In
Vivo Verification of Beam Delivery and Range, Using Positron Emission Tomography and
Computed Tomography Imaging After Proton Therapy, International Journal of Radiation
Oncology*Biology*Physics 68(3): 920–34.
Parodi, K. & Polf, J. C. (2018). In vivo range verification in particle therapy, Medical Physics
45(11): E1036–50.
Parodi, K., Ponisch, F. & Enghardt, W. (2005). Experimental study on the feasibility of in-beam pet
for accurate monitoring of proton therapy, Nuclear Science, IEEE Transactions on 52: 778–86.
Salehi, D., Sardari, D. & Jozani, M. S. (2015). Investigation of some radiation shielding parameters in
soft tissue, Journal of Radiation Research and Applied Sciences 8(3): 439–45.
Szymaska, K., Achenbach, P., Agnello, M., Botta, E., Bracco, A., Bressani, T., Camera, F., Cederwall,
B., Feliciello, A., Ferro, F., Gerl, J., Iazzi, F., Kavatsyuk, M., Kojouharov, I., Pochodzalla, J.,
Raciti, G., Saito, T., Lorente, A. S., Tegnr, P.-E. & Wieland, O. (2008). Resolution, efficiency
and stability of hpge detector operating in a magnetic field at various gamma-ray energies,
Nuclear Instruments and Methods in Physics Research Section A: Accelerators, Spectrometers,
Detectors and Associated Equipment 592(3): 486–92.
Tobias, C., Benton, E., Capp, M., Chatterjee, A., Cruty, M. & Henke, R. (1977). Particle radiography
and autoactivation, International Journal of Radiation Oncology*Biology*Physics 3: 35–44.
Particles and Radiation Therapy Second International Conference.GEANT4 simulations of HTM RV 17
Tran, E., Ma, R., Paton, K., Blackmore, E. & Pickles, T. (2012). Outcomes of Proton Radiation
Therapy for Peripapillary Choroidal Melanoma at the BC Cancer Agency, International Journal
of Radiation Oncology*Biology*Physics 83(5): 1425–31.
Twomey, T. (2003). The best choice of high purity germanium (hpge) detector, Technical report,
Ametek Advanced Measurement Technology.
Tyldesley, S., Delaney, G., Foroudi, F., Barbera, L., Kerba, M. & Mackillop, W. (2011). Estimating the
need for radiotherapy for patients with prostate, breast, and lung cancers: verification of model
estimates of need with radiotherapy utilization data from British Columbia, Int. J. Radiat.
Oncol. Biol. Phys. 79(5): 1507–15.
van de Water, S., Safai, S., Schippers, J. M., Weber, D. C. & Lomax, A. J. (2019). Towards flash
proton therapy: the impact of treatment planning and machine characteristics on achievable
dose rates, Acta Oncologica 0(0): 1–7. PMID: 31241377.
Verburg, J. M. & Seco, J. (2014). Proton range verification through prompt gamma-ray spectroscopy,
Physics in Medicine and Biology 59(23): 7089–106.
Wang, Z., Zhou, Q., Liu, J., Tang, S., Liang, X., Zhou, Z., He, Y., Peng, H. & Xiao, Y. (2014).
Tumor size of breast invasive ductal cancer measured with contrast-enhanced ultrasound predicts
regional lymph node metastasis and N stage, Int J Clin Exp Pathol 7(10): 6985–91.
Wilson, R. R. (1946). Radiological use of fast protons, Radiology 47(5): 487–91. PMID: 20274616.You can also read