A Risk Prediction Model Based on Machine Learning for Cognitive Impairment Among Chinese Community-Dwelling Elderly People With Normal Cognition: ...
←
→
Page content transcription
If your browser does not render page correctly, please read the page content below
JOURNAL OF MEDICAL INTERNET RESEARCH                                                                                                                Hu et al

     Original Paper

     A Risk Prediction Model Based on Machine Learning for Cognitive
     Impairment Among Chinese Community-Dwelling Elderly People
     With Normal Cognition: Development and Validation Study

     Mingyue Hu1, MSc; Xinhui Shu2, MSc; Gang Yu3, PhD; Xinyin Wu4, PhD; Maritta Välimäki1,5*, PhD; Hui Feng1,6,7*,
     PhD
     1
      Xiangya Nursing School, Central South University, Changsha, China
     2
      Henan Cancer Hospital Province, Zhengzhou University, Zhengzhou, China
     3
      Department of Biomedical Engineering, School of Basic Medical Science, Central South University, Changsha, China
     4
      Xiangya School of Public Health, Central South University, Changsha, China
     5
      Department of Nursing Science, University of Turku, Helsinki, Finland
     6
      Oceanwide Health Management Institute, Central South University, Changsha, China
     7
      National Clinical Research Center for Geriatric Disorders, Xiangya Hospital, Central South University, Changsha, China
     *
      these authors contributed equally

     Corresponding Author:
     Hui Feng, PhD
     Xiangya Nursing School
     Central South University
     Yuelu District
     172 Tongzipo Road
     Changsha
     China
     Phone: 86 15173121969
     Email: feng.hui@csu.edu.cn

     Abstract
     Background: Identifying cognitive impairment early enough could support timely intervention that may hinder or delay the
     trajectory of cognitive impairment, thus increasing the chances for successful cognitive aging.
     Objective: We aimed to build a prediction model based on machine learning for cognitive impairment among Chinese
     community-dwelling elderly people with normal cognition.
     Methods: A prospective cohort of 6718 older people from the Chinese Longitudinal Healthy Longevity Survey (CLHLS)
     register, followed between 2008 and 2011, was used to develop and validate the prediction model. Participants were included if
     they were aged 60 years or above, were community-dwelling elderly people, and had a cognitive Mini-Mental State Examination
     (MMSE) score ≥18. They were excluded if they were diagnosed with a severe disease (eg, cancer and dementia) or were living
     in institutions. Cognitive impairment was identified using the Chinese version of the MMSE. Several machine learning algorithms
     (random forest, XGBoost, naïve Bayes, and logistic regression) were used to assess the 3-year risk of developing cognitive
     impairment. Optimal cutoffs and adjusted parameters were explored in validation data, and the model was further evaluated in
     test data. A nomogram was established to vividly present the prediction model.
     Results: The mean age of the participants was 80.4 years (SD 10.3 years), and 50.85% (3416/6718) were female. During a
     3-year follow-up, 991 (14.8%) participants were identified with cognitive impairment. Among 45 features, the following four
     features were finally selected to develop the model: age, instrumental activities of daily living, marital status, and baseline cognitive
     function. The concordance index of the model constructed by logistic regression was 0.814 (95% CI 0.781-0.846). Older people
     with normal cognitive functioning having a nomogram score of less than 170 were considered to have a low 3-year risk of cognitive
     impairment, and those with a score of 170 or greater were considered to have a high 3-year risk of cognitive impairment.
     Conclusions: This simple and feasible cognitive impairment prediction model could identify community-dwelling elderly people
     at the greatest 3-year risk for cognitive impairment, which could help community nurses in the early identification of dementia.

     https://www.jmir.org/2021/2/e20298                                                                    J Med Internet Res 2021 | vol. 23 | iss. 2 | e20298 | p. 1
                                                                                                                         (page number not for citation purposes)
XSL• FO
RenderX
JOURNAL OF MEDICAL INTERNET RESEARCH                                                                                                        Hu et al

     (J Med Internet Res 2021;23(2):e20298) doi: 10.2196/20298

     KEYWORDS
     prediction model; cognitive impairment; machine learning; nomogram

                                                                          AdaBoost, and random forest (RF), have been used to predict
     Introduction                                                         or detect cognitive impairment [12-15].
     Dementia constitutes a major health care burden nationally and       We systematically searched PubMed ([“cognitive impairment”
     worldwide [1]. Approximately every 3 seconds, a person               OR “cognitive decline” OR “dementia” OR “alzheimer*”] AND
     somewhere in the world is diagnosed with dementia, and the           [“machine learning” OR “data mining” OR “big data”] AND
     current annual cost of dementia is estimated to be US $1 trillion,   “prediction”) and found four studies in which machine learning
     which is set to double by 2030 [2]. China has the largest            was used to identify risk factors for dementia among people
     population of patients with dementia in the world (9.5 million)      with normal cognition at baseline. One study [16] used
     followed by the United States (4.2 million) [1]. Evidence            unsupervised machine learning to develop a dementia prediction
     suggests that delaying the onset of dementia by 1 year is likely     model that could identify people at a high risk of developing
     to reduce its prevalence by 11% by 2050, while delaying it by        dementia. Another study [13] used the medical records of 93,120
     5 years could halve the number of people living with dementia        patients to develop a model for exploring undetected dementia
     by 2050 [3]. Given that dementia is incurable, it is of high         using a machine learning approach (with an area under the curve
     importance to detect cognitive impairment in its early stages        of 0.74). One study [17] developed a model for predicting the
     [4].                                                                 risk of developing dementia within the next 2 years among older
     Good evidence already exists that specific risk factors can          people (aged 85 years or above) without dementia (with an area
     contribute to increased dementia risk at different life stages.      under the curve of 0.73). The study showed that the predictors
     The risk factors are education in early life, hypertension and       differed between the youngest and oldest individuals in the
     obesity in midlife, and smoking and depression in later life [5].    population. Further, another study used supervised machine
     Prediction models concerning risk factors for cognitive              learning to develop a dementia prediction model (area under
     impairment have already been published. However, the variables       the curve values of 0.75 and 0.79) and found that the Disease
     included in the models vary, and they mostly focus on laboratory     State Index is useful for identifying individuals who are most
     markers only [6-8]. A systematic review by Hou et al included        at risk [18].
     61 studies of the prediction models of dementia. They found          However, a variety of difficulties have been identified in
     that age, sex, education, cognition assessment scales, BMI,          implementing the results of machine learning in clinical practice,
     alcohol intake, and genetic variables were the most common           as the data have been collected at one time point only, meaning
     predictors included in the models [8]. Questionnaire-based data      that the causality of the data can be questioned [13]. Some
     have also been used to explore the clinical variables with           prediction models have been too complicated, and there have
     promising predictive values in the transition to cognitive           been problems with accuracy in the prediction [16-18]. In
     impairment (demographic characteristics and neuropsychiatric         addition, although the results seem to be acceptable from a
     symptoms). Other studies have used data based on medical             statistical point of view, understanding the interpretation of the
     imaging (brain atrophy), genes (apolipoprotein Eε4), or              unsupervised machine learning result and its implementation
     biomarkers (amyloid-β, tau, etc) [5,9,10]. One study used the        into practice is demanding [16]. There is still room for the
     C-Pittsburgh compound B (C-PiB) medial temporal standard             improvement of prediction models for forecasting risks for
     uptake value ratio with the Mini-Mental State Examination            dementia. In addition, more studies are needed to develop and
     (MMSE) for the prediction of a person going from mild                translate the results into clinical practice, especially for
     cognitive impairment to dementia, and the area under the curve       community environments [19]. We therefore aimed to develop
     was 0.92 [6]. Kivipelto et al used big data to develop a             an algorithm to be used in a prediction model to identify risk
     prediction model of the risk of late-life dementia in middle-aged    factors for cognitive impairment among Chinese
     people, and the model included age, education, hypertension,         community-dwelling elderly people with normal cognition. The
     hypercholesterolemia, and obesity as variables, with an average      study results are important, as an approach to stratify the
     area under the curve of 0.77 [7]. However, these prediction          individual risks for cognitive impairment is needed in
     models are complex, less accurate, and difficult to implement        community settings for both national and international purposes
     in practice for nursing staff who are working with elderly           [20].
     patients. Therefore, especially for use in community
     environments, simpler, more accurate, and feasible models are        Methods
     needed [8].
     Machine learning has recently been used to produce a prediction
                                                                          Design and Participants
     model for practice. Machine learning can help in modeling            This study strictly followed the Transparent Reporting of a
     information based on causal and/or statistical data, potentially     Multivariable Prediction Model for Individual Prognosis or
     revealing hidden dependencies between factors and diseases in        Diagnosis (TRIPOD): The TRIPOD Statement [21]. In this
     a big data environment [11]. Published studies show how              machine learning approach, the national prospective longitudinal
     machine learning algorithms, such as naïve Bayes (NB),               results of the Chinese Longitudinal Healthy Longevity Survey

     https://www.jmir.org/2021/2/e20298                                                            J Med Internet Res 2021 | vol. 23 | iss. 2 | e20298 | p. 2
                                                                                                                 (page number not for citation purposes)
XSL• FO
RenderX
JOURNAL OF MEDICAL INTERNET RESEARCH Hu et al
(CLHLS) were used [22]. The CLHLS is one of the largest elimination, a 10-fold cross-validation was implemented to
national longitudinal studies for investigating the health of older optimize the variable selection. In addition, the RFE method
Chinese adults. Launched in 1998, the CLHLS implemented with the NB method was used to extract variables, and the result
follow-up surveys in 2000, 2002, 2005, 2008-09, 2011-12, and was compared with RFE combined with RF. According to the
2014. A total of 22 Chinese provinces were randomly recruited, results of RF and NB, the final feature selection was based on
and the sampling frame covered about 85% of the total the number of features included and accuracy.
population of China. The survey results in the national database
We divided the original data into a 2/3 training set, 1/6
are freely accessible and available online [23]. The 2008-09
validation set, and 1/6 test set [26]. The training set was used
survey included a total of 16,954 participants.
for model development. The validation set was used to adjust
We included 11,788 participants from the 2008-09 wave, and parameters of the model and explore optimal cutoffs after
6718 participants were eligible for model development and training was finished. The test set was used to estimate the
internal validation. Participants were included if they were (1) generalization of the model. Regarding the algorithm used in
aged 60 years or above; (2) community-dwelling elderly people; the development of prediction models, we chose four machine
and (3) normally cognitive (MMSE score ≥18). They were learning algorithms, including RF, XGBoost, NB, and logistic
excluded if they (1) were diagnosed with a severe disease (eg, regression, to construct models based on the results of the feature
cancer and dementia) or (2) lived in an institution. A detailed selection. We chose these four learning algorithms because they
flow chart of participant selection is shown in Multimedia are recommended by “Guidelines for Developing and Reporting
Appendix 1. Among the remaining participants, in the 2011-12 Machine Learning Predictive Models in Biomedical Research:
wave, a total of 1913 participants were lost in the follow-up and A Multidisciplinary View” [27]. The performances of the four
2879 died. Those who were excluded from analyses owing to prediction models were compared with each other using areas
nonparticipation or death were on average older (PJOURNAL OF MEDICAL INTERNET RESEARCH Hu et al
Feature Selection involving 45 variables had the highest accuracy (0.8502), while
NB combined with RFE showed that accuracy (0.8342) was the the model including four variables had an accuracy of 0.8304
highest with four features included in the model (age, (Table 1). Considering the simplicity and accuracy of the
instrumental activities of daily living, baseline MMSE, and prediction model, we finally chose the following four features
marital status). RF combined with RFE showed that the model to develop the model: age, instrumental activities of daily living,
baseline MMSE, and marital status.
Table 1. Feature selection using naïve Bayes combined with recursive feature elimination and random forest combined with recursive feature elimination.
Method Number of features Accuracy Kappa Accuracy SD Kappa SD
NBa combined with RFEb 4 0.8342 0.3258 0.007801 0.02452
NB combined with RFE 8 0.8229 0.3543 0.007340 0.02408
NB combined with RFE 16 0.8136 0.3421 0.012724 0.02540
NB combined with RFE 45 0.8315 0.3220 0.007567 0.02639
RFc combined with RFE 4 0.8304 0.1545 0.008356 0.05486
RF combined with RFE 8 0.8475 0.1594 0.008545 0.05569
RF combined with RFE 16 0.8471 0.1789 0.007815 0.03612
RF combined with RFE 45 0.8502 0.1214 0.005572 0.04800
a
NB: naïve Bayes.
b
RFE: recursive feature elimination.
c
RF: random forest.
predictive performances, with an area under the curve of 0.814.
Model Evaluation and Comparison The area under the curve of XGBoost (0.811) was less than that
The training, validation, and test sets involved 4514, 1100, and of logistic regression and NB. RF underperformed, with an area
1104 points of data, respectively. We tried to use several widely under the curve of 0.780 (Figure 1).
applied machine learning algorithms (RF, NB, XGBoost, and
logistic regression) for the construction of the prediction models The model of NB performed well in terms of specificity, with
in the training set. a value of 0.776. The specificities of the models of logistic
regression (0.770), RF (0.645), and XGBoost (0.738) were lower
We used a receiver operating characteristic (ROC) curve, than that of NB. The model of RF performed well in terms of
specificity, sensitivity, accuracy, and specificity/sensitivity to sensitivity, with a value of 0.793. The sensitivities of the models
evaluate the prediction model in both validation and test data. of logistic regression (0.701), NB (0.672), and XGBoost (0.724)
Before the evaluation, optimal cutoffs were determined by were lower than that of RF. The accuracy of the NB model
maximizing the Youden index (ie, sensitivity + specificity − 1) (0.760) was higher than the accuracies of the other three models.
by the ROC curve in the validation set. In the test set, ROC All details about the parameters of the models developed with
curves revealed that logistic regression and NB had better different algorithms are shown in Table 2.
https://www.jmir.org/2021/2/e20298 J Med Internet Res 2021 | vol. 23 | iss. 2 | e20298 | p. 4
(page number not for citation purposes)
XSL• FO
RenderXJOURNAL OF MEDICAL INTERNET RESEARCH Hu et al
Figure 1. Receiver operating characteristic curve performance of four models on the test set. AUC: area under the curve.
Table 2. Evaluation of the performance of the four algorithms.
Algorithm Data set Area un- Optimal cut- Specificity Sensitivity Accuracy Specificity/sensitivity
der the off
curve
Logistic regression Validation 0.812 0.116 0.785 0.682 0.768 1.151
Logistic regression Test 0.814 0.116 0.770 0.701 0.759 1.098
Random forest Validation 0.773 0.040 0.654 0.784 0.675 0.834
Random forest Test 0.780 0.040 0.645 0.793 0.669 0.813
Naïve Bayes Validation 0.804 0.214 0.796 0.688 0.778 1.157
Naïve Bayes Test 0.814 0.214 0.776 0.672 0.760 1.155
XGBoost Validation 0.815 0.302 0.753 0.744 0.752 1.012
XGBoost Test 0.814 0.302 0.738 0.724 0.736 1.019
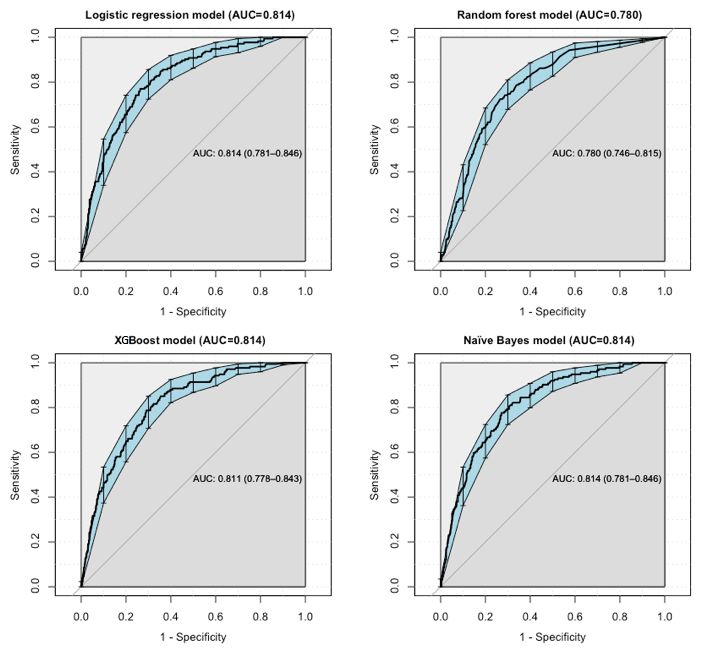
total nomogram scores was determined to be 170 in the test set.
Development of the Nomogram In Figure 2, a box has been used to represent the proportion of
As the prediction developed by logistic regression performed the sample in category variables. For instance, for marital status,
well, a nomogram (Figure 2) was used to present the data and most of the participants were grouped into “married or
predicted probabilities vividly. The optimal cutoff value of the
https://www.jmir.org/2021/2/e20298 J Med Internet Res 2021 | vol. 23 | iss. 2 | e20298 | p. 5
(page number not for citation purposes)
XSL• FO
RenderXJOURNAL OF MEDICAL INTERNET RESEARCH Hu et al
partnered” and “widowed.” Density exhibited the distribution a marital status of widowed, an instrumental activities of daily
of the sample in continuous variables. For example, for baseline living score of 6, and a baseline MMSE score of 22
MMSE, most individuals scored over 28. The total points corresponded to a predicted probability of cognitive impairment
corresponded to the predicted probability. For example, an of 29.3%.
individual score of 200 points in total, with an age score of 85,
Figure 2. Developed nomogram with age, marital status, instrumental activities of daily living (IADL), and baseline Mini-Mental State Examination
(MMSE) incorporated.
uncertain [37]. It is indicated that people aged 75 years or above
Discussion should be screened for the risk of cognitive impairment.
Main Findings However, screening all older people for dementia is not
recommended, as the benefits for that are still unclear [5]. Using
In this study, we developed a prediction model for forecasting large existing registers and databases can offer opportunities to
the 3-year risk of cognitive impairment among 6718 explore existing information to predict the health status [38].
community-dwelling elderly individuals aged 60 years or older
with normal cognitive function via machine learning algorithms. We found that marital status was a strong predictor for the risk
The model performed comparably to the best available of cognitive impairment. A recent meta-analysis involving
biomarkers, such as apolipoprotein genotype [13,17], but is less 812,047 participants evaluated the association between marriage
expensive, easier to implement, and validated internally with and dementia. The results showed that life-long single and
reasonable results. widowed older people were respectively 1.42 and 1.20 times
more likely to be diagnosed with dementia compared with
Feature or variable selection is central in the development of a married older people [33]. Another 10-year longitudinal
prediction model [30]. Out of the original 45 variables, the population-based study including 2,288,489 individuals explored
following four variables used showed the highest accuracy of the influence of marital status and concluded that the risk of
the model: age, marital status, instrumental activities of daily dementia in nonmarried individuals was around 1.7 times greater
living, and baseline MMSE. Our findings support the previous than that in married individuals [32]. The results might be
literature regarding age [5,31], marital status [32,33], activities explained by the fact that married individuals are more likely
of daily living [34,35], and cognitive status [8,36], indicating to have healthy lifestyles and participate in social activities,
that the predictors we selected were usable and reliable. which might be conducive to cognitive reserve and reduced
In this study, age was one of the predictors for the risk of dementia risk over a lifespan [39]. On the contrary, those in
cognitive impairment. It has already been estimated that, in widowhood might be more likely to experience a higher risk of
2020, 83% of people aged 75 years or above live with dementia cognitive impairment than divorced people because of the
in the US [37]. Those aged 65 to 74 years account for 17% of detrimental effect of stress from bereavement on hippocampal
cases, while those younger than 65 years could develop neurons or cognition. Further, as marriage has been considered
dementia, but it is much less common and the prevalence is a social norm, people with difficulties in communication and
https://www.jmir.org/2021/2/e20298 J Med Internet Res 2021 | vol. 23 | iss. 2 | e20298 | p. 6
(page number not for citation purposes)
XSL• FO
RenderXJOURNAL OF MEDICAL INTERNET RESEARCH Hu et al
smaller cognitive reserves across life may be less likely to marry representative database, the ascertainment bias could, to an
[33]. In today’s society, staying unmarried has become more extent, be limited. Second, we utilized a cross-validation
common, and this phenomenon deserves more attention. Social approach to model development and assessment. The results
factors like marital status should be taken seriously as risk still need to be validated in an independent cohort. Third, we
determinants for cognitive impairment. used cohort studies with insufficient details on the duration of
marriage, widowhood, and divorce to allow the exploration of
An association between physical function and cognitive capacity
a dose-response effect. A future study could take the
among older people has been found in previous studies [34,40].
dose-response effect of marital status on cognitive function into
Our study only included instrumental activities of daily living
consideration. Fourth, the baseline MMSE was used as one of
as a predictor for constructing the model, and it did not consider
the predictors. However, other specific cognitive domains, such
activities of daily living that represent functional ability. The
as memory and executive function, could also be used as
reason might be that there is a natural hierarchy of functional
features, and they might perform better than whole cognitive
loss associated with cognitive decline among older people [34].
function. Fifth, our models were based on a prospective cohort
Older persons with progressive cognitive decline lose the ability
that may have some level of bias. A prospective external
to perform tasks, often in the order of bathing, dressing,
validation cohort is needed for further confirmation in future
toileting, transferring, continence, and feeding. Therefore, older
research. Lastly, some predictors used in our study were
people who are not able to feed themselves might not be able
measured by self-reporting, resulting in information bias.
to perform other tasks independently [35]. Similarly, a study
Nevertheless, self-reported data are more feasibly collected in
by Njegovan et al found that among the 14 items of activities
primary health care settings, and the results can be generalized
of daily living and instrumental activities of daily living, a
to wider communities. Despite these limitations, we believe
hierarchy of functional items existed, with instrumental activities
that the results are usable in terms of cognitive impairment
of daily living (such as shopping, banking, etc) being lost at
prevention and further intervention globally.
higher cognitive scores than basic activities of daily living (such
as eating, dressing, etc), which were lost later [34]. Our results Implications
confirmed that there was a tendency for instrumental activities This is one of the first studies where a machine learning
of daily living to be a stronger predictor compared with activities approach has been used in a nursing context. The study showed
of daily living. However, since there was overlap, subdomains that machine learning can be used more widely in nursing
of these two tools might be more meaningful for developing a science in different contexts and various functions. The
prediction model. For nurses and caregivers, this information prediction models exert implications in the three-grade
can help anticipate the need for intervention in people with prevention system of diseases [38]. In the primary prevention
declining cognition showing subtle declines in instrumental of diseases, a cognitive impairment prediction model could
activities of daily living, which could improve the quality of provide quantitative risk value (probability) of cognitive
life of these people and their caregivers and play an important deficiency in the next 3 years, based on the current health status,
part in health care planning [34]. offering a more intuitive and powerful scientific tool for health
Baseline cognitive function affected the degree to which education and behavioral intervention. In the secondary
cognitive scores changed over time and had a profound effect prevention of diseases, using noninvasive, low-cost, and
on further cognitive impairment. In one study using UK biobank easy-to-acquire variables to develop a prediction model is more
data to assess the effect of baseline cognitive performance on practicable for staff, particularly general practitioners in
a prediction model for 3 to 8-year risk of dementia, the results community health, to bring about “early detection, early
showed that cognitive performance added up to 5% (from 0.78 diagnosis, and early treatment,” which have large influences on
to 0.83) to the discriminative accuracy of the ROC model medical costs for dementia. In the tertiary prevention of diseases,
developed with the variables of age, sex, education, family the prediction model could be used to predict recurrence,
history, and depression [36]. The MMSE has been the most reducing mortality and disability [38]. A simple and feasible
common cognitive variable for developing a dementia prediction prediction model would also help nurses to be aware of the
model [8]. However, variables of specific cognitive domains, progression of diseases over time. Therefore, nurses could be
such as memory and executive function, might be more feasible better aware of triggers that might alarm them about any hidden
and useful predictors in constructing cognitive impairment problems. In addition, a precise prediction model with predictors
prediction models. The total MMSE score was associated less that are more available in clinical environments could help
strongly with dementia and Alzheimer disease than the episodic clinical nurses understand the prognostic factors of diseases.
memory subset [8]. Therefore, future studies could consider Based on this information, nurses could offer tailored preventive
more specific cognitive domain variables. interventions to patients before any signs of cognition deficits
occur.
Limitations
This study provides guidance for future research as well. First,
Our study has limitations, which should be considered in the
the use of several algorithms to construct prediction models in
interpretation of the study results. First, retained cohort members
specific diseases offers more opportunity to find a more suitable
were younger and had on average better cognitive and physical
model with a high area under the curve and accuracy. Second,
functioning than those who dropped out, which can lead to
selecting the most suitable predictors is important for developing
studies being severely underpowered and biased toward the
a prediction model to use in clinical practice. Easy-to-acquire,
healthier part of the aging population. As we used a nationally
noninvasive, and low-cost variables are welcome in clinical
https://www.jmir.org/2021/2/e20298 J Med Internet Res 2021 | vol. 23 | iss. 2 | e20298 | p. 7
(page number not for citation purposes)
XSL• FO
RenderXJOURNAL OF MEDICAL INTERNET RESEARCH Hu et al
nursing, and invasive biomarkers could improve the prediction. In the future, the results of this study could be used in countries
The former is more suitable for community health care and any and areas with less human resources, such as low- and
clinical environment because of large populations and middle-income countries, to identify elderly people with a high
insufficient staff and funds, while the latter is more applicable risk of developing cognitive deficiency in the next 3 years (ie,
in more specific clinical environments for people with high risk age, marital status, physical function, and cognitive function).
of diseases. Lastly, we included Chinese elderly people aged Simple, relevant, and easy-to-detect risk factors would save
60 years or above and developed a cognitive impairment time and resources in health care and would especially help
prediction model. Further studies could develop cognitive nursing staff identify those people who are at high risk of
impairment prediction models for middle-aged people as the developing cognitive impairment. As family members living
World Health Organization has suggested to increase the with elderly people do not always recognize the early signs of
cognitive reserve in mid-life and early aging (45-70 years) [41]. dementia [42], the knowledge obtained from this study could
be used to educate family members as well.
Acknowledgments
We appreciate the support from the Special Funding for the Construction of Innovative Provinces in Hunan (grant number:
2019SK2141), China Scholarship Council (grant number: Liumeijin 2020-1509), and Central South University-Flinders University
Seed Project (grant number: 2020xyhlzzjj002).
Authors' Contributions
MYH and XYW conceived of the presented idea. MYH and XHS performed the analytical calculations and took the lead in
writing the manuscript. GY verified the analytical methods. VM investigated and supervised the findings of this work and helped
in the language edit. HF supervised the whole project. In addition, VM and HF contributed equally to this manuscript.
Conflicts of Interest
None declared.
Multimedia Appendix 1
Flow chart of participant selection.
[DOCX File , 25 KB-Multimedia Appendix 1]
Multimedia Appendix 2
Detailed information about 45 features among the participants (grouped by cognitive impairment).
[DOCX File , 35 KB-Multimedia Appendix 2]
References
1. World Alzheimer Report 2015: The global impact of dementia: an analysis of prevalence, incidence, cost and trends.
Alzheimer's Disease International. 2015. URL: https://www.alzint.org/resource/world-alzheimer-report-2015/ [accessed
2021-02-12]
2. World Alzheimer Report 2019: Attitudes to dementia. Alzheimer's Disease International. 2019. URL: https://www.alzint.org/
resource/world-alzheimer-report-2019/ [accessed 2021-01-12]
3. Frankish H, Horton R. Prevention and management of dementia: a priority for public health. The Lancet 2017
Dec;390(10113):2614-2615. [doi: 10.1016/s0140-6736(17)31756-7]
4. World Alzheimer Report 2018-The state of the art of dementia research: New frontiers. Alzheimer's Disease International.
2018. URL: https://www.alzint.org/u/WorldAlzheimerReport2018.pdf [accessed 2021-01-12]
5. Livingston G, Sommerlad A, Orgeta V, Costafreda SG, Huntley J, Ames D, et al. Dementia prevention, intervention, and
care. The Lancet 2017 Dec;390(10113):2673-2734. [doi: 10.1016/s0140-6736(17)31363-6]
6. Chen X, Zhou Y, Wang R, Cao H, Reid S, Gao R, Alzheimer’s Disease Neuroimaging Initiative. Potential Clinical Value
of Multiparametric PET in the Prediction of Alzheimer's Disease Progression. PLoS One 2016 May 16;11(5):e0154406
[FREE Full text] [doi: 10.1371/journal.pone.0154406] [Medline: 27183116]
7. Kivipelto M, Ngandu T, Laatikainen T, Winblad B, Soininen H, Tuomilehto J. Risk score for the prediction of dementia
risk in 20 years among middle aged people: a longitudinal, population-based study. The Lancet Neurology 2006
Sep;5(9):735-741. [doi: 10.1016/s1474-4422(06)70537-3]
8. Hou X, Feng L, Zhang C, Cao X, Tan L, Yu J. Models for predicting risk of dementia: a systematic review. J Neurol
Neurosurg Psychiatry 2019 Apr 28;90(4):373-379. [doi: 10.1136/jnnp-2018-318212] [Medline: 29954871]
https://www.jmir.org/2021/2/e20298 J Med Internet Res 2021 | vol. 23 | iss. 2 | e20298 | p. 8
(page number not for citation purposes)
XSL• FO
RenderXJOURNAL OF MEDICAL INTERNET RESEARCH Hu et al
9. Pase MP, Beiser AS, Himali JJ, Satizabal CL, Aparicio HJ, DeCarli C, et al. Assessment of Plasma Total Tau Level as a
Predictive Biomarker for Dementia and Related Endophenotypes. JAMA Neurol 2019 May 01;76(5):598-606 [FREE Full
text] [doi: 10.1001/jamaneurol.2018.4666] [Medline: 30830207]
10. Ding D, Zhao Q, Guo Q, Liang X, Luo J, Yu L, Shanghai Aging Study (SAS). Progression and predictors of mild cognitive
impairment in Chinese elderly: A prospective follow-up in the Shanghai Aging Study. Alzheimers Dement (Amst)
2016;4:28-36 [FREE Full text] [doi: 10.1016/j.dadm.2016.03.004] [Medline: 27489876]
11. Bratić B, Kurbalija V, Ivanović M, Oder I, Bosnić Z. Machine Learning for Predicting Cognitive Diseases: Methods, Data
Sources and Risk Factors. J Med Syst 2018 Oct 27;42(12):243. [doi: 10.1007/s10916-018-1071-x] [Medline: 30368611]
12. Joshi S, Deepa Shenoy P, Simha GG V, Venugopal KR, Patnaik L. Classification of Neurodegenerative Disorders Based
on Major Risk Factors Employing Machine Learning Techniques. IJET 2010;2(4):350-355. [doi: 10.7763/ijet.2010.v2.146]
13. Ford E, Rooney P, Oliver S, Hoile R, Hurley P, Banerjee S, et al. Identifying undetected dementia in UK primary care
patients: a retrospective case-control study comparing machine-learning and standard epidemiological approaches. BMC
Med Inform Decis Mak 2019 Dec 02;19(1):248 [FREE Full text] [doi: 10.1186/s12911-019-0991-9] [Medline: 31791325]
14. Li R. Data Mining and Machine Learning Methods for Dementia Research. In: Perneczky R, editor. Biomarkers for
Alzheimer’s Disease Drug Development. Methods in Molecular Biology, vol 1750. New York, NY: Humana Press;
2018:363-370.
15. Chekroud AM, Zotti RJ, Shehzad Z, Gueorguieva R, Johnson MK, Trivedi MH, et al. Cross-trial prediction of treatment
outcome in depression: a machine learning approach. The Lancet Psychiatry 2016 Mar;3(3):243-250. [doi:
10.1016/s2215-0366(15)00471-x]
16. Cleret de Langavant L, Bayen E, Yaffe K. Unsupervised Machine Learning to Identify High Likelihood of Dementia in
Population-Based Surveys: Development and Validation Study. J Med Internet Res 2018 Jul 09;20(7):e10493 [FREE Full
text] [doi: 10.2196/10493] [Medline: 29986849]
17. Hall A, Pekkala T, Polvikoski T, van Gils M, Kivipelto M, Lötjönen J, et al. Prediction models for dementia and
neuropathology in the oldest old: the Vantaa 85+ cohort study. Alzheimers Res Ther 2019 Jan 22;11(1):11 [FREE Full
text] [doi: 10.1186/s13195-018-0450-3] [Medline: 30670070]
18. Pekkala T, Hall A, Lötjönen J, Mattila J, Soininen H, Ngandu T, et al. Development of a Late-Life Dementia Prediction
Index with Supervised Machine Learning in the Population-Based CAIDE Study. JAD 2016 Dec 06;55(3):1055-1067. [doi:
10.3233/jad-160560]
19. Xie Y, Yu Z. Models and prediction, how and what? Ann Transl Med 2020 Feb;8(4):75-75 [FREE Full text] [doi:
10.21037/atm.2019.12.133] [Medline: 32175368]
20. Obermeyer Z, Emanuel EJ. Predicting the Future — Big Data, Machine Learning, and Clinical Medicine. N Engl J Med
2016 Sep 29;375(13):1216-1219. [doi: 10.1056/nejmp1606181]
21. Collins GS, Reitsma JB, Altman DG, Moons KG. Transparent Reporting of a Multivariable Prediction Model for Individual
Prognosis or Diagnosis (TRIPOD). Circulation 2015 Jan 13;131(2):211-219. [doi: 10.1161/circulationaha.114.014508]
22. Zeng Y. Chinese Longitudinal Healthy Longevity Survey and some research findings. Geriatr Gerontol Int 2004
Sep;4(s1):S49-S52. [doi: 10.1111/j.1447-0594.2004.00147.x]
23. Center for Healthy Aging and Development Studies. Peking University Open Research Data Platform. URL: https://opendata.
pku.edu.cn/dataverse/CHADS [accessed 2021-02-11]
24. Zhang Z, Zahner GEP, Román GC, Liu X, Wu C, Hong Z, et al. Socio-demographic variation of dementia subtypes in
china: Methodology and results of a prevalence study in Beijing, Chengdu, Shanghai, and Xian. Neuroepidemiology
2006;27(4):177-187 [FREE Full text] [doi: 10.1159/000096131] [Medline: 17035714]
25. Kim Y, Margonis GA, Prescott JD, Tran TB, Postlewait LM, Maithel SK, et al. Nomograms to Predict Recurrence-Free
and Overall Survival After Curative Resection of Adrenocortical Carcinoma. JAMA Surg 2016 Apr 01;151(4):365-373
[FREE Full text] [doi: 10.1001/jamasurg.2015.4516] [Medline: 26676603]
26. Lee S, Gui X, Manquen M, Hamilton E. Use of Training, Validation, and Test Sets for Developing Automated Classifiers
in Quantitative Ethnography. In: Eagan B, Misfeldt M, Siebert-Evenstone A, editors. Advances in Quantitative Ethnography.
ICQE 2019. Communications in Computer and Information Science, vol 1112. Cham: Springer; 2019:117-127.
27. Luo W, Phung D, Tran T, Gupta S, Rana S, Karmakar C, et al. Guidelines for Developing and Reporting Machine Learning
Predictive Models in Biomedical Research: A Multidisciplinary View. J Med Internet Res 2016 Dec 16;18(12):e323 [FREE
Full text] [doi: 10.2196/jmir.5870] [Medline: 27986644]
28. Lei Z, Li J, Wu D, Xia Y, Wang Q, Si A, et al. Nomogram for Preoperative Estimation of Microvascular Invasion Risk in
Hepatitis B Virus-Related Hepatocellular Carcinoma Within the Milan Criteria. JAMA Surg 2016 Apr 01;151(4):356-363.
[doi: 10.1001/jamasurg.2015.4257] [Medline: 26579636]
29. The R Project for Statistical Computing. URL: http://www.r-project.org/ [accessed 2021-02-11]
30. Deo RC. Machine Learning in Medicine. Circulation 2015 Nov 17;132(20):1920-1930. [doi:
10.1161/circulationaha.115.001593]
31. Chinese Dementia Cognitive Impairment Diagnosis Treatment Guidelines Writing Group. Diagnosis and treatment of
dementia (2018): risk factors and interventions of Alzhemer's disease. Natl Med J China 2018;98(19):1461-1466.
https://www.jmir.org/2021/2/e20298 J Med Internet Res 2021 | vol. 23 | iss. 2 | e20298 | p. 9
(page number not for citation purposes)
XSL• FO
RenderXJOURNAL OF MEDICAL INTERNET RESEARCH Hu et al
32. Sundström A, Westerlund O, Kotyrlo E. Marital status and risk of dementia: a nationwide population-based prospective
study from Sweden. BMJ Open 2016 Jan 04;6(1):e008565 [FREE Full text] [doi: 10.1136/bmjopen-2015-008565] [Medline:
26729377]
33. Sommerlad A, Ruegger J, Singh-Manoux A, Lewis G, Livingston G. Marriage and risk of dementia: systematic review and
meta-analysis of observational studies. J Neurol Neurosurg Psychiatry 2018 Mar 28;89(3):231-238 [FREE Full text] [doi:
10.1136/jnnp-2017-316274] [Medline: 29183957]
34. Njegovan V, Hing MM, Mitchell SL, Molnar FJ. The hierarchy of functional loss associated with cognitive decline in older
persons. J Gerontol A Biol Sci Med Sci 2001 Oct 01;56(10):M638-M643. [doi: 10.1093/gerona/56.10.m638] [Medline:
11584037]
35. Katz S, Ford AB, Moskowitz RW, Jackson BA, Jaffe MW. Studies of illness in the aged. The index of ADL: a standardized
measure of biological and psychosocial function. JAMA 1963 Sep 21;185:914-919. [doi:
10.1001/jama.1963.03060120024016] [Medline: 14044222]
36. Calvin CM, Wilkinson T, Starr JM, Sudlow C, Hagenaars SP, Harris SE, et al. Predicting incident dementia 3-8 years after
brief cognitive tests in the UK Biobank prospective study of 500,000 people. Alzheimers Dement 2019 Dec
13;15(12):1546-1557. [doi: 10.1016/j.jalz.2019.07.014] [Medline: 31619348]
37. Hebert LE, Weuve J, Scherr PA, Evans DA. Alzheimer disease in the United States (2010-2050) estimated using the 2010
census. Neurology 2013 Feb 06;80(19):1778-1783. [doi: 10.1212/wnl.0b013e31828726f5]
38. Zhou Z, Wang W, Li Y, Jin K, Wang X, Wang Z, et al. In-depth mining of clinical data: the construction of clinical prediction
model with R. Ann Transl Med 2019 Dec;7(23):796-796 [FREE Full text] [doi: 10.21037/atm.2019.08.63] [Medline:
32042812]
39. Kuiper JS, Zuidersma M, Oude Voshaar RC, Zuidema SU, van den Heuvel ER, Stolk RP, et al. Social relationships and
risk of dementia: A systematic review and meta-analysis of longitudinal cohort studies. Ageing Res Rev 2015 Jul;22:39-57.
[doi: 10.1016/j.arr.2015.04.006] [Medline: 25956016]
40. Barberger-Gateau P, Commenges D, Gagnon M, Letenneur L, Sauvel C, Dartigues J. Instrumental activities of daily living
as a screening tool for cognitive impairment and dementia in elderly community dwellers. J Am Geriatr Soc 1992 Nov
27;40(11):1129-1134. [doi: 10.1111/j.1532-5415.1992.tb01802.x] [Medline: 1401698]
41. Vellas B, Scrase D, Rosenberg G, Andrieu S, Araujo de Carvalho I, Middleton L. Editorial: WHO Guidelines on
Community-Level Interventions to Manage Declines in Intrinsic Capacity: The Road for Preventing Cognitive Declines in
Older Age? J Prev Alzheimers Dis 2018;5(3):165-167. [doi: 10.14283/jpad.2018.26] [Medline: 29972207]
42. World Alzheimer Report 2016-Improving healthcare for people living with dementia: Coverage, quality and costs now and
in the future. Alzheimer's Disease International. 2016. URL: https://www.alzint.org/u/WorldAlzheimerReport2016.pdf
[accessed 2021-01-12]
Abbreviations
CLHLS: Chinese Longitudinal Healthy Longevity Survey
CMMSE: Chinese version of the Mini-Mental State Examination
MMSE: Mini-Mental State Examination
NB: naïve Bayes
RF: random forest
RFE: recursive feature elimination
ROC: receiver operating characteristic
TRIPOD: Transparent Reporting of a Multivariable Prediction Model for Individual Prognosis or Diagnosis
Edited by G Eysenbach, Q Zeng; submitted 15.05.20; peer-reviewed by X Ling, C Li; comments to author 28.08.20; revised version
received 14.01.21; accepted 18.01.21; published 24.02.21
Please cite as:
Hu M, Shu X, Yu G, Wu X, Välimäki M, Feng H
A Risk Prediction Model Based on Machine Learning for Cognitive Impairment Among Chinese Community-Dwelling Elderly People
With Normal Cognition: Development and Validation Study
J Med Internet Res 2021;23(2):e20298
URL: https://www.jmir.org/2021/2/e20298
doi: 10.2196/20298
PMID: 33625369
https://www.jmir.org/2021/2/e20298 J Med Internet Res 2021 | vol. 23 | iss. 2 | e20298 | p. 10
(page number not for citation purposes)
XSL• FO
RenderXJOURNAL OF MEDICAL INTERNET RESEARCH Hu et al
©Mingyue Hu, Xinhui Shu, Gang Yu, Xinyin Wu, Maritta Välimäki, Hui Feng. Originally published in the Journal of Medical
Internet Research (http://www.jmir.org), 24.02.2021. This is an open-access article distributed under the terms of the Creative
Commons Attribution License (https://creativecommons.org/licenses/by/4.0/), which permits unrestricted use, distribution, and
reproduction in any medium, provided the original work, first published in the Journal of Medical Internet Research, is properly
cited. The complete bibliographic information, a link to the original publication on http://www.jmir.org/, as well as this copyright
and license information must be included.
https://www.jmir.org/2021/2/e20298 J Med Internet Res 2021 | vol. 23 | iss. 2 | e20298 | p. 11
(page number not for citation purposes)
XSL• FO
RenderXYou can also read