Realistic High-Resolution Body Computed Tomography Image Synthesis by Using Progressive Growing Generative Adversarial Network: Visual Turing Test
←
→
Page content transcription
If your browser does not render page correctly, please read the page content below
JMIR MEDICAL INFORMATICS                                                                                                                     Park et al

     Original Paper

     Realistic High-Resolution Body Computed Tomography Image
     Synthesis by Using Progressive Growing Generative Adversarial
     Network: Visual Turing Test

     Ho Young Park1, MD; Hyun-Jin Bae2, PhD; Gil-Sun Hong1, MD; Minjee Kim3, BSc; JiHye Yun1, PhD; Sungwon
     Park4, MD; Won Jung Chung4, MD; NamKug Kim1,5, PhD
     1
      Department of Radiology and Research Institute of Radiology, University of Ulsan College of Medicine & Asan Medical Center, Seoul, Republic of
     Korea
     2
      Department of Medicine, University of Ulsan College of Medicine & Asan Medical Center, Seoul, Republic of Korea
     3
      Department of Biomedical Engineering, Asan Medical Institute of Convergence Science and Technology, Asan Medical Center, University of Ulsan
     College of Medicine, Seoul, Republic of Korea, Seoul, Republic of Korea
     4
      Department of Health Screening and Promotion Center, University of Ulsan College of Medicine & Asan Medical Center, Seoul, Republic of Korea
     5
      Department of Convergence Medicine, University of Ulsan College of Medicine & Asan Medical Center, Seoul, Republic of Korea

     Corresponding Author:
     Gil-Sun Hong, MD
     Department of Radiology and Research Institute of Radiology, University of Ulsan College of Medicine & Asan Medical Center
     88 Olympic-ro 43-gil, Songpa-gu
     Seoul, 05505
     Republic of Korea
     Phone: 82 2 3010 1548
     Email: hgs2013@gmail.com

     Abstract
     Background: Generative adversarial network (GAN)–based synthetic images can be viable solutions to current supervised deep
     learning challenges. However, generating highly realistic images is a prerequisite for these approaches.
     Objective: The aim of this study was to investigate and validate the unsupervised synthesis of highly realistic body computed
     tomography (CT) images by using a progressive growing GAN (PGGAN) trained to learn the probability distribution of normal
     data.
     Methods: We trained the PGGAN by using 11,755 body CT scans. Ten radiologists (4 radiologists with 10 years of experience [Group III])
     evaluated the results in a binary approach by using an independent validation set of 300 images (150 real and 150 synthetic) to
     judge the authenticity of each image.
     Results: The mean accuracy of the 10 readers in the entire image set was higher than random guessing (1781/3000, 59.4% vs
     1500/3000, 50.0%, respectively; P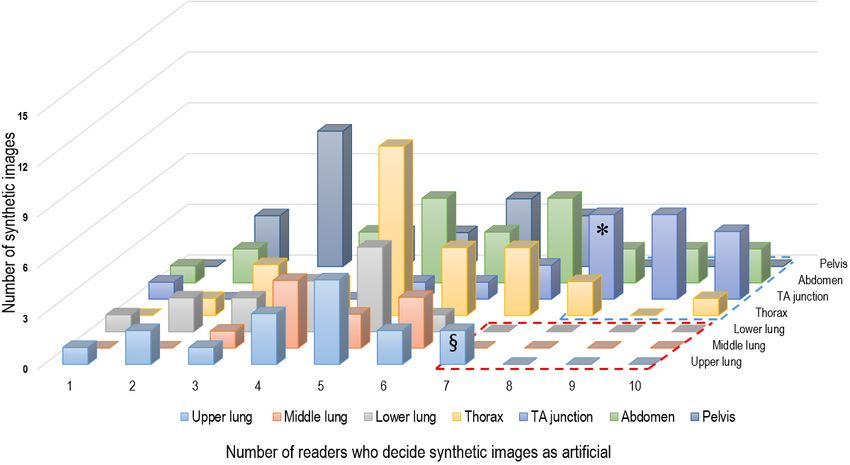
JMIR MEDICAL INFORMATICS                                                                                                                Park et al

                                                                           data sets of normal medical images to develop GAN-based
     Introduction                                                          diagnostic models for clinical application. As a preliminary
     Generative adversarial networks (GANs) is a recent innovative         study, we investigated and validated the unsupervised synthesis
     technology that generates artificial but realistic-looking images.    of highly realistic body CT images by using GAN by learning
     Despite the negative views regarding the use of synthetic images      the probability distribution of normal training data.
     in the medical field, GANs have been spotlighted in radiological
     research because of their undeniable advantages [1]. The use          Methods
     of diagnostic radiological images in the public domain always
     raises the problem of protecting patients’ privacy [2-5]. This
                                                                           Ethical Approval
     has been a great challenge to researchers in the field of deep        This retrospective study was conducted according to the
     learning. GANs may provide a solution to these privacy                principles of the Declaration of Helsinki and was performed in
     concerns. Moreover, GANs are powerful nonsupervised training          accordance with current scientific guidelines. This study
     methods. The traditional supervised learning methods have been        protocol was approved by the Institutional Review Board
     challenged by a lack of high-quality training data labelled by        Committee of the Asan Medical Center (No. 2019-0486). The
     experts. Building these data requires considerable time input         requirement for informed patient consent was waived.
     from experts and leads to correspondingly high costs [6]. This
                                                                           Data Collection for Training
     problem has not yet been resolved despite several collaborative
     efforts to build large open access data sets [7]. Most radiological   We retrospectively reviewed electronic medical records of
     tasks using GANs include the generation of synthetic images           patients who underwent chest CT or abdominopelvic CT
     for augmenting training images [8-11], translation between            (AP-CT) in the Health Screening and Promotion Center of Asan
     different radiological modalities [12-16], image reconstruction       Medical Center between January 2013 and December 2017. We
     and denoising [17-20], and data segmentation [21-24].                 identified 139,390 patients. Their radiologic reports were then
                                                                           reviewed using the radiologic diagnostic codes “Code 0” or
     The more recent noteworthy task using GANs is anomaly                 “Code B0,” which indicated normal CT in our institution’s
     detection. Unlike other tasks using GANs, detecting                   disease classification system, and 17,854 patients with normal
     abnormalities is based on learning the probability distribution       chest CT or normal AP-CT were identified. One board-certified
     of normal training data. Image data outside this distribution are     radiologist (GSH) reviewed the radiological reports of the
     considered as abnormal. Schlegl et al [25] demonstrated               17,854 patients and excluded 3650 cases with incidental benign
     GAN-based anomaly detection in optical coherence tomography           lesions (eg, hepatic cysts, renal cysts, thyroid nodules) detected
     images. They trained GAN with normal data in an unsupervised          on body CT images. Benign lesions were defined as positive
     approach and proposed an anomaly scoring scheme. Alex et al           incidental findings on CT images, which did not require medical
     [26] showed that GAN can detect brain lesions on magnetic             or surgical intervention. Our final study group included CT
     resonance images. This approach has attracted many radiologists       images showing anatomical variations (eg, right aortic arch,
     for several reasons; the most critical is that this approach can      double inferior vena cava) and senile changes (eg,
     achieve a broader clinical application than the current supervised    atherosclerotic calcification without clinical significance). Of
     deep learning–based diagnostic models. In daily clinical practice,    the potentially suitable 14,204 cases, 2449 CT data sets were
     diagnostic images are clinically acquired for patients with a         not available for automatic download using the inhouse system
     variety of diseases. Therefore, before applying the supervised        of our institution. Finally, this study included 11,755 body CT
     deep learning model, it is necessary to select suspected disease      scans (473,833 axial slices) for training the GAN, comprising
     cases with disease categories similar to those of a training data     5000 contrast-enhanced chest CT scans (172,249 axial slices)
     set. For example, in the emergency department, a deep learning        and 6755 AP-CT scans (301,584 axial slices, comprising
     model trained by data from patients with acute appendicitis           132,880 slices of contrast-enhanced AP-CT and 168,704 slices
     could hardly be applied to patients with different abdominal          of contrast-enhanced low-dose AP-CT images).
     pathologies.
                                                                           Training PGGAN to Generate Body CT Images
     For this approach, we think that generating highly realistic
                                                                           A progressive growing GAN (PGGAN) was used to generate
     images is a prerequisite. Previous studies [25,26] trained a GAN
                                                                           high-resolution (512×512 pixels) synthetic body CT images.
     model with small patches (64×64 pixels), which are randomly
                                                                           Unlike PGGAN, previous GAN models such as deep
     extracted from original images. The trained model could only
                                                                           convolutional GANs were able to generate relatively
     generate small patches and did not learn the semantics of the
                                                                           low-resolution (256×256 pixels) synthetic images [27].
     whole images. Hence, the GAN model may generate artificial
                                                                           However, PGGANs have demonstrated that high-resolution
     features, which can lead to large errors in anomaly detection
                                                                           images (1024×1024 pixels) can be generated by applying
     tasks. In addition, there are various kinds of small and subtle
                                                                           progressive growing techniques [28]. Because CT images are
     lesions in the actual clinical setting. Therefore, the previous
                                                                           acquired in high resolutions (512×512 pixels), PGGAN could
     low-resolution GAN approaches could not be used for this
                                                                           be the GAN model that can train with whole CT images in full
     application. In this study, we trained GAN with whole-body
                                                                           resolution. Consequently, the GAN model can preserve their
     computed tomography (CT) images (512×512 pixels); therefore,
                                                                           semantics in the original resolution of CT images. While
     the model learned the semantics of the images. This may lead
                                                                           StyleGAN also demonstrates realistic synthetic images with the
     to robust performances in anomaly detection in CT images. Due
                                                                           style feature [29], we chose the PGGAN model for training
     to the aforementioned reasons, we have attempted to build large

     https://medinform.jmir.org/2021/3/e23328                                                        JMIR Med Inform 2021 | vol. 9 | iss. 3 | e23328 | p. 2
                                                                                                               (page number not for citation purposes)
XSL• FO
RenderX
JMIR MEDICAL INFORMATICS Park et al
because of its simple yet powerful performance. In addition, consisted of 7 subgroups based on the anatomical structure: 50
we did not consider BigGAN because it is a conditional model chest-L images were divided into upper lung, middle lung, and
[30]. To train the PGGAN with body CT images, the original lower lung groups; and 50 chest-M and 50 AP-CT images were
12-bit grayscale CT images were converted into 8-bit grayscale divided into thorax, thoracoabdominal junction, abdomen, and
potable network graphics images with 3 different windowing pelvis groups. To avoid any selection bias, all synthetic images
settings: (1) a lung setting (window width 1500, window level in the validation set were automatically generated by the
600), (2) a mediastinal setting (window width 450, window PGGAN model and were not individually selected by the
level 50) for chest CT images, and (3) a multiorgan setting researchers. For the real images, 50 CT images of each
(window width 350, window level 40) for AP-CT images. anatomical subgroup (ie, chest-L, chest-M, and AP-CT) were
Images from each group with different windowing settings were randomly selected from 50 normal whole-body CT scans
used to train a PGGAN separately. (performed at the emergency department of Asan Medical
Center) by 1 co-researcher (JHY) who did not otherwise
A publicly available official implementation of PGGAN using
participate in the realism assessment study. A website (validct.
Tensorflow in Python was used [31]. While the sizes of the
esy.es) was created to upload the validation set with 300 axial
training images progressively grew from 4×4 to 512×512 (ie,
images posted and displayed in a random manner. Ten
2n×2n, where the integer n increases from 2 to 8), the batch sizes radiologists (4 radiologists with 10 years of experience [Group III])
training process (ie, training losses and generated images) with independently evaluated each of the 300 images slice-by-slice
TensorBoard and intermediated image generation to determine and decided whether each CT image was real or artificial by
whether the PGGAN was properly trained. The PGGAN training visual analysis with no time limit. To investigate the features
was completed after the network had evaluated around 20 of the images with obviously artificial appearance, we defined
million body CT images. The training took ~12.5 days with 2 obviously artificial images as synthetic images that were
NVIDIA Titan RTX graphic processing units for each group identified as artificial by a majority of readers. Two radiologists
with different windowing settings (ie, total training for ~37.5 (HYP and GSH) then visually reviewed these obviously artificial
days). images. To determine whether the radiologists could learn to
Visual Turing Test to Assess the Realistic Nature of distinguish real from synthetic images, we performed an
Synthetic CT Images additional Turing test (postlearning visual Turing test). First, 2
board-certified radiologists (Group III) were educated in the
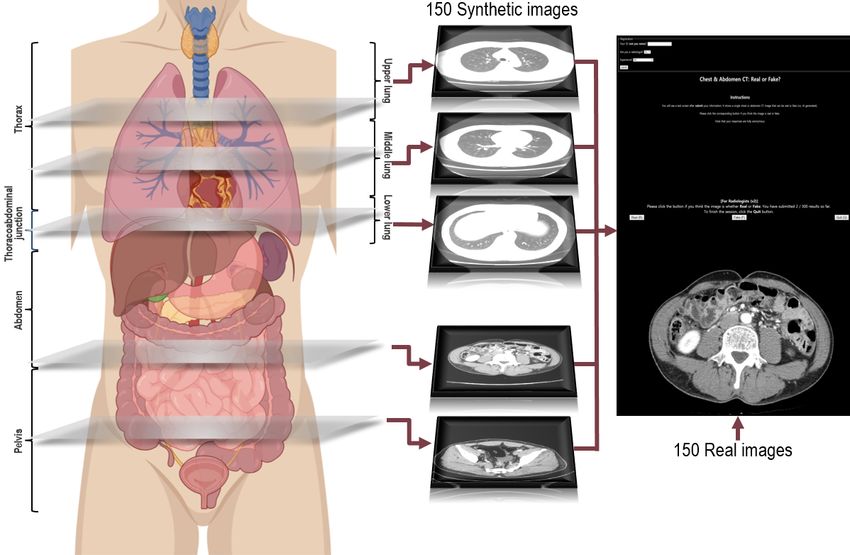
Figure 1 summarizes the study design for the visual assessment obviously artificial findings in the synthetic images (not included
performed using an image Turing test. The validation set in the test set). Then, 2 readers independently decided whether
consisted of 300 axial body CT images (150 synthetic images each of the 300 CT images were real or artificial by visual
and 150 real images). The 150 synthetic images comprised 50 analysis. For accurate comparison of the results, the same test
chest CT-lung window (chest-L), 50 chest CT-mediastinal set as the index visual Turing test was used.
window (chest-M), and 50 AP-CT images. The validation set
https://medinform.jmir.org/2021/3/e23328 JMIR Med Inform 2021 | vol. 9 | iss. 3 | e23328 | p. 3
(page number not for citation purposes)
XSL• FO
RenderXJMIR MEDICAL INFORMATICS Park et al
Figure 1. Graphical illustration of the method used to estimate the realism of the synthetic body computed tomography images. The validation set
consisted of 150 synthetic and 150 real images. Synthetic images generated by the progressive growing generative adversarial network model and real
images were randomly mixed and displayed on the website. Ten readers independently determined whether each image was real or artificial.
Interreader agreement was evaluated using Fleiss kappa. To
Statistical Analyses identify obviously artificial images, a histogram analysis was
The mean accuracy, sensitivity, and specificity of the 10 readers used to display the distribution of the number of correct answers
were calculated. The generalized estimating equations method from the 10 readers (ie, identification of synthetic images as
was used to test whether the ratio of mean accuracy and random artificial) and the number of artificial images. The cut-off values
guessing was 1. The generalized estimating equations were used (ie, percentage of readers with correct answers) were set where
to compare the accuracy, sensitivity, and specificity across the dramatic changes in the histogram distribution was observed.
reader groups with different experience levels (Group I, Group When a cut-off ≥70% was used for chest-L and ≥80% for
II, and Group III) and across the anatomical subgroups. To chest-M and AP-CT images, 1 subgroup (ie, upper lung for
compare the diagnostic performance among subgroups, chest-L chest-L and thoracoabdominal junction for chest-M and AP-CT
was classified into 3 image subgroups (upper, middle, and lower images) had the highest number of readers with correct answers.
lung), and chest-M and AP-CT images were grouped into 4 In the postlearning visual Turing test, the mean accuracy,
image subgroups (thorax, thoracoabdominal junction, abdomen, sensitivity, and specificity of the 2 readers were calculated.
and pelvis) on the basis of anatomical structures by visual SPSS software (version 23, IBM Corp) and R version 3.5.3
inspection. The anatomical landmarks used in subgrouping of (R Foundation for Statistical Computing) were used for the
CT-L were as follows: (1) upper lung: apex to upper border of statistical analyses with the significance level set at PJMIR MEDICAL INFORMATICS Park et al
different experience levels (Group I, 696/1200, 58.0%; Group between the upper, middle, and lower lung groups of the chest-L
II, 726/1200, 60.5%; and Group III, 359/600, 59.8%; P=.36). images (upper lung, 227/370, 61.4%; middle lung, 190/290,
In the detection of synthetic images, Group III showed a 65.5%; and lower lung, 136/240, 56.7%, P=.36). The
significantly lower specificity than Group II (P=.01) but did thoracoabdominal junction showed a significantly higher
not show a significant difference from Group I (P=.30). accuracy (208/280, 74.3% vs 194/370, 52.4% to 361/600,
Multimedia Appendix 4 summarizes the results of the subgroup 60.2%; P=.004) and specificity (154/200, 77.0% vs 93/220,
analysis of the realism assessment according to the anatomical 42.3% to 149/250, 59.6%; PJMIR MEDICAL INFORMATICS Park et al
Figure 2. Synthetic high-resolution body computed tomography images. A. Chest computed tomography images-lung window. B. Chest computed
tomography images-mediastinal window. C. Abdominopelvic computed tomography images.
In the postlearning visual Turing test, the mean accuracy, Interreader Agreement for Synthetic and Real Images
sensitivity, and specificity of the 2 radiologists were 67.3%, Interreader agreement was poor for the entire image set (κ=0.11)
72.7%, and 62.0%, respectively. Compared with the results of and for the 3 CT subsets (chest-L, chest-M, and AP-CT;
the index visual Turing test, the accuracy was increased by 7.5% κ=0.04-0.13). Interreader agreement was higher for the
and the specificity was increased by 10.1% in the postlearning thoracoabdominal junction subset than for the other anatomical
visual Turing test. regions (κ=0.31 vs 0.03-0.14) (Table 2).
https://medinform.jmir.org/2021/3/e23328 JMIR Med Inform 2021 | vol. 9 | iss. 3 | e23328 | p. 6
(page number not for citation purposes)
XSL• FO
RenderXJMIR MEDICAL INFORMATICS Park et al
Table 2. Interreader agreement of the 10 readers with respect to the imaging subgroups.
Image type, subsets Kappa values 95% CI
Entire image set 0.11 0.09 to 0.13
Image subsets
Chest-La 0.04 0.01 to 0.07
Chest-Mb 0.13 0.10 to 0.15
AP-CTc 0.11 0.08 to 0.14
Chest-L
Upper lung 0.04 –0.01 to 0.09
Middle lung 0.01 –0.04 to 0.07
Lower lung 0.06 0.00 to 0.12
Chest-M and AP-CT
Thorax 0.03 –0.01 to 0.06
Thoracoabdominal junction 0.31 0.25 to 0.36
Abdomen 0.14 0.10 to 0.18
Pelvis 0.03 –0.02 to 0.08
a
Chest-L: chest computed tomography images-lung window.
b
Chest-M: chest computed tomography images-mediastinal window.
c
AP-CT: abdominopelvic computed tomography images.
features indicative of synthetic CT images. A total of 34 artificial
Analysis of the Features of Obviously Artificial Images features were found in the 24 synthetic images, the most
Figure 3 shows that the majority of readers characterized the common being vascular structures (24/34, 71%), followed by
synthetic images as artificial predominantly at the movable organs (ie, stomach, heart, small bowel, and
thoracoabdominal junction of the chest-M and AP-CT, followed mediastinal fat around the heart, 8/34, 24%). Among the
by the upper lung of the chest-L. Using a histogram analysis, vascular structures, intrahepatic vessels (ie, portal and hepatic
24 of the 150 synthetic images (22 images of the chest-M and veins) most frequently had abnormal configurations, directions,
AP-CT groups and 2 images of the upper lung) were selected or diameters (Figure 4). In case of the movable organs, an
and reviewed by 2 radiologists to identify the features indicating abnormal organ contour was the main feature indicative of an
that the images were artificial. Table 3 details the artificial artificially generated image (Figure 4C and Figure 4D).
https://medinform.jmir.org/2021/3/e23328 JMIR Med Inform 2021 | vol. 9 | iss. 3 | e23328 | p. 7
(page number not for citation purposes)
XSL• FO
RenderXJMIR MEDICAL INFORMATICS Park et al
Figure 3. Histogram analysis of the correct answers for the 150 synthetic images (accurate identification of the artificial images) by the 10 readers. A.
When a cut-off for the percentage of readers with correct answers was set at ≥70% for the chest computed tomography-lung window group, only 1
subgroup (upper lung) remained (§). B. When a cut-off level for the percentage of readers with correct answers was set at ≥80% for the chest computed
tomography-mediastinal window and abdominopelvic computed tomography groups, the thoracoabdominal (TA) junction group (*) showed dominance
over the other subgroups.
Table 3. Details of the obviously artificial body computed tomography images.
Configuration, artificial features Images (n)
Abnormal vascular configurationa
Hepatic vessel (portal vein and hepatic vein) 13
Gastric vessel 3
Mesenteric vessel 2
Pulmonary vessel 2
Others (peripancreatic, coronary, rectal, axillary vessel) 4
Abnormal contour or structureb
Stomach 3
Pancreas 2
Heart 2
Mediastinal fat around the heart 2
Small bowel 1
a
Ill-defined vascular margin, bizarre vascular course, or abnormal vascular diameter.
b
Blurred margin of the organ, or bizarre structure of the soft tissue.
https://medinform.jmir.org/2021/3/e23328 JMIR Med Inform 2021 | vol. 9 | iss. 3 | e23328 | p. 8
(page number not for citation purposes)
XSL• FO
RenderXJMIR MEDICAL INFORMATICS Park et al
Figure 4. Obviously artificial body computed tomography images. A. Ill-defined margins and abnormal courses of intrahepatic vessels (arrows) in the
liver. Note curvilinear structures (dotted rectangle) at the liver and stomach. B. Accentuated vascular markings in both upper lung apices (arrows). C.
Abnormal infiltration in the pericardial fat (arrows). D. Irregular contours of the stomach body and antrum with blurred margins (arrows).
synthetic images as fake, the readers’ performance was not
Discussion much better than random guessing. For robust validation, using
Principal Findings real CT images from other medical institutions (not experienced
by the readers) in the validation set could be needed. Despite
We showed that the GAN-based synthetic whole-body CT this limitation, our data suggest that the synthetic images are
images have comparable image fidelity to real images. For this, highly realistic and indistinguishable from real CT images.
our study validated the synthetic images by multiple radiology
experts because the visual Turing test could be greatly One critical finding of this study was that the discrepancies
influenced by the reader’s level of expertise [10,32,33]. There between real and synthetic CT images occur mainly in the
was no significant difference in the accuracy between the reader thoracoabdominal junction and in anatomical details. The
groups. In addition, the interreader agreement was poor for the thoracoabdominal junction is the most prone to motion artifacts
distinction between real and synthetic images. These results due to respiratory movement. In addition, it has a complex
imply that a validation test was properly performed with anatomical structure due to multiple organs in small spaces [34].
mitigation of the impact of the reader’s level of expertise. These features of the thoracoabdominal junction might have
However, there was quite a significant disparity between contributed to the identification of unrealistic synthetic body
sensitivity (66.8%) and specificity (51.9%). We presume that images. This phenomenon in the areas with complex structures
this is mainly due to factors affecting reader performance test. has been shown in other image syntheses using GANs [27,28].
First, all readers had at least some exposure to real body CT It is worth noting that this study showed that GAN achieved
images in clinical practice. In addition, the real images in the highly realistic images for gross anatomy and not for detailed
validation data set consisted of relatively uniform CT images anatomical structures. The most common obviously artificial
because they were acquired using a similar CT machine with features in synthetic images were bizarre configurations and
similar acquisition parameters. These factors affect the readers’ directions of small-to-medium vessels. This is probably due to
confidence and decisions to identify real images, resulting in the lack of the interslice shape continuity caused by the 2D CT
high sensitivity. This is supported by the fact that the sensitivity image–training and the anatomical diversity of these vessels
proposed here reached 72.3% in Group III (radiologists with [10,35]. Therefore, to overcome these limitations, further work
long-term exposure to real CT images in our institution). In would require the generation of 3D CT images with larger and
contrast, some obviously artificial features (eg, the ill-defined more diverse data sets. The second most obviously artificial
margin of the heart) in synthetic images are similar to the motion feature was an abnormal contour of the movable organs. This
artifacts or noises in real images. This can cause reader could be another limitation in the GAN-based realistic image
confusion, resulting in lower specificity. In addition, the mean synthesis. Recently, more powerful GAN models have been
accuracy (59.4%) was higher than random guessing (50%); introduced into the medical field. We believe that many
however, it is believed that the high sensitivity contributed problems raised here can serve as criteria to test the performance
significantly to this result. Therefore, in terms of identifying of the newly introduced GAN models.
https://medinform.jmir.org/2021/3/e23328 JMIR Med Inform 2021 | vol. 9 | iss. 3 | e23328 | p. 9
(page number not for citation purposes)
XSL• FO
RenderXJMIR MEDICAL INFORMATICS Park et al
As expected, learning artificial features in the synthetic images medical images by expert radiologists. This study will provide
improved the performance of radiologists in identifying artificial readers a way to follow our approach and to achieve advances
images. However, it did not reach our expectations. This is in anomaly detection tasks in medical imaging. Second, our
because artificial features occurred mainly in some images of training data are not enough to cover the probability distribution
certain anatomical subgroups. In addition, as mentioned before, of normal data. This preliminary study used normal CT images
it is not easy for radiologists to distinguish these artificial from our institution. The training data consisted of relatively
features from motion artifacts or noise in real images. homogeneous CT images with similar acquisition parameters
Furthermore, our visual Turing tests were based on reviewing and CT machines. Therefore, further studies should focus on
2D synthetic CT slices. However, although 3D data (eg, CT) the collection of multi-center and multi-country diverse CT data
are presented as 2D images, human perception of an anomaly to achieve better results. Third, due to limited graphics
is based on the imagination of space from 2D images. These processing unit memory, our study only validated the realistic
factors could make it difficult to determine whether each CT nature of separate 2D high-resolution body CT slices that were
image is real or artificial. randomly generated by the GAN. This study did not handle 3D
synthetic CT images, although real body CT images are
Comparison With Prior Work volumetric data. Therefore, interslice continuity of pathologic
Bermudez et al [36] reported that GAN can successfully generate lesions and organs may be a crucial factor for improving the
realistic brain MR images. However, unlike this study, the performance of deep learning–based models. Further studies
previous GAN-based unconditional synthesis of advanced are needed to generate and validate 2.5D or 3D synthetic CT
radiological images (CT or magnetic resonance images) has images in terms of detailed anatomical structures. Fourth, the
been confined to some specific pathologic lesions (eg, lung and number of synthetic images in the validation set varied between
liver lesions) and specific organs (eg, heart and brain) for a each anatomical region; thus, the statistical power may have
variety of purposes [8,36-40]. In contrast, this study shows that been insufficient. However, we tried to avoid any
realistic high-resolution (512×512 pixels) whole-body CT researcher-associated selection bias in this process. Finally, we
images can be synthesized by GAN. GAN was trained with did not evaluate the correlation between the number of CT
whole-body CT images (512×512 pixels) in this study; therefore, images in the training set and the generation of realistic images
the model learned the semantics of the images. It is worth noting in the validation set. Our study showed that the PGGAN can
that the generated images cover a wide range of 2-dimensional successfully produce realistic body CT images by using a much
(2D) slice CT images along the z-axis from the thorax to the smaller amount of training data in contrast to previous studies
pelvis and contain multiple organs. To the best of our on the generation of celebrity face images with 1K pixels by
knowledge, there has been no study that has investigated and 1K pixels [28,29]. However, we did not provide a cut-off value
validated the unsupervised synthesis of highly realistic body for the number of CT images required to generate realistic
CT images by using a PGGAN. images. Therefore, further studies are needed to clarify the
approximate data set size required for the generation of highly
Limitations
realistic normal or disease-state CT images.
Our study had some limitations. First, technical novelty is
lacking in this study. However, while state-of-the-art GAN Conclusions
models such as PGGAN and StyleGAN were introduced GAN can synthesize highly realistic high-resolution body CT
recently, there are still limited studies in the medical domain images indistinguishable from real images; however, it has
and a lack of published studies on anomaly detection tasks. As limitations in generating body images in the thoracoabdominal
far as we know, this is the first attempt to generate high-quality junction and lacks accuracy in anatomical details.
medical images (whole-body CT) and to validate the generated
Acknowledgments
The authors are grateful to Ju Hee Lee, MD, Hyun Jung Koo, MD, Jung Hee Son, MD, Ji Hun Kang, MD, Jooae Choe, MD, Mi
Yeon Park, MD, Se Jin Choi, MD, and Yura Ahn, MD, for participating as readers. This work was supported by the National
Research Foundation of Korea (NRF-2018R1C1B6006371 to GS Hong). The data sets are not publicly available due to restrictions
in the data-sharing agreements with the data sources. Ethical approval for the use of the deidentified slides in this study was
granted by the Institutional Review Board of the Asan Medical Center.
Authors' Contributions
HYP wrote the original draft, analyzed the data, and performed formal analysis. HJB wrote the original draft and provided technical
guidance for the project. GSH and NKK conceptualized the project and provided the methodology for the project. All authors
reviewed the final manuscript.
Conflicts of Interest
None declared.
https://medinform.jmir.org/2021/3/e23328 JMIR Med Inform 2021 | vol. 9 | iss. 3 | e23328 | p. 10
(page number not for citation purposes)
XSL• FO
RenderXJMIR MEDICAL INFORMATICS Park et al
Multimedia Appendix 1
Example video of the multi-level random generation of synthetic chest computed tomography-lung window by the progressive
growing generative adversarial network.
[MP4 File (MP4 Video), 34971 KB-Multimedia Appendix 1]
Multimedia Appendix 2
Example video of the multi-level random generation of synthetic chest computed tomography-mediastinal window by the
progressive growing generative adversarial network.
[MP4 File (MP4 Video), 35117 KB-Multimedia Appendix 2]
Multimedia Appendix 3
Example video of the multi-level random generation of synthetic abdominopelvic computed tomography images by the progressive
growing generative adversarial network.
[MP4 File (MP4 Video), 34476 KB-Multimedia Appendix 3]
Multimedia Appendix 4
Subgroup analysis of diagnostic performance with respect to the anatomical subgroups. A. Accuracy, B. Sensitivity, C. Specificity.
There was a significant difference in accuracy (*) and specificity (†) between the thoracoabdominal junction (TA) and other
image subgroups. Chest-L: chest computed tomography-lung window; chest-M: chest computed tomography-mediastinal window;
AP-CT: abdominopelvic computed tomography.
[PNG File , 152 KB-Multimedia Appendix 4]
References
1. Sorin V, Barash Y, Konen E, Klang E. Creating Artificial Images for Radiology Applications Using Generative Adversarial
Networks (GANs) - A Systematic Review. Acad Radiol 2020 Aug;27(8):1175-1185. [doi: 10.1016/j.acra.2019.12.024]
[Medline: 32035758]
2. Chartrand G, Cheng PM, Vorontsov E, Drozdzal M, Turcotte S, Pal CJ, et al. Deep Learning: A Primer for Radiologists.
Radiographics 2017;37(7):2113-2131. [doi: 10.1148/rg.2017170077] [Medline: 29131760]
3. Ker J, Wang L, Rao J, Lim T. Deep Learning Applications in Medical Image Analysis. IEEE Access 2018;6:9375-9389
[FREE Full text] [doi: 10.1109/ACCESS.2017.2788044]
4. Lee J, Jun S, Cho Y, Lee H, Kim GB, Seo JB, et al. Deep Learning in Medical Imaging: General Overview. Korean J Radiol
2017;18(4):570-584 [FREE Full text] [doi: 10.3348/kjr.2017.18.4.570] [Medline: 28670152]
5. Miotto R, Wang F, Wang S, Jiang X, Dudley JT. Deep learning for healthcare: review, opportunities and challenges. Brief
Bioinform 2018 Nov 27;19(6):1236-1246 [FREE Full text] [doi: 10.1093/bib/bbx044] [Medline: 28481991]
6. Kazeminia S, Baur C, Kuijper A, van Ginneken B, Navab N, Albarqouni S, et al. GANs for medical image analysis. Artificial
Intelligence in Medicine 2020 Sep;109:101938. [doi: 10.1016/j.artmed.2020.101938]
7. Yi X, Walia E, Babyn P. Generative adversarial network in medical imaging: A review. Med Image Anal 2019
Dec;58:101552. [doi: 10.1016/j.media.2019.101552] [Medline: 31521965]
8. Frid-Adar M, Diamant I, Klang E, Amitai M, Goldberger J, Greenspan H. GAN-based synthetic medical image augmentation
for increased CNN performance in liver lesion classification. Neurocomputing 2018 Dec;321:321-331. [doi:
10.1016/j.neucom.2018.09.013]
9. Gadermayr M, Li K, Müller M, Truhn D, Krämer N, Merhof D, et al. Domain-specific data augmentation for segmenting
MR images of fatty infiltrated human thighs with neural networks. J Magn Reson Imaging 2019 Jun;49(6):1676-1683. [doi:
10.1002/jmri.26544] [Medline: 30623506]
10. Kazuhiro K, Werner R, Toriumi F, Javadi M, Pomper M, Solnes L, et al. Generative Adversarial Networks for the Creation
of Realistic Artificial Brain Magnetic Resonance Images. Tomography 2018 Dec;4(4):159-163 [FREE Full text] [doi:
10.18383/j.tom.2018.00042] [Medline: 30588501]
11. Russ T, Goerttler S, Schnurr A, Bauer DF, Hatamikia S, Schad LR, et al. Synthesis of CT images from digital body phantoms
using CycleGAN. Int J Comput Assist Radiol Surg 2019 Oct;14(10):1741-1750. [doi: 10.1007/s11548-019-02042-9]
[Medline: 31378841]
12. Ben-Cohen A, Klang E, Raskin SP, Soffer S, Ben-Haim S, Konen E, et al. Cross-modality synthesis from CT to PET using
FCN and GAN networks for improved automated lesion detection. Engineering Applications of Artificial Intelligence 2019
Feb;78:186-194. [doi: 10.1016/j.engappai.2018.11.013]
13. Dar SU, Yurt M, Karacan L, Erdem A, Erdem E, Cukur T. Image Synthesis in Multi-Contrast MRI With Conditional
Generative Adversarial Networks. IEEE Trans. Med. Imaging 2019 Oct;38(10):2375-2388. [doi: 10.1109/tmi.2019.2901750]
https://medinform.jmir.org/2021/3/e23328 JMIR Med Inform 2021 | vol. 9 | iss. 3 | e23328 | p. 11
(page number not for citation purposes)
XSL• FO
RenderXJMIR MEDICAL INFORMATICS Park et al
14. Jiang J, Hu Y, Tyagi N, Zhang P, Rimner A, Deasy JO, et al. Cross-modality (CT-MRI) prior augmented deep learning for
robust lung tumor segmentation from small MR datasets. Med Phys 2019 Oct;46(10):4392-4404 [FREE Full text] [doi:
10.1002/mp.13695] [Medline: 31274206]
15. Lei Y, Harms J, Wang T, Liu Y, Shu H, Jani AB, et al. MRI-only based synthetic CT generation using dense cycle consistent
generative adversarial networks. Med Phys 2019 Aug;46(8):3565-3581 [FREE Full text] [doi: 10.1002/mp.13617] [Medline:
31112304]
16. Vitale S, Orlando JI, Iarussi E, Larrabide I. Improving realism in patient-specific abdominal ultrasound simulation using
CycleGANs. Int J Comput Assist Radiol Surg 2020 Feb;15(2):183-192. [doi: 10.1007/s11548-019-02046-5] [Medline:
31392671]
17. Kang E, Koo HJ, Yang DH, Seo JB, Ye JC. Cycle-consistent adversarial denoising network for multiphase coronary CT
angiography. Med Phys 2019 Feb;46(2):550-562. [doi: 10.1002/mp.13284] [Medline: 30449055]
18. Kim KH, Do W, Park S. Improving resolution of MR images with an adversarial network incorporating images with different
contrast. Med Phys 2018 Jul;45(7):3120-3131. [doi: 10.1002/mp.12945] [Medline: 29729006]
19. Liang X, Chen L, Nguyen D, Zhou Z, Gu X, Yang M, et al. Generating synthesized computed tomography (CT) from
cone-beam computed tomography (CBCT) using CycleGAN for adaptive radiation therapy. Phys Med Biol 2019 Jun
10;64(12):125002. [doi: 10.1088/1361-6560/ab22f9] [Medline: 31108465]
20. You C, Cong W, Wang G, Yang Q, Shan H, Gjesteby L, et al. Structurally-Sensitive Multi-Scale Deep Neural Network
for Low-Dose CT Denoising. IEEE Access 2018;6:41839-41855. [doi: 10.1109/access.2018.2858196]
21. Dong X, Lei Y, Wang T, Thomas M, Tang L, Curran WJ, et al. Automatic multiorgan segmentation in thorax CT images
using U-net-GAN. Med Phys 2019 May;46(5):2157-2168 [FREE Full text] [doi: 10.1002/mp.13458] [Medline: 30810231]
22. Liu X, Guo S, Zhang H, He K, Mu S, Guo Y, et al. Accurate colorectal tumor segmentation for CT scans based on the label
assignment generative adversarial network. Med Phys 2019 Aug;46(8):3532-3542. [doi: 10.1002/mp.13584] [Medline:
31087327]
23. Seah JCY, Tang JSN, Kitchen A, Gaillard F, Dixon AF. Chest Radiographs in Congestive Heart Failure: Visualizing Neural
Network Learning. Radiology 2019 Feb;290(2):514-522. [doi: 10.1148/radiol.2018180887] [Medline: 30398431]
24. Xue Y, Xu T, Zhang H, Long LR, Huang X. SegAN: Adversarial Network with Multi-scale L Loss for Medical Image
Segmentation. Neuroinformatics 2018 Oct;16(3-4):383-392. [doi: 10.1007/s12021-018-9377-x] [Medline: 29725916]
25. Schlegl T, Seeböck P, Waldstein S, Schmidt-Erfurth U, Langs G. Unsupervised anomaly detection with generative adversarial
networks to guide marker discovery. 2017 Presented at: International conference on information processing in medical
imaging; 25-30 June 2017; Boone, United States. [doi: 10.1007/978-3-319-59050-9_12]
26. Alex V, Chennamsetty S, Krishnamurthi G. Generative adversarial networks for brain lesion detection. 2017 Presented at:
The international society for optics and photonics; 26 February-2 March 2017; San Jose, California, United States. [doi:
10.1117/12.2254487]
27. Radford A, Metz L, Chintala S. Unsupervised representation learning with deep convolutional generative adversarial
networks. arXiv. 2015. URL: https://arxiv.org/abs/1511.06434 [accessed 2021-01-02]
28. Karras T, Aila T, Laine S, Lehtinen J. Progressive growing of GANS for improved quality, stability, and variation. arXiv.
2017. URL: https://arxiv.org/abs/1710.10196 [accessed 2021-01-02]
29. Karras T, Laine S, Aila T. A Style-Based Generator Architecture for Generative Adversarial Networks. IEEE Trans Pattern
Anal Mach Intell 2020 Feb 02;PP. [doi: 10.1109/TPAMI.2020.2970919] [Medline: 32012000]
30. Brock A, Donahue J, Simonyan K. Large scale GAN training for high fidelity natural image synthesis. arXiv. 2019. URL:
https://arxiv.org/abs/1809.11096 [accessed 2021-01-02]
31. Mirsky Y, Mahler T, Shelef I, Elovici Y. CT-GAN: malicious tampering of 3D medical imagery using deep learning. arXiv.
2019. URL: https://arxiv.org/abs/1901.03597 [accessed 2021-01-02]
32. Monnier-Cholley L, Carrat F, Cholley BP, Tubiana J, Arrivé L. Detection of lung cancer on radiographs: receiver operating
characteristic analyses of radiologists', pulmonologists', and anesthesiologists' performance. Radiology 2004
Dec;233(3):799-805. [doi: 10.1148/radiol.2333031478] [Medline: 15486213]
33. Quekel LG, Kessels AG, Goei R, van Engelshoven JM. Detection of lung cancer on the chest radiograph: a study on observer
performance. European Journal of Radiology 2001 Aug;39(2):111-116. [doi: 10.1016/s0720-048x(01)00301-1]
34. Killoran JH, Gerbaudo VH, Mamede M, Ionascu D, Park S, Berbeco R. Motion artifacts occurring at the lung/diaphragm
interface using 4D CT attenuation correction of 4D PET scans. J Appl Clin Med Phys 2011 Nov 15;12(4):3502 [FREE Full
text] [doi: 10.1120/jacmp.v12i4.3502] [Medline: 22089005]
35. Cai J, Lu L, Xing F. Pancreas segmentation in CT and MRI images via domain specific network designing and recurrent
neural contextual learning. arXiv 2018.
36. Bermudez C, Plassard A, Davis L, Newton A, Resnick S, Landman B. Learning Implicit Brain MRI Manifolds with Deep
Learning. Proc SPIE Int Soc Opt Eng 2018 Mar;10574 [FREE Full text] [doi: 10.1117/12.2293515] [Medline: 29887659]
37. Bowles C, Chen L, Guerrero R, Bentley P, Gunn R, Hammers A. Gan augmentation: Augmenting training data using
generative adversarial networks. arXiv 2018.
https://medinform.jmir.org/2021/3/e23328 JMIR Med Inform 2021 | vol. 9 | iss. 3 | e23328 | p. 12
(page number not for citation purposes)
XSL• FO
RenderXJMIR MEDICAL INFORMATICS Park et al
38. Bowles C, Gunn R, Hammers A, Rueckert D. Modelling the progression of Alzheimer's disease in MRI using generative
adversarial networks. Medical Imaging 2018: Image Processing; 2018 Presented at: The international society for optics
and photonics; 25 February-1 March 2018; San Jose, California, United States. [doi: 10.1117/12.2293256]
39. Chuquicusma M, Hussein S, Burt J, Bagci U. How to fool radiologists with generative adversarial networks? a visual turing
test for lung cancer diagnosis. 2018 Presented at: 2018 IEEE 15th international symposium on biomedical imaging; 4-7
April 2018; Washington, D.C. United States. [doi: 10.1109/isbi.2018.8363564]
40. Zhang L, Gooya A, Frangi A. Semi-supervised assessment of incomplete LV coverage in cardiac MRI using generative
adversarial nets. 2017 Presented at: 2017 International Workshop on Simulation and Synthesis in Medical Imaging; 10
September 2017; Québec City, Canada. [doi: 10.1007/978-3-319-68127-6_7]
Abbreviations
AP-CT: abdominopelvic computed tomography
Chest-L: chest computed tomography-lung window
Chest-M: chest computed tomography-mediastinal window
CT: computed tomography
GAN: generative adversarial network
PGGAN: progressive growing generative adversarial network
Edited by C Lovis; submitted 10.08.20; peer-reviewed by HC Lee, H Arabnia; comments to author 21.09.20; revised version received
15.11.20; accepted 20.02.21; published 17.03.21
Please cite as:
Park HY, Bae HJ, Hong GS, Kim M, Yun J, Park S, Chung WJ, Kim N
Realistic High-Resolution Body Computed Tomography Image Synthesis by Using Progressive Growing Generative Adversarial
Network: Visual Turing Test
JMIR Med Inform 2021;9(3):e23328
URL: https://medinform.jmir.org/2021/3/e23328
doi: 10.2196/23328
PMID: 33609339
©Ho Young Park, Hyun-Jin Bae, Gil-Sun Hong, Minjee Kim, JiHye Yun, Sungwon Park, Won Jung Chung, NamKug Kim.
Originally published in JMIR Medical Informatics (http://medinform.jmir.org), 17.03.2021. This is an open-access article
distributed under the terms of the Creative Commons Attribution License (https://creativecommons.org/licenses/by/4.0/), which
permits unrestricted use, distribution, and reproduction in any medium, provided the original work, first published in JMIR
Medical Informatics, is properly cited. The complete bibliographic information, a link to the original publication on
http://medinform.jmir.org/, as well as this copyright and license information must be included.
https://medinform.jmir.org/2021/3/e23328 JMIR Med Inform 2021 | vol. 9 | iss. 3 | e23328 | p. 13
(page number not for citation purposes)
XSL• FO
RenderXYou can also read