Analysis of the Accuracy of AncesTrees Software in Ancestry Estimation in Brazilian Identified Sample
←
→
Page content transcription
If your browser does not render page correctly, please read the page content below
Advances in Anthropology, 2021, 11, 163-178
                                                                                                  https://www.scirp.org/journal/aa
                                                                                                           ISSN Online: 2163-9361
                                                                                                             ISSN Print: 2163-9353

Analysis of the Accuracy of AncesTrees
Software in Ancestry Estimation in Brazilian
Identified Sample

Larissa Chaves Cardoso Fernandes1*, Maria Izabel Cardoso Bento2, Patrícia Moreira Rabello3,
Evelyne Pessoa Soriano4,5, David Navega6, Eduardo Daruge Júnior1, Eugénia Cunha6,7
1
 Department of Forensic Dentistry, Piracicaba Dental School, University of Campinas, Piracicaba, São Paulo, Brazil
2
 Department of Social Dentistry, Faculty of Dentistry, University of São Paulo, São Paulo, São Paulo, Brazil
3
 Department of Clinical and Social Dentistry, Federal University of Paraíba, João Pessoa, Paraíba, Brazil
4
 Center for Studies in Forensic Anthropology, University of Pernambuco, Camaragibe, Pernambuco, Brazil
5
 Department of Forensic Medicine and Dentistry, Scientific Police Institute of Paraíba, João Pessoa, Paraíba, Brazil
6
 Department of Life Sciences, Laboratory of Forensic Anthropology, Centre for Functional Ecology, University of Coimbra,
Coimbra, Portugal
7
 National Institute of Legal Medicine and Forensic Sciences, Lisbon, Portugal

How to cite this paper: Fernandes, L. C.        Abstract
C., Bento, M. I. C., Rabello, P. M., Soriano,
E. P., Navega, D., Daruge Júnior, E., &         In the present study a software tool for craniometric ancestry estimation, An-
Cunha, E. (2021). Analysis of the Accuracy      cesTrees, was evaluated in an identified Brazilian skeletal sample with known
of AncesTrees Software in Ancestry Esti-        self-reported ancestry. Twenty-three craniometric measures were obtained
mation in Brazilian Identified Sample.
Advances in Anthropology, 11, 163-178.
                                                from each skull and analyzed using AncesTrees software, with two classification
https://doi.org/10.4236/aa.2021.112011          strategies—tournamentForest and ancestralForest algorithm. The tournament-
                                                Forest (53.54%) and ancestralForest algorithms with three ancestry groups
Received: March 3, 2021                         (50.96%) were more accurate to classify Europeans, while the ancestralForest
Accepted: May 8, 2021
                                                algorithm with six (50.00%) and two (67.64%) groups were more accurate to
Published: May 11, 2021
                                                estimate the ancestry of African descents. Admixed ancestry specimens were
Copyright © 2021 by author(s) and               classified predominantly as European descent. The use of the ancestralForest
Scientific Research Publishing Inc.             algorithm considering only European and African origin (58.42%) was the
This work is licensed under the Creative
                                                most accurate setup for ancestry estimation in Brazilian skulls. Supervised clas-
Commons Attribution International
License (CC BY 4.0).                            sification algorithms and tools such as the AncesTrees work based on data
http://creativecommons.org/licenses/by/4.0/     analysis and pattern matching, and there is no Brazilian sample in its database,
                Open Access                     the software showed a low accuracy Brazilian samples. The incorporation of
                                                representative craniometric data obtained from Brazilian skulls into the soft-
                                                ware database may significantly increase the accuracy of ancestry estimates.

                                                Keywords
                                                Forensic Anthropology, Population Data, Craniometry, Ancestry Estimation,

DOI: 10.4236/aa.2021.112011 May 11, 2021                          163                                   Advances in Anthropology
L. C. C. Fernandes et al.
Brazil
1. Introduction
Several programs and software tools have been developed in recent years to
tackle the challenging task of ancestry estimation from skeletal remains in foren-
sic anthropology (FA). These computational tools make use of statistical and
machine learning algorithms to solve a mathematical problem that abstractly
speaking involves allocate objects to predefined classes hence the name classifi-
ers or classification algorithms. Such software and computer programs abstract
the modelling and computation from end-user and render complex mathemati-
cal formulas easy to use through graphical user interfaces. Some prime examples
of such tools are FORDISC (Ousley & Jantz, 2013), CRANID (Wright, 1992),
COLIPR (Urbanová & Králík, 2008), 3D-ID (Slice & Ross, 2009) and AncesTrees
(Navega et al., 2015). The latter, which will be the focus of the present study, was
developed in 2015 by Portuguese researchers to quantitatively estimate ancestry
based on 23 craniometric measures. This tool classifies the human skull using
the random forest algorithm (Breiman, 2001), a non-linear and non-parametric
ensemble-based classification technique that uses hundreds to thousands of clas-
sification decision trees as base models.
One fundamental disadvantage and transversal issue of these methodologies
and tools is the lack of reference data for each population worldwide resulting
inevitably in lower accuracy for individuals from geographic regions that are not
fully represented in the software databases (Cunha & Ubelaker, 2020; Kranioti et
al., 2019). In its current state AncesTrees uses as reference database a large
worldwide sample of craniometric data from individuals from major popula-
tional clusters. Nonetheless, no individual of Brazilian origin is represented in
the software which raises obvious question regarding its accuracy as a tool for
ancestry estimation in Brazil.
Brazil is a country of continental dimensions with one of the most heteroge-
neous population worldwide. Brazilian miscegenation and admixture are the re-
sult of economic, migratory, and ethnic-racial interrelationships, especially be-
tween ethnic groups of African, European and American Indian (Amerindian)
ancestry (Carvalho-Silva et al., 2001), which makes it unique and highly regiona-
lized (Cuzzullin et al., 2020; Tinoco et al., 2016). The systematic development
and curation of identified osteological collections in Brazil have provided in re-
cent years a more reliable source of skeletal remains for the study of Brazilian
population fostering development and advances in forensic anthropology both
nation and worldwide (Cunha et al., 2018; de Carvalho et al., 2020). These ref-
erence collections enable the systematic and rigorous analysis of published and
available methods or protocols, which is vital to guarantee the accuracy and re-
liability of forensic analysis.
DOI: 10.4236/aa.2021.112011 164 Advances in AnthropologyL. C. C. Fernandes et al.
In this study, we assess accuracy of the AncesTrees software to estimate ance-
stry in a large sample of modern Brazilian identified human skulls of mul-
ti-ancestral origin. The significance of ancestry as a fundamental parameter of
the biological profile in forensic identification and the complex populational
structure of Brazil utters urgency in the validation of the tools available to foren-
sic experts.
2. Materials and Methods
2.1. Skeletal Sample
In the current study the skull of 266 identified Brazilian nationals were analyzed
to assess the accuracy of a craniometric ancestry estimation tool. The study sam-
ple was composed by 144 males and 122 females, with known age-at-death be-
tween 20 to 100 years old. Self-reported ancestry was obtained from official do-
cumentation with 155 individuals reporting as European descent, 34 as African
descent, 76 of admixed ancestry (n = 76) and one individual of Asian descent.
All demographic information was collected according to death certificate, an
official document required for inhumation in Brazil (Cunha et al., 2018). The
individuals under study were sampled from the Osteological and Tomographic
Collection—Prof. Dr. Eduardo Daruge at Piracicaba Dental School, University of
Campinas (FOP/UNICAMP), São Paulo, Brazil. The skeletal remains that com-
pose this collection were obtained from a cemetery in the city of Campinas, São
Paulo, Brazil. All individual skulls under study showed no sign of pathological
conditions of any kind and presented an excellent state of preservation. A more
detailed analysis of the sample is available under the Results section.
2.2. Methods
Twenty-three measures were obtained from each skull according to the study by
Howells and as recommended by the AncesTrees software (Table 1) (Howells,
1973, 1989, 1994; Navega et al., 2015). In the case of bilateral structures, the
left-side measurement was selected. The measurements were performed using a
digital sliding caliper (Stainless-Hardened®—150 mm, Mauá, São Paulo, Brazil)
and a digital spreading caliper with rounded ends (iGaging® Precision Tools-
8’’—35-OD8, Brazil). To ensure instrument precision and data acquisition relia-
bility both calipers were re-calibrated (zeroed) after each measurement has been
taken.
A pilot study was previously carried to assess intra-observer measurement er-
ror. Forty-two skulls from the osteological collection were examined before and
after a seven-day interval. Pairwise comparisons showed no significant variabili-
ty between the measurements (p > 0.05) (paired Student’s t test) regarding all
study variables. A means comparison test of 0.86 was obtained, indicating ade-
quate intra-examiner agreement. The 42 skulls analyzed preliminarily were also
included in the final sample (n = 266).
The collected data were inserted into the AncesTrees software, an open-source
DOI: 10.4236/aa.2021.112011 165 Advances in AnthropologyL. C. C. Fernandes et al.
Table 1. Craniofacial measures used in the study. Detailed measurement definition
available at Howells (1973).
Measurement Abbreviation Instrument
Glabello-occipital length GOL Spreading caliper
Basion-bregma height BBH Spreading caliper
Maximum cranial breadth XCB Spreading caliper
Nasion-prosthion height NPH Sliding caliper
Maximum frontal breadth XFB Sliding caliper
Bifrontal breadth FMB Sliding caliper
Bizygomatic breadth ZYB Sliding caliper
Basion-nasion length BNL Spreading caliper
Basion-prosthion length BPL Sliding caliper
Biauricular breadth AUB Sliding caliper
Palate breadth MAB Sliding caliper
Foramen magnum length FOL Sliding caliper
Nasal height NLH Sliding caliper
Nasal breadth NLB Sliding caliper
Biorbital breadth EKB Sliding caliper
Inter-orbital breadth DKB Sliding caliper
Orbital height OBH Sliding caliper
Orbital breadth OBB Sliding caliper
Mastoid height MDH Sliding caliper
Mastoid breadth MDB Sliding caliper
Nasion-bregma chord FRC Sliding caliper
Bregma-lambda chord PAC Sliding caliper
Lambda-opisthion chord OCC Sliding caliper
statistical program available from http://osteomics.com/AncesTrees/. After data
entry, the “validation” tab was clicked to check for validity of the measurements
or for re-assessment of the values that were very divergent from the mean. Sub-
sequently, the algorithm (ancestralForest or tournamentForest) was chosen in
the “analysis” tab, and the algorithm setup was determined according to com-
putational and statistical parameters.
The tournamentForest algorithm has a more automated approach and differs
from the ancestralForest algorithm for being classified according to round-robin
tournaments, in which the best binary classifier is selected. This algorithm fol-
lows a division-and-conquest approach; after each round of the tournament, the
ancestry group with less affinity with the skull under analysis is discarded, until
only two possible ethnic groups remain. As the tournamentForest algorithm is
more suitable for cases in which there is little or no prior knowledge about the
DOI: 10.4236/aa.2021.112011 166 Advances in AnthropologyL. C. C. Fernandes et al.
likely ancestry group (Navega et al., 2015), the software was set up to consider
512 trees and all nine available ancestry patterns.
The second tested algorithm was the ancestralForest, which analyzes the like-
lihood of the skull under analysis matching the selected ancestry groups (Navega
et al., 2015). The software was set up (number of trees: 512; number of sub-fo-
rests: 32; bootstrap fraction: 63.2%; balanced bootstrap; no bootstrap with re-
placement; pseudo-random number generator seed: 1989; and parallel = TRUE)
and tested on three different scenarios according to the selected ancestry groups.
With the first algorithm, nine ancestry groups were tested (Northern Asia &
Arctic, North & South America, Europe, Northeast Africa, Sub-Saharan Africa,
South Asia, East & Southeast Asia, Polynesia and Australia & Melanesia) from
six geographic origins (Asia, America, Europe, Africa, Polynesia and Australia).
With the second algorithm, only the groups from Asia, Africa and Europe were
selected. In a third setup, only the African and European ancestry groups were
selected.
After validating the model parameters, the predicted ancestry was that which
ranked the first place in the tournamentForest algorithm tournament and that
was the most likely outcome in the ancestralForest algorithm. The ancestry es-
timate was compared against the known ancestry obtained from the death cer-
tificate. The accuracy of the methods in identifying the ancestry of Brazilian
skulls was calculated based on the classification of Europeans, Africans, and
Asians into their corresponding group. Due to the high miscegenation of
mixed-ancestry samples and because they do not fit into any of the ancestry
groups available in the AncesTrees software database, they were analyzed sepa-
rately to avoid bias following Jacometti (2018) protocol.
The data were analyzed descriptively and by statistical tests using SPSS 23
(SPSS Inc., Chicago, IL, USA). The data showed a normal distribution curve
(Kolmogorov-Smirnov test), and pairwise comparisons between mean mea-
surements were carried out by one-way ANOVA followed by Tukey HSD post-hoc
test. Chi-Square and Chi-Square test with Yates correction were used to check
for an association between the known vs. estimated ancestry, considering a 0.05
significance level.
3. Results
Of the 266 skulls analyzed, 144 (54.10%) were males, aged 20 to 100 years at
death (mean age of 60.53 ± 17.50 years). Males and females had a mean age of
57.29 (±16.55) and 64.36 (±17.90) years, respectively, with significant difference
between them (p-value = 0.001; Student’s t test). Known ancestry was self-reported
as European (n = 155; 58.30%), African (n = 34; 12.80%), Mixed (n = 76;
28.60%) and Asian (n = 1; 0.30%). Table 2 shows the distribution of sex and age
per ancestry group in the study sample.
As seen in Table 3, the morphometric variables (mean, standard-deviation,
and maximum and minimum values) were compared according to ancestry
DOI: 10.4236/aa.2021.112011 167 Advances in AnthropologyL. C. C. Fernandes et al.
Table 2. Distribution of sex and age per ancestry group in cataloged Brazilian human
skulls.
Ancestry
Variable Category European African Mixed ancestry Asian p-value
(n = 155) (n = 34) (n = 76) (n = 1)
Male 86 (59.70%) 14 (9.70%) 43 (29.90%) 1 (0.70%)
Sex 0.306(1)
Female 69 (56.60%) 20 (16.40%) 33 (27.00%) 0 (0.00%)
Mean (± SD) 61.32 (17.81) 62.06 (15.18) 58.50 (17.85) 42.00 (-)
Age Minimum 22 20 21 42 0.440(2)
Maximum 97 97 100 42
(SD) Standard deviation. (1) Chi-square test with Yates correction. (2) One-way ANOVA.
Table 3. Distribution of craniometric variables according to ancestry group in Brazilian
human skulls.
European African Admixed
(n = 155) (n = 34) (n = 76)
p-value(1)
Mean ± SD Mean ± SD Mean ± SD
(Range) (Range) (Range)
177.21 ± 8.28 177.92 ± 7.65 176.91 ± 11.40
GOL 0.870
(158.20 - 196.10) (160.60 - 192.20) (158.80 - 194.80)
132.55 ± 6.83 132.53 ± 6.66 132.86 ± 6.40
BBH 0.940
(103.00 - 148.40) (117.70 - 146.20) (118.90 - 147.60)
134.51 ± 7.30 134.11 ± 6.26 135.56 ± 7.03
XCB 0.485
(111.10 - 158.80) (119.00 - 144.30) (118.70 - 151.50)
62.80 ± 6.34 63.00 ± 5.85 63.05 ± 6.19
NPH 0.957
(47.08 - 77.20) (51.84 - 76.78) (49.62 - 76.59)
117.08 ± 6.38 116.38 ± 5.81 118.38 ± 6.26
XFB 0.212
(94.45 - 137.70) (99.36 - 126.48) (104.10 - 133.59)
95.46 ± 5.10 a 98.34 ± 4.68b 96.66 ± 4.43a
FMB 0.005*
(84.93 - 122.29) (90.50 - 111.36) (88.19 - 108.63)
125.67 ± 7.78 125.46 ± 6.45 126.66 ± 7.18
ZYB 0.598
(109.39 - 171.10) (112.59 - 138.91) (102.70 - 140.55)
99.05 ± 9.58 98.66 ± 6.83 97.88 ± 4.44
BNL 0.592
(86.20 - 195.10) (90.20 - 128.10) (88.10 - 109.50)
89.75 ± 7.02 a 93.78 ± 6.05b 91.24 ± 5.62a
BPL 0.004*
(73.42 - 108.73) (79.74 - 108.43) (75.06 - 103.03)
111.27 ± 6.76 111.96 ± 6.21 113.21 ± 5.94
AUB 0.109
(92.57 - 131.83) (100.84 - 126.13) (100.53 - 125.01)
56.47 ± 5.90 a 61.33 ± 9.60b 58.03 ± 5.92a
MABL. C. C. Fernandes et al.
Continued
24.79 ± 2.66 a 26.03 ± 1.81b 24.99 ± 2.14a
NLB 0.029*
(20.29 - 39.24) (22.02 - 29.72) (20.76 - 30.30)
93.95 ± 4.35 a 96.65 ± 4.39b 95.42 ± 4.27b
EKB 0.001*
(83.83 - 110.62) (89.53 - 105.82) (87.06 - 104.73)
20.17 ± 2.81 a 21.76 ± 2.82b 21.31 ± 2.58b
DKB 0.001*
(14.93 - 36.62) (16.43 - 28.54) (16.82 - 30.42)
34.11 ± 2.33 34.78 ± 2.01 34.60 ± 2.17
OBH 0.143
(28.47 - 39.47) (28.37 - 38.94) (30.29 - 38.87)
39.21 ± 2.18 39.37 ± 2.09 39.30 ± 2.12)
OBB 0.907
(33.54 - 47.13) (34.74 - 42.55) (35.23 - 44.75)
28.99 ± 3.80 30.15 ± 3.06 29.04 ± 4.18
MDH 0.266
(20.66 - 38.18) (23.89 - 37.18) (19.58 - 38.24)
16.55 ± 3.00 17.71 ± 3.75 17.17 ± 4.30
MDB 0.154
(10.53 - 25.30) (10.55 - 27.34) (10.95 - 42.62)
110.80 ± 5.61 110.95 ± 6.22 110.97 ± 1199
FRC 0.987
(99.03 - 129.18) (98.65 - 124.03) (19.41 - 123.10)
109.76 ± 7.48 109.29 ± 9.16 110.54 ± 7.36
PAC 0.673
(88.58 - 134.67) (82.64 - 126.22) (96.79 - 131.74)
96.56 ± 6.38 97.53 ± 5.97 95.63 ± 7.19
OCC 0.347
(81.47 - 116.48) (87.67 - 114.31) (71.03 - 108.88)
(1) One-Way ANOVA with Tukey HSD post-test. Same letters in the same line indicate no significant dif-
ference between ancestry groups, whereas different letters (“a” and “b”) indicate statistically significant dif-
ferences between groups. (*) Significant at 0.05. The Asian category was not included in the comparison
because there was only one case. Thus, the test and post-test comparisons were performed only between the
European, African and Admixed ancestry.
group. Significant inter-group differences regarding metric variables were as-
sessed by one-way ANOVA followed by Tukey HSD post-hoc test.
To assess the relationship between the known and estimated ancestry, the me-
tric parameters of the Brazilian skulls were tested in the AncesTrees software.
The tournamentForest (for six ancestry groups) and ancestralForest algorithms
(for six, three or two ancestry groups) were used.
Table 4 shows the ancestry estimates of the tournamentForest algorithm. This
algorithm correctly estimated the European ancestry in 83 out of 155 skulls pre-
viously self-reported as European, and it estimated the African ancestry in 17
out of 34 skulls self-reported as Africans. The only Asian specimen in the sample
was classified as Native American. The percentage of correctness of the tourna-
mentForest algorithm in estimating ancestry was 52.63%, which was statistically
significant.
Table 5 shows the ancestry estimates of the ancestralForest algorithm, consi-
dering six ancestry groups. This method correctly estimated the ancestry of Eu-
ropean Brazilian skulls (n = 155) as European in 76 cases. Seventeen of 34 cases
were correctly estimated by the algorithm as Africans, while the only Asian spe-
cimen was estimated to be Australian. The total accuracy of this algorithm was
48.94%, which was statistically significant.
DOI: 10.4236/aa.2021.112011 169 Advances in AnthropologyL. C. C. Fernandes et al.
Table 4. Accuracy of ancestry estimation in Brazilian human skulls by the tournament-
Forest algorithm, AncesTrees software.
Known ancestry
Estimated ancestry
European African Asian p-value Accuracy
tournamentForest
(n = 155) (n = 34) (n = 1)
n 19 7 0
Asian
% 73.00% 27.00% 0.00%
n 2 0 1
American
% 66.70% 0.00% 33.30%
n 83 6 0
European
% 93.30% 6.70% 0.00%L. C. C. Fernandes et al.
rectly estimated in 17 of 34 cases. The only Asian in the sample was erroneously
estimated to be African. All groups were statistically different from one another,
with an overall accuracy of 50.52%.
Lastly, the ancestralForest algorithm was tested considering only two ancestry
groups (European and African), as shown in Table 7. This setup correctly esti-
mated the ancestry in 88 and 23 skulls cataloged as Europeans and Africans, re-
spectively. The Asian specimen was erroneously estimated to be of African ori-
gin. The accuracy of the total sample was 58.42%, which was statistically signifi-
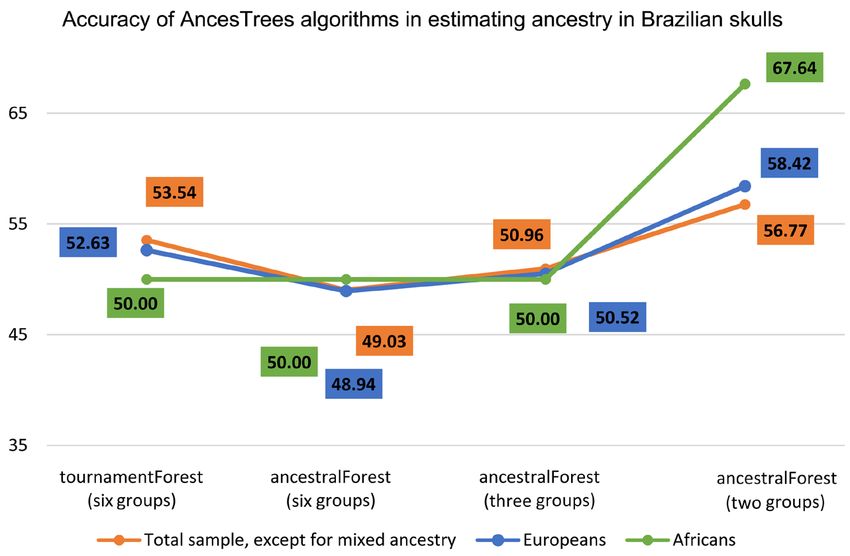
cant. Figure 1 shows the accuracy of tournamentForest and ancestralForest al-
gorithms, and their different setups, in correctly estimating ancestry in Brazilian
human skulls. When all ethnic groups in the bone collection (European, African,
and Asian) were analyzed, except for mixed ancestry, the accuracy of the soft-
ware ranged from 48.94% (ancestralForest with six groups) to 58.42% (ance-
stralForest with two groups). When only European skulls were considered in the
analysis, the best accuracy (56.77%) was shown by the ancestralForest algorithm
with two ancestry groups (European and African). This was also observed in the
analysis of African skulls, with an accuracy of 67.64%. As the AncesTrees soft-
ware showed inconsistency in estimating the skulls of individuals cataloged as
admixed ancestry, this part of the sample was analyzed separately (Table 8).
Table 6. Ancestry estimation in Brazilian human skulls by the ancestralForest algorithm,
AncesTrees software, considering three geographic origins.
Known ancestry
Estimated ancestry
European African Asian p-value Accuracy
ancestralForest
(n = 155) (n = 34) (n = 1)
n 20 7 0
Asian
% 74.00% 26.00% 0.00%
n 79 10 0
European 0.006* 50.52%
% 88.80% 11.20% 0.00%
n 45 17 1
African
% 71.40% 27.10% 1.50%
Chi-square test with Yates correction. (*): Significant at 0.05.
Table 7. Ancestry estimation in Brazilian human skulls by the ancestralForest algorithm,
AncesTrees software, considering two geographic origins.
Known ancestry
Estimated ancestry
European African Asian p-value Accuracy
ancestralForest
(n = 155) (n = 34) (n = 1)
n 88 11 0
European
% 88.90% 11.10% 0.00%L. C. C. Fernandes et al.
Figure 1. AncesTrees accuracy in identified Brazilian skull sample.
Table 8. Classification of Brazilian human skulls of admixed ancestry by the ancestral-
Forest and tournamentForest algorithms, AncesTrees software.
Classification of Brazilian human skulls into mixed ancestry (n = 76)
Estimated tournamentForest ancestralForest ancestralForest ancestralForest
Ancestry (six groups) (six groups) (three groups) (two groups)
Asian 11 13 19 -
American 4 2 - -
European 30 30 27 38
African 26 27 30 38
Polynesian 4 1 - -
Australian 1 3 - -
Based on the tournamentForest and ancestralForest setups with six groups, 30
out of 76 mixed-ancestry skulls were estimated to be Europeans. However, when
the ancestralForest algorithm was used with three ancestry groups, then most of
the admixed ancestry skulls (n = 30) were estimated to be Africans. When the
ancestralForest algorithm was tested considering only two ancestry groups, half
of the admixed ancestry skulls were estimated to be Europeans (n = 38) and half
of them were estimated to be Africans (n = 38).
4. Discussion
The Brazilian population originates from a variety of geographic and ancestral
origins, mainly American, European, and African (Cuzzullin et al., 2020; Tinoco
et al., 2016; Urbanová et al., 2014). Despite this, few studies in the literature have
investigated the ancestral patterns that are typical to the Brazilian population.
This scenario is aggravated by the fact that the criterion for determining human
ancestry is based only on self-reported skin color (Petruccelli & Saboia, 2013).
DOI: 10.4236/aa.2021.112011 172 Advances in AnthropologyL. C. C. Fernandes et al.
The association between skin color (white, black, yellow, mixed race and indi-
genous) and ancestry is not generally accurate, as one characteristic does not
necessarily reflect the other.
To date, there is no method for estimating the specific ancestry of the Brazili-
an population, which makes the challenge even greater, as Brazil is a continental
country and with differences even among populations from different regions of
the territory. With the implementation of osteological collections in Brazil, a
source of reliable research for skeletal remains appears to characterize the Bra-
zilian population, facilitating the development of FA and the validation of me-
thods for solving forensic cases (Cunha, 2019).
The Osteological and Tomographic Collection Prof. Dr. Eduardo Daruge is
one of the few contemporary collections in Brazil with specimens cataloged for
ancestry, thus offering research opportunities to improve the accuracy of ethnic
affinity estimates (Cunha & Ubelaker, 2020). Nevertheless, the classification of
ancestry was based on skin color information described in the death certificate.
We note that this a subjective, outdated, misleading and invalid procedure for
FA practice. In fact, there is no skin color scale that relates automatically to an-
cestry since skin color and ancestry are not synonymous.
In Brazil, estimation of ancestry is a complex task due to the admixture and
miscegenation of the Brazilian population produces features that are not typical
of a specific ancestry group, such as European, African, or Asian. AncesTrees is
a software used to estimate human ancestry based on craniofacial measurements.
In our study, we examined the behavior of the AncesTrees software in estimat-
ing the ancestral pattern of an osteological collection according to the ancestry
groups contained in the software database. As reported herein, the results were
unsatisfactory, which can be due to the inaccuracy in estimating the ancestry of
the Brazilian bone collection based simply on the skin color. Hence, the inclu-
sion of this Brazilian sample into the software database is utterly important to
help estimate the Brazilian ancestry considering metric standards that are widely
accepted and recommended in FA.
The wide biological variety in humans has rendered ancestry estimation an
increasingly challenging task. Hence, a holistic approach added to technological
advances in the field may considerably contribute to greater data accuracy of es-
timating methods. For instance, the analysis of genetic markers, also called an-
cestry informative markers (AIMs), together with the study of stable isotopes of
tooth enamel via strontium level mapping, and the anthropological analysis, al-
low estimating the population affinity of unidentified human remains (Cunha &
Ubelaker, 2020).
In the United States of America, the Daubert versus Merrell Dow Pharma-
ceuticals lawsuit encouraged the adoption of new international guidelines for
better credibility of scientific evidence, which greatly impacted FA research
(Grivas & Komar, 2008). As of this trial, a rigorous and valid scientific method
was required for determination of forensic outcomes in each population based
on statistical analysis and known error rates. Hence, population-specific me-
DOI: 10.4236/aa.2021.112011 173 Advances in AnthropologyL. C. C. Fernandes et al.
thods are better accepted by the scientific and legal communities for being more
accurate (Liebenberg et al., 2019).
The identification of unknown individuals without a critical analysis of the
methodological assumptions used to estimate their biological profile is equivocal
(Cuzzullin et al., 2020). In other words, it is useless to establish one’s identity
based on an unrealistic conjecture for a given population group, since regionally
specific criteria are needed.
Due to the availability of morphological and metric information or a combi-
nation of both (Cunha & Ubelaker, 2020), the human skull is the most suitable
anatomical structure for estimating ancestry in unidentified remains, especially
the facial portion of the skull. More importantly, some authors argue that quan-
titative analyses should be preferred over visual examinations for greater repro-
ducibility, repeatability, and objectivity (Kranioti et al., 2019; Urbanová et al.,
2014).
The AncesTrees software has a database currently including almost 3,000 in-
dividuals from six main ancestry groups—Sub-Saharan African, Austra-
lo-Melanesian, East Asian, European, Native American and Polynesian—from
the well know W.W Howells (1973, 1989, 1994) craniometric series. The soft-
ware was tested on 128 adult human skulls from European and African osteo-
logical collections and on 114 Brazilian skulls (Jacometti, 2018; Navega et al.,
2015). The method was accurate in determining the ancestral classification of
European and African individuals due to the great representativeness of the da-
tabase. European and African groups was correctly classified in 79.20% and
75.00% of cases, respectively, when all six ancestries were considered in the
analysis. When only European and African ancestries were considered, the algo-
rithm correctly estimated population affinity in 93.8% of cases. Despite these
findings, the incorporation of representative data obtained from different geo-
graphical origins across the globe, including Brazil, into the AncesTrees database
is needed to confirm the accuracy and usefulness of the software for forensic
practice.
AncesTrees is a relatively new software, so there are not many studies report-
ing on the accuracy of its estimates. Skalic (2018) determined ancestry estimates
using the AncesTrees software based on nine measures in 108 skeletons from the
Terry Osteological Collection (United States of America) and the Coimbra Os-
teological Collection (Portugal). Both collections have skulls of men and women
previously classified as white or black, two of which are archaeological cases (one
belongs to the Archaic First Nation and the other is a Peruvian skull intention-
ally altered for cultural reasons). The accuracy of the tournamentForest algo-
rithm ranged from 37.00% to 40.70%. The software was tested for its ability to
allocate a sample that did not fit into any of the ancestry groups contained in the
database. The archaeological cases were estimated to be originating from South
Western Europe and East Asia. Thus, the author argues AncesTrees software
may not be appropriate to estimate population affinity in groups that are not
well represented in the database.
DOI: 10.4236/aa.2021.112011 174 Advances in AnthropologyL. C. C. Fernandes et al.
In Brazil, Jacometti (2018) tested the AncesTrees software on a sample of 114
skulls from São Paulo State (Identified Skull Collection at UNIFESP) previously
cataloged as Europeans, Africans, and mixed ancestry. Using the same algo-
rithms and setups as those tested in our study, the author found a better perfor-
mance for estimating European (73.0% accuracy) and African (66.0% accuracy)
ancestries, with the ancestralForest algorithm with two ancestry groups (Euro-
pean and African) being the best strategy (70.0% accuracy). Mixed-ancestry in-
dividuals were mostly, albeit inconsistently, classified as Europeans. These re-
sults corroborate with those observed in our study, showing that the applicability
of the software for ancestral classification of this Brazilian population is poor.
Predictive models work based on data matching, but the fact that the Brazilian
population is not yet registered in the AncesTrees database may yield an atypical
outcome, if no other similar metric standards can be retrieved by the software.
In contrast, when Portuguese researchers were invited to estimate the biolog-
ical profile of an exhumed young adult from the cemetery attached to the Igreja
Do Carmo (Do Carmo Church), in Lisbon, they observed that the cranial mor-
phology and intentional dental changes were suggestive of African origin, indi-
cating that cultural aspects found in the skeleton may be a direct evidence of an-
cestry (Alves et al., 2016; Cunha & Ubelaker, 2020). When thirteen metric para-
meters were considered in the analysis of this case, the AncesTrees software in-
dicated a probable Sub-Saharan African origin, with an accuracy of 92%. This
confirms that when the likely ancestral origin of unidentified remains is in-
cluded in the software database, then the accuracy rate of the algorithm is con-
siderably higher.
Another Portuguese study reported favorable results when using the Ance-
sTrees software (Navega et al., 2015). A total of 158 individuals buried in the re-
gion of Lagos, Portugal, and of probable African origin, were metrically and ge-
netically examined for their ancestry. Cultural artifacts associated with the ske-
letons were found, and the skull morphology and the presence of intentional
changes in the teeth were analyzed. The ancestral affinity was confirmed as
African, demonstrating a high accuracy of the algorithm for ancestries included
in the database.
In 2016, Slovenian researchers analyzed the bones of an individual allegedly
missing since the Second World War. Some morphological aspects of the indi-
vidual’s skull revealed typical Caucasian features, as follows: narrow nasal open-
ing and jaws, prominent anterior nasal spine, round-shaped orbits, reduced in-
ter-orbital distance, and the presence of malar tubercles. The European ancestry
of the specimen was confirmed with an accuracy of 82.0% by a metric analysis in
the AncesTrees software, which was set up to not consider Asian and African
ancestry groups in the analysis. The software provided more accurate estimates
when only the most likely ancestries were selected for comparison (Zupanič
Pajnič et al., 2016).
In recent years, the supply of computational tools in forensic anthropology
has been increasing (Lynch & Stephan, 2018), although most of these tools have
DOI: 10.4236/aa.2021.112011 175 Advances in AnthropologyL. C. C. Fernandes et al.
a high financial cost. AncesTrees, however, is a free-to-use statistical program
from a universe of tools made available by the Osteomics project (d’Oliveira
Coelho et al., 2020) for forensic anthropologists, forensic experts, and scholars in
the process of estimating human ancestry in unidentified specimens. The accu-
racy of this software depends on the craniometric measurements obtained,
number of ancestry groups included for analysis, and on the statistical setup
Therefore, a more robust database comprising the variety of human populations
is required to increase the reliability and accuracy of the algorithms for use in
the resolution of forensic cases (Kranioti et al., 2019).
The continuous miscegenation of human populations means that even the
most complex forensic methods are challenged as to their effectiveness in deter-
mining a biological profile (Urbanová et al., 2014). The results observed in our
study showed that regardless of the algorithm and the statistical setup, the accu-
racy of the software in determining the real ancestry of Brazilian skulls varied
from 48.94% to 58.42%.
In our study, the tournamentForest and ancestralForest algorithms with three
ancestry groups were more suitable for classifying Europeans, while the ance-
stralForest algorithm with six and two groups was more accurate for estimating
African ancestry. Mixed-ancestry cases were predominantly classified as Euro-
peans. The ancestralForest algorithm, configured for European and African an-
cestries, was more accurate to estimate the ancestry of the Brazilian sample in-
cluded in our study.
5. Conclusion
To date, data on Brazilian skulls have not yet been incorporated into the Ance-
sTrees software database. Therefore, this program should undergo more valida-
tion studies by the forensic and scientific community to more rigorously and
systematically assess its accuracy as a tool for ancestry estimation in Brazil. The
incorporation of identified and documented forensic cases into the database, es-
pecially of recently identified osteological collections, such as the FOP/UNICAMP
Osteological and Tomographic Collection—Prof. Dr. Eduardo Daruge, will al-
low the development and adaptation of population-specific approaches. Thus,
the authors of the present study propose to upload the information on Brazilian
skulls into the AncesTrees software database and to re-assessment of the accu-
racy of the ancestry estimates.
Forensic anthropology is a discipline with an immense societal value and re-
sponsibility. Nonetheless, to guarantee its mission experts need to assert and
recognize the advantages and limitations of the methods employed in the field.
Systematic and constant validation, and improvement of all methodological as-
pect is crucial. The work here presented is contribution to such endeavor, and
particularly relevant for forensic experts operating in Brazil.
Ethical Statement
This study was previously approved by the Research Ethics Committee at Pira-
DOI: 10.4236/aa.2021.112011 176 Advances in AnthropologyL. C. C. Fernandes et al.
cicaba Dental School, University of Campinas, under protocol number 3.403.875,
and is in accordance with the 466/12 Resolution of the National Health Council,
Ministry of Health, Brazil.
Conflicts of Interest
The authors declare no conflict of interest.
References
Alves, R. V, Garcia, S. J., Marques, A., & Wasterlain, S. N. (2016). Osteological Analysis of
a Skeleton with Intentional Dental Modifications, Exhumed from Largo do Carmo
(17th-18th Centuries), Lisbon. Antropologia Portuguesa, 32/33, 61-75.
Breiman, L. (2001). Random Forests. Machine Learning, 45, 5-32.
https://doi.org/10.1023/A:1010933404324
Carvalho-Silva, D. R., Santos, F. R., Rocha, J., & Pena, S. D. J. (2001). The Phylogeography
of Brazilian Y-Chromosome Lineages. American Journal of Human Genetics, 68,
281-286. https://doi.org/10.1086/316931
Cunha, E. (2019). Devolvendo a identidade: A antropologia forense no Brasil. Ciência e
Cultura, 71, 30-34. https://doi.org/10.21800/2317-66602019000200011
Cunha, E., & Ubelaker, D. H. (2020). Evaluation of Ancestry from Human Skeletal Re-
mains: A Concise Review. Forensic Sciences Research, 5, 89-97.
https://doi.org/10.1080/20961790.2019.1697060
Cunha, E., Lopez-Capp, T. T., Inojosa, R., Marques, S. R., Moraes, L. O. C., Liberti, E.,
Machado, C. E. P., de Paiva, L. A. S., Francesquini Jr., L., Daruge Jr., E., Almeida Jr., E.,
& Soriano, E. (2018). The Brazilian Identified Human Osteological Collections. Foren-
sic Science International, 289, 449.e1-449.e6.
https://doi.org/10.1016/j.forsciint.2018.05.040
Cuzzullin, M. C., Curate, F., Freire, A. R., Costa, S. T., Prado, F. B., Daruge Junior, E.,
Cunha, E., & Rossi, A. C. (2020). Validation of Anthropological Measures of the Hu-
man Femur for Sex Estimation in Brazilians. Australian Journal of Forensic Sciences,
1-14. https://doi.org/10.1080/00450618.2020.1729411
d’Oliveira Coelho, J., Curate, F., & Navega, D. (2020). Osteomics: Decision Support Sys-
tems for Forensic Anthropologists. In Z. Obertová, A. Stewart, & C. Cattaneo (Eds.),
Statistics and Probability in Forensic Anthropology (pp. 259-273). Waltham, Academic
Press. https://doi.org/10.1016/B978-0-12-815764-0.00005-8
de Carvalho, M. V. D., Lira, V. F., do Nascimento, E. A., Torres Kobayashi, S. B., de
Araújo, L. F., de Almeida, A. C., Porto Petraki, G. G., Cunha, E., & Soriano, E. P.
(2020). New Acquisitions of a Contemporary Brazilian Identified Skeletal Collection.
Forensic Science International: Reports, 2, Article ID: 100050.
https://doi.org/10.1016/j.fsir.2019.100050
Grivas, C. R., & Komar, D. A. (2008). Kumho, Daubert, and the Nature of Scientific In-
quiry: Implications for Forensic Anthropology. Journal of Forensic Sciences, 53,
771-776. https://doi.org/10.1111/j.1556-4029.2008.00771.x
Howells, W. W. (1973). Cranial Variation in Man: A Study by Multivariate Analysis of
Patterns of Difference among Recent Human Populations. Cambridge, Peabody Mu-
seum of Archaeology and Ethnology, Harvard University.
Howells, W. W. (1989). Skull Shapes and the Map: Craniometric Analyses in the Disper-
sion of Modern Homo. Cambridge, Peabody Museum of Archaeology and Ethnology,
Harvard University.
DOI: 10.4236/aa.2021.112011 177 Advances in AnthropologyL. C. C. Fernandes et al.
Howells, W. W. (1994). Who’s Who in Skulls: Ethnic Identification of Crania from Mea-
surements. Cambridge, Peabody Museum of Archaeology and Ethnology, Harvard
University.
Jacometti, V. (2018). Estimativa da ancestralidade em Antropologia Forense por meio do
software “AncesTrees” em medidas cranianas de uma amostra brasileira. São Paulo:
Universidade de São Paulo.
Kranioti, E. F., Garcia-Donas, J. G., Karell, M. A., Cravo, L., Ekizoglu, O., Apostol, M., &
Cunha, E. (2019). Metric Variation of the Tibia in the Mediterranean: Implications in
Forensic Identification. Forensic Science International, 299, 223-228.
https://doi.org/10.1016/j.forsciint.2019.03.044
Liebenberg, L., Krüger, G. C., L’Abbé, E. N., & Stull, K. E. (2019). Postcraniometric Sex
and Ancestry Estimation in South Africa: A Validation Study. International Journal of
Legal Medicine, 133, 289-296. https://doi.org/10.1007/s00414-018-1865-x
Lynch, J., & Stephan, C. (2018). Computational Tools in Forensic Anthropology: The
Value of Open-Source Licensing as a Standard. Forensic Anthropology, 1, 228-243.
https://doi.org/10.5744/fa.2018.0025
Navega, D., Coelho, C., Vicente, R., Ferreira, M. T., Wasterlain, S., & Cunha, E. (2015).
AncesTrees: Ancestry Estimation with Randomized Decision Trees. International
Journal of Legal Medicine, 129, 1145-1153. https://doi.org/10.1007/s00414-014-1050-9
Ousley, S., & Jantz, R. (2013). Fordisc 3: Third Generation of Computer-Aided Forensic
Anthropology. Rechtsmedizin, 23, 97-99. https://doi.org/10.1007/s00194-013-0874-9
Petruccelli, J. L., & Saboia, A. L. (2013). Características étnico-raciais da população:
classificações e identidades (Issue 2). Rio de Janeiro: Instituto Brasileiro de Geografia e
Estatística (IBGE).
Skalic, C. (2018). A Critical Approach to Ancestry in Forensic Anthropology: an Assess-
ment of Fordisc 3.1 and AncesTrees. Windsor: University of Windsor.
Slice, D. E., & Ross, A. H. (2009). Geometric Morphometrics Classification of Crania for
Forensic Scientists. No. 2018-05-27. http://www.3d-id.org
Tinoco, R. L. R., Lima, L. N. C., Delwing, F., Francesquini, L., & Daruge, E. (2016). Dental
anthropology of a Brazilian sample: Frequency of Nonmetric Traits. Forensic Science
International, 258, 102.e1-102.e5. https://doi.org/10.1016/j.forsciint.2015.10.019
Urbanová, P., & Králík, M. (2008). COLIPR: Coordinate-Based Legal Investigation Pro-
gram. https://is.muni.cz/publication/764216
Urbanová, P., Ross, A. H., Jurda, M., & Nogueira, M. I. (2014). Testing the Reliability of
Software Tools in Sex and Ancestry Estimation in a Multi-Ancestral Brazilian Sample.
Legal Medicine, 16, 264-273. https://doi.org/10.1016/j.legalmed.2014.06.002
Wright, R. V. S. (1992). Correlation between Cranial form and Geography in Homo sa-
piens: CRANID—A Computer Program for Forensic and Other Applications. Arc-
haeology in Oceania, 27, 128-134. https://doi.org/10.1002/j.1834-4453.1992.tb00296.x
Zupanič Pajnič, I., Petaros, A., Balažic, J., & Geršak, K. (2016). Searching for the Mother
Missed since the Second World War. Journal of Forensic and Legal Medicine, 44,
138-142. https://doi.org/10.1016/j.jflm.2016.10.015
DOI: 10.4236/aa.2021.112011 178 Advances in AnthropologyYou can also read