Influence of climatic variables on the epidemiological situation of dengue in the Ceará-Brazil
←
→
Page content transcription
If your browser does not render page correctly, please read the page content below
Research, Society and Development, v. 10, n. 12, e181101220313, 2021
            (CC BY 4.0) | ISSN 2525-3409 | DOI: http://dx.doi.org/10.33448/rsd-v10i12.20313

Influence of climatic variables on the epidemiological situation of dengue in the
Ceará- Brazil
Influência das variáveis climáticas na situação epidemiológica da dengue no Ceará- Brasil
Influencia de las variables climáticas en la situación epidemiológica del dengue en Ceará-Brasil

                                                   Received: 09/06/2021 | Reviewed: 09/12/2021 | Accept: 09/14/2021 | Published: 09/17/2021

                                                                                                             Selene Maia de Morais
                                                                                            ORCID: https://orcid.org/0000-0002-2766-3790
                                                                                                          State University of Ceará, Brazil
                                                                                                 E-mail: selenemaiademorais@gmail.com
                                                                                                          Silvana Silveira de Farias
                                                                                            ORCID: https://orcid.org/0000-0002-8785-8880
                                                                                                          State University of Ceará, Brazil
                                                                                                   E-mail: silvana.silveira@aluno.uece.br

      Abstract
      Dengue is a worldwide public health problem; studies show a correlation between dengue and climatic variables.
      Thus, this research aimed to investigate the correlation of the number of cases of patients with primary dengue
      symptoms (NCPPDS) with the compensated average temperature (TCA), average precipitation (PA) and compensated
      average relative humidity (RHCA) for the state of Ceará (2013-2018), in addition to identifying the municipalities most
      affected by the disease. For this analysis, institutional databases were collected and the data were compiled and
      processed through Statistical Package for the Social Science software. The association between climatic variables and
      NCPPDS was made using Pearson's correlation. It was noted that the city of Fortaleza was the municipality most
      affected by the disease, followed by its metropolitan region. Pearson's correlation was significant and inversely
      proportional between the NCPPDS and TCA in the years studied. In the NCPPDS analysis and PA, a directly proportional
      significant correlation was observed in the years 2013, 2017 and 2018. Regarding RH CA during the years 2013, 2015,
      2017 and 2018, a directly proportional significant correlation to dengue cases was also observed. These results
      showed that precipitation and humidity directly influenced the number of dengue cases in the state of Ceará, and in
      accordance with studies in other Brazilian regions, these findings represent a general picture for dengue spreading.
      Keywords: Dengue; Temperature; Precipitation; Relative humidity; Correlation.

      Resumo
      A dengue é um problema de saúde pública mundial; estudos mostram uma correlação entre dengue e variáveis
      climáticas. Assim, esta pesquisa teve como objetivo investigar a correlação do número de casos de pacientes com
      sintomas primários de dengue (NCPPDS) com a temperatura média compensada (TCA), precipitação média (PA) e
      umidade relativa média compensada (RHCA) para o estado do Ceará (2013-2018), além de identificar os municípios
      mais atingidos pela doença. Para essa análise, foram coletados bancos de dados institucionais e os dados foram
      compilados e tratados através software Statistical Package for the Social Science. A associação entre as variáveis
      climáticas e o NCPPDS foi feita pela correlação de Pearson. Como resultado notou-se que a cidade de Fortaleza, foi o
      município mais atingido pela doença, seguido de sua região metropolitana. Na análise do NCPPDS e PA, foi observada
      uma correlação significativa diretamente proporcional nos anos de 2013, 2017 e 2018. Com relação a RH CA durante os
      anos de 2013, 2015, 2017 e 2018, também foi observada uma correlação significativa diretamente proporcional para
      os casos de dengue. Esses resultados mostraram que a precipitação e a umidade influenciaram diretamente no número
      de casos de dengue no estado do Ceará, e de acordo com estudos em outros estados brasileiros estes achados
      representam um quadro geral para a disseminação da dengue.
      Palavras-chave: Dengue; Temperatura; Precipitação; Umidade relativa; Correlação.

      Resumen
      El dengue es un problema de salud pública mundial; los estudios muestran una correlación entre el dengue y las
      variables climáticas. Así, esta investigación tuvo como objetivo investigar la correlación del número de casos de
      pacientes con síntomas primarios de dengue (NCPPDS) con la temperatura media compensada (TCA), precipitación
      media (PA) y humedad relativa media compensada (RHCA) para el estado de Ceará (2013-2018), además de identificar
      las ciudades más afectadas por la enfermedad. Para este análisis, se recopilaron bases de datos institucionales y los
      datos se recopilaron y procesaron utilizando el software Statistical Package for Social Science. La asociación entre las
      variables climáticas y el NCPPDS se realizó mediante la correlación de Pearson. Como resultado, se observó que la

                                                              1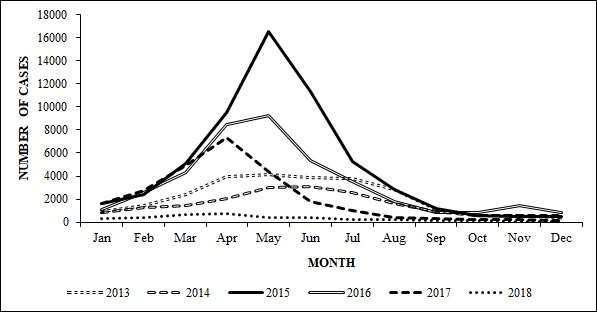
Research, Society and Development, v. 10, n. 12, e181101220313, 2021
                 (CC BY 4.0) | ISSN 2525-3409 | DOI: http://dx.doi.org/10.33448/rsd-v10i12.20313

           ciudad de Fortaleza fue la ciudad más afectada por la enfermedad, seguida de su región metropolitana. En el análisis
           del NCPPDS y PA, se observó una correlación significativa directamente proporcional en los años 2013, 2017 y 2018.
           Con respecto a la RHCA durante los años 2013, 2015, 2017 y 2018, también se observó una correlación significativa
           directamente proporcional para los casos de dengue. Estos resultados mostraron que la precipitación y la humedad
           influyeron directamente en el número de casos de dengue en el estado de Ceará, y de acuerdo con estudios en otras
           regiones brasileñas, estos hallazgos representan un panorama general de la propagación del dengue.
           Palabras clave: Dengue; Temperatura; Precipitación; Humedad relativa; Correlación.

1. Introduction
           Dengue is a viral disease transmitted by arthropods, which presents four serotypes of dengue virus (DENV-1, DENV-
2, DENV-3 and DENV-4), transmitted by Aedes spp. mosquitoes. Dengue has evolved from a casual disease to a major public
health problem with considerable social and economic effects, due to the increasing in its geographical amplitude, number of
cases and the severity of the disease (Guzman & Harris, 2015). The number of dengue cases is estimated at 390 million
infections per year and the Americas contribute 14% of these infections, more than half of which occurred in Brazil and
Mexico (Bhatt et al., 2013). Global warming is believed to induce a gradual climate change, then probably tropical insects
might expand their habitats (Zell, Krumbholz & Wutzler, 2008).
           In 2012, dengue was considered the most important viral disease in the world, and it is found mainly in tropical and
subtropical regions of the planet, where occurs preferably in urban and semi-urban areas, with risk factors influenced by local
spatial variations of precipitation, temperature, relative humidity, degree of urbanization and quality of vector control services.
Severe dengue is one of the leading causes of acute diseases and deaths among children in some countries in Asia and Latin
America (WHO., 2012, 2019).
           Brazil has 26 states and the Federal District, and an estimated population of 210 million people (IBGE., 2019). In
2018, the country registered 265,934 probable dengue cases, with an incidence rate of 127.5 cases/100,000 inhabitants, of
which 174,724 (65.75%) were confirmed. The Northeast region of Brazil in recent years has shown an expressive number of
probable dengue cases when compared to other regions (Brasil., 2019). The state of Ceará located in the Northeast of the
country has an estimated population of 9 million people (IBGE., 2019), being composed of 184 municipalities, the
predominant climate in the state is semiarid hot tropical (IPCE., 2017), and the historical series of dengue in Ceará reveals its
epidemiological behavior and justifies the classification made by the Ministry of Health as a “vulnerability area with very high
risk” for the occurrence of this disease (Lima et al., 2014).
           Some studies indicate that the incidence of dengue cases has a strong correlation with climatic variables (temperature,
rainfall and air humidity, among others), since these climatic conditions favor the increase of breeding grounds for the
transmitting mosquito and facilitate the development of the vector (Mutheneni et al., 2017; Viana & Ignotti, 2013). Vector-
borne diseases are among those most affected by climate change (Flahault, De Castaneda & Bolon, 2016). Recent research has
used computational and mathematical models to make predictions and study the effects of climatic variables on the incidence
of dengue in different places in the world. Mordecai et al. (2017) used mechanistic transmission models to derive predictions
of how the probability and magnitude of Zika, chikungunya and dengue transmission are affected by changes in temperature,
the values presented were compatible with real data.
           Wu et al. (2018) presented the non-linearity of the incidence of dengue in relation to average temperature and relative
humidity in Guangzhou-China, suggesting that there are thresholds in these effects, below which there are significant positive
effects.
           Using a linear and non-linear model Xu et al. (2019) quantified the effects of average monthly temperature and
relative humidity in cases of severe dengue in Thailand, in some provinces studied the risk of occurrence of severe cases of
dengue increased with the increase in average temperature, in other regions this result was not predictable, as well as the
                                                                 2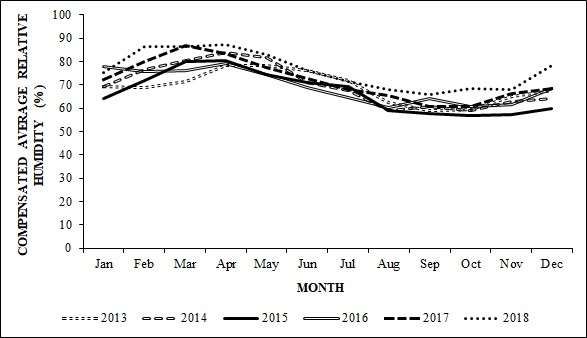
Research, Society and Development, v. 10, n. 12, e181101220313, 2021
(CC BY 4.0) | ISSN 2525-3409 | DOI: http://dx.doi.org/10.33448/rsd-v10i12.20313
relative humidity that significantly affected the occurrence of severe cases of dengue in Northeast and Central Thailand, with
optimal intervals observed for each region.
Given the need for studies on dengue, since this is a worldwide problem, this research aimed to investigate the
correlation of the number of cases of patients with primary symptoms of dengue (NCPPDS) with compensated average
temperature (TCA), average precipitation (PA) and compensated average relative humidity (RHCA) for the state of Ceará (2013-
2018), in addition to identifying the municipalities most affected by the disease.
2. Methodology
This research was a quantitative-descriptive study of the variables that can influence the epidemiological situation of
dengue in the state of Ceará during the period 2013-2018, by analyzing the frequency of incidences and statistical correlations,
according to the methodology proposed by Chizzotti (2010).
2.1 Study location
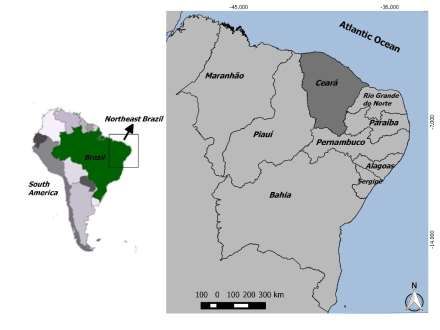
The state of Ceará has an area of 148,894,757 km 2 and is located in the Northeast Region of Brazil between the
coordinates of latitude 7°21'32”S and longitude 39°02'44” W (Fig.1), with its limits to the West Piauí, to the East Rio Grande
do Norte and Paraíba, South Pernambuco and North Atlantic Ocean. The state of Ceará has a strategic location for international
tourism due to its proximity to Europe, North America and the African Continent, presents 184 municipalities, with the city of
Fortaleza being the capital of the state (IPECE, 2017., IBGE, 2019).
Figure 1. Location map of the state of Ceará-Brazil.
Source: Authors.
The predominant climate in the region according to the Köppen-Geiger climate classification is semi-arid (BS’w’h’)
in 80% of the territory, the remaining 20% are almost entirely classified as sub-humid climate (Aw’) present in the coastal
region (Andrade et al., 2012).
3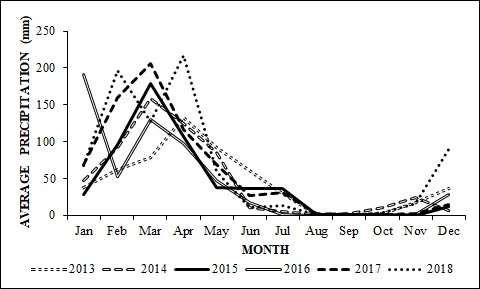
Research, Society and Development, v. 10, n. 12, e181101220313, 2021
               (CC BY 4.0) | ISSN 2525-3409 | DOI: http://dx.doi.org/10.33448/rsd-v10i12.20313

2.2 Data collection
         Data on the epidemiological situation of dengue in the state of Ceará (2013-2018) were obtained from the database of
the Ceará State Health Secretariat through the Notifiable Diseases Information System (SINAN), and information was
collected on the NCPPDS and the municipalities most affected. TCA and RHCA data for the analyzed period were extracted from
eleven conventional meteorological stations of the National Institute of Meteorology (INMET) of Brazil, the stations are
located in different regions of the state of Ceará (Table 1).

                           Table 1. Conventional meteorological stations of the state of Ceará-Brazil.
                               Station              Latitude (°S)       Longitude (°W)    Altitude (m)
                              Barbalha                  -7.31               -39.29          409.03
                            Campos Sales                -7.00               -40.38          583.50
                               Crateús                  -5.16               -40.66          296.82
                              Fortaleza                 -3.75               -38.54           26.45
                            Guaramiranga                -4.28               -39.00          870.67
                                Iguatu                  -6.36               -39.29          217.67
                             Jaguaruana                 -4.78               -37.76           11.71
                            Morada Nova                 -5.11               -38.36           43.62
                            Quixeramobim                -5.16               -39.28           79.50
                               Sobral                   -3.73               -40.33          109.62
                                 Tauá                   -6.00               -40.41          398.77
                                                          Source: Authors.

         The information on the precipitation levels of the state of Ceará (2013-2018) was obtained from the Ceará Foundation
for Meteorology and Water Resources (FUNCEME), from the analysis of twelve hydrographic regions in the State of Ceará:
Acaraú, Alto Jaguaribe, Baixo Jaguaribe, Banabuiú, Coreaú, Curu, Litoral, Médio Jaguaribe, Metropolitana, Salgado, Serra da
Ibiapaba and Sertões de Crateús.

2.3 Data analysis
         The data were analyzed using the software Statistical Package for the Social Science SPPSS version 23 and Microsoft
Excel. Pearson's correlation given by equation (I) was used to analyze the relationship between climatic variables and the
NCPPDS (2013-2018).

                                                                             Eq.(I)

Where:
  = sample mean (1st variable)
  = standard deviation (1st variable)
  = sample mean (2nd variable)
  = desvio padrão (2nd variable)

  = número of observations

         Pearson's correlation coefficient is a linear measure that demonstrates the degree of dependence between two random
variables. Historically, it is the first formal correlation measure and is still one of the most used measures of relationship
between variables (Zhou et al., 2016).

                                                                    4
Research, Society and Development, v. 10, n. 12, e181101220313, 2021
(CC BY 4.0) | ISSN 2525-3409 | DOI: http://dx.doi.org/10.33448/rsd-v10i12.20313
The monthly compensated average temperature was calculated by equation (II), and the relative humidity of the air,
which also uses the value of the compensated average, measured by equation (III) both used by INMET.
Eq. (II)
Eq. (III)
In the equation II,
TCA = compensated average temperature
Tmax = maximum daytime temperature
Tmin = minimum daytime temperature
T12 = temperature at 12h UTC (Coordinated Universal Time)
T24 = temperature at 0h UTC
And in equation III,
RHCA= compensated average relative humidity
RH12= relative humidity at 12h UTC
RH18= relative humidity at 18h UTC
RH24= relative humidity at 24h UTC
In both:
k = day; i = month; j = year
For the analysis of the TCA and RHCA data, the monthly values of each of the meteorological stations in the state of
Ceará were used, some missing values were imputed by the average. Annual data resulted from the monthly sum of averages
by the number of stations.
3. Results and Discussion
3.1 Epidemiological situation of dengue
The analysis of the databases obtained from SINAN (2013-2018) showed that the NCPPDS in the state of Ceará (Figure
2) occurred more frequently in April, May and June. It was also noted that the year 2015 had the highest number of cases in
this quarter. All NCPPDS was confirmed as dengue, severe dengue or dengue with alarm signs using laboratory and clinical-
epidemiological criteria. In the series of data analyzed 2015 was the most incident year in NCPPDS, presenting about 57,261
cases in the state of Ceará.
5Research, Society and Development, v. 10, n. 12, e181101220313, 2021
(CC BY 4.0) | ISSN 2525-3409 | DOI: http://dx.doi.org/10.33448/rsd-v10i12.20313
Figure 2. Number of cases of patients with primary dengue symptoms in the Ceará-Brazil (2013-2018).
Source: Authors.
Since 1986, there have been reported cases of dengue in the state of Ceará and the four serotypes (DENV 1- 4) were
characterized. The disease manifested itself in an endemic form in the state with a record of seven major epidemics in the years
1987, 1994, 2001, 2008, 2011, 2012 and 2015. In 2015, the autochthonous transmission of the chikungunya and Zika virus was
confirmed in the state (Brasil., 2017).
3.2 Municipalities most affected by dengue
During the period analyzed with data from SINAN (2013-2018), it can be noted that dengue was present in almost all
municipalities in Ceará, with a higher incidence in more urbanized areas. Cases reported as dengue appears on a smaller scale
in the North/East/West coast of the state as well as in mountainous cities. In the six years investigated in this study, the city of
Fortaleza, capital of the state of Ceará, presented the largest number of confirmed cases of dengue (Table 2). Municipalities
that are part of the metropolitan region of Fortaleza also presented a significant incidence of confirmed dengue cases in the
period studied.
6Research, Society and Development, v. 10, n. 12, e181101220313, 2021
(CC BY 4.0) | ISSN 2525-3409 | DOI: http://dx.doi.org/10.33448/rsd-v10i12.20313
Table 2. Municipalities of the state of Ceará most affected by dengue (2013-2018).
Year Rank order Municipality Confirmed case
numbers
1st Fortaleza 8762
2nd Maracanaú* 1696
2013 3rd Tauá 1097
4th Caucaia* 863
5th Pacajus* 767
1st Fortaleza 5084
2nd Tauá 1156
2014 3rd Caucaia* 613
4th Canindé 587
5th Hidrolândia 527
1st Fortaleza 26850
2nd Sobral 1425
2015 3rd Caucaia* 1405
4th Maracanaú* 1271
5th Brejo Santo 954
1st Fortaleza 21899
2nd Tauá 2350
2016 3rd Icó 1507
4th Caucaia* 1413
5th Russas 737
1st Fortaleza 13702
2nd Brejo Santo 1407
2017 3rd Caucaia* 958
4th Milagres 724
5th Farias Brito 668
1st Fortaleza 1256
2nd Caucaia* 272
2018 3rd Quixadá 259
4th Solonópole 213
5th Milhã 180
* Metropolitan area of Fortaleza, capital of the state of Ceará.
Source: Authors.
The city of Fortaleza occupied the first place in the ranking of the cities most affected by dengue (2013-2018), the
municipality has about 8,000 inhabitants per square kilometer, the highest population density among Brazilian capitals. The
city has a semi-arid climate and an average minimum temperature of 24°C, the average maximum temperature is 30°C, its
climatic conditions are influenced by the Intertropical Convergence Zone (ZCIT), by seasonal phenomena of El Niño, which
occur in the dry season and La Niña, marked by rains above the average regional multiannual rate (Paula et al., 2013).
In addition to the capital of the state of Ceará, the cities most affected by dengue during the period studied belong to
government planning regions identified as Sertão Central, Sertão dos Inhamuns, Sertão de Cratéus, Sertão de Canindé, Sertão
de Sobral, Região do Cariri, Centro Sul and Vale do Jaguaribe (IPECE., 2019).
According to De Oliveira et al (2020), in the epidemiological analysis of dengue cases during the period (2008-2012),
the state of Maranhão also presented the majority of dengue cases in urban centers. De Medeiros Silva et al (2021) in the
temporal study of arboviruses for the state of Rio Grande do Norte revealed that environmental factors play an important
influence on the population of mosquitoes, which generally inhabit peridomicile environments, a fact that explains the highest
averages of arboviruses in the metropolitan region, due to population agglomerates and favorable tropical climate, with
humidity and precipitation, which favor the presence of the vector, and consequently a greater number of cases.
7Research, Society and Development, v. 10, n. 12, e181101220313, 2021
(CC BY 4.0) | ISSN 2525-3409 | DOI: http://dx.doi.org/10.33448/rsd-v10i12.20313
The proximity to low-income urban and peri-urban centers was also associated with an increased risk of dengue,
indicating that the human movement between population centers is an important facilitator of the spread of the disease (Bhatt.,
2013).
3.3 Situation of climatic variables
3.3.1 Average compensated temperature (TCA)
The annual TCA data indicated as a result of the series studied for the state of Ceará (2013-2018), an average between
26.23-27.23°C. It was verified through the analysis of normality with the Shapiro-Wilk test (Field., 2009) that the values
presented are normal, presenting only small deviations of normality (Table 3).
Table 3. Annual compensated average temperature in Ceará-Brazil (2013-2018).
Annual compensated average temperature (°C)
MONTH 2013 2014 2015 2016 2017 2018
Jan 27.58 26.92 27.44 26.56 27.43 26.89
Feb 27.65 26.26 26.91 26.85 26.51 25.55
Mar 27.63 26.00 25.93 27.39 25.53 25.80
Apr 26.37 25.67 25.89 26.62 25.83 24.94
May 25.86 25.50 26.55 26.85 26.24 25.41
Jun 25.46 25.86 25.95 26.53 25.93 25.13
Jul 25.07 25.65 25.69 26.48 25.40 25.36
Aug 26.57 26.45 26.43 26.95 26.74 26.33
Sep 27.38 27.07 27.35 27.51 27.24 27.14
Oct 27.70 27.55 27.98 28.34 28.15 27.59
Nov 27.05 27.28 28.11 28.64 27.74 28.00
Dec 27.32 27.35 28.51 28.02 28.00 26.59
Mean 26.80±0.92 26.46±0.74 26.90±0.97 27.23±0.75 26.73±0.97 26.23±1.02
p* 0.06 0.22 0.31 0.06 0.45 0.45
*The annual data presented normality with significance level of 5% by the Shapiro-Wilk test
Source: Authors.
Most of the Northeast region has an average annual temperature of around 26°C, nevertheless there are places with
higher values (Correia et al., 2017). In the study on climatic scenarios for the Northeast region of Brazil Santos et al. (2010)
analyzed data from 89 meteorological stations (1961-2007), in this analysis it was observed that the average air temperature
ranged from 22 to 25°C, and projections made for 2050 pointed out average air temperatures between 27 and 28°C in most of
the states of Maranhão, Piauí, Ceará and Rio Grande do Norte.
The annual TCA (2013-2018) for the state of Ceará observed in this study was close to the values reported in the
literature, although most works do not use the compensated average temperature, a single temperature parameter that in its
definition denotes a lower degree of uncertainty when compared to simple averages (De Carvalho Rocha & Santos, 2017). The
climatological normal (1981-2010) for TCA based on meteorological stations located in the state of Ceará showed an average of
26.35°C (INMET., 2020), a value close to that found in the studied series.
3.3.2 Average Precipitation (PA)
Analysis of PA data in the state of Ceará (2013-2018) showed that March and April had the highest precipitation rates
in all annual series. Specifically, in the years 2014, 2015, 2017 and 2018 the months of February, March, and April were the
months of the greatest intensity in terms of precipitation (Figure 3).
8Research, Society and Development, v. 10, n. 12, e181101220313, 2021
(CC BY 4.0) | ISSN 2525-3409 | DOI: http://dx.doi.org/10.33448/rsd-v10i12.20313
Figure 3. Average precipitation in the Ceará-Brazil (2013-2018).
Source: Authors.
The annual PA for the state of Ceará (2013-2018) was 51.62 mm, with September being the driest month having 0.75
mm of annual PA in the analyzed series, the maximum precipitation reached was 216.5 mm in April 2018 (Figure 3).
Costa e Silva (2017) showed an analysis of the spatio-temporal distribution of rainfall anomalies index for the state of
Ceará (1973-2010) and found that the annual PA was 81.57 mm, a value higher than that found in this research. The authors
verified the month of March with maximum precipitation value, around 213 mm, which agrees with this study in the years
2014, 2015, 2016, 2017 concerning the incident month, the maximum values of precipitation in March in these respective
years ranged from 158.3 to 206.2 mm. Lastly, they reported that August to October proved to be the driest period of the years,
with 7.2 mm of average minimum precipitation in September, a fact similar to what was seen in this research.
Normally, rainfall in the state of Ceará has high spatial and temporal variability throughout the year, months from
February to May are known as the rainy season, when it is observed about 70% of the annual precipitation. According to the
climatology from 1981 to 2010, the PA in the rainy season in the state is 600.7 millimeters (Cortez, Lima & Sakamoto, 2017).
In this study, the PA in the rainy season (2013-2018) varied from 364.3-600.5 mm, with the last two years having the highest
rainfall indexes 551.6 and 600.5 mm. The rainfall levels found are compatible with other semi-arid regions of the country
(Lucena, Cabral Junior & Steinke, 2018; Francisco & Santos, 2017; Silva et al., 2018).
3.3.3 Compensated average relative humidity (RHCA)
The analyzed series of RHCA (2013-2018) in the state of Ceará showed that March and April were the wettest months
(Figure 4), in this period it was also observed greater precipitation (Figure 3), considering that high rainfall indexes the values
of humidity increase, since the relative humidity of the air takes atmospheric air as a reference, and this in turn is influenced by
both temperature and rainfall (De Carvalho Rocha & Dos Santos, 2017).
9Research, Society and Development, v. 10, n. 12, e181101220313, 2021
(CC BY 4.0) | ISSN 2525-3409 | DOI: http://dx.doi.org/10.33448/rsd-v10i12.20313
Figure 4. Compensated average relative humidity in the Ceará-Brazil (2013-2018).
Source: Authors.
RHCA for the state of Ceará during the studied period varied from 76.60% to 82.04% in the rainy season. The month
of April showed a high percentage of humidity in all the series analyzed, with values ranging from 78.20 to 87.35% (Figure 4).
According to FUNCEME (2015) the average relative humidity in Ceará from August to December 2015 was below 60%, a
value considered ideal for air humidity by the World Health Organization.
Relative humidity of the air is one of the climatic variables of relevant impact for the development or increase of
diseases in living beings. There are reports of respiratory diseases, complications in the life cycle of microorganisms, the
spread of viral diseases, among others, according to the humidity levels reached (Bo et al., 2020., Bueno et al., 2010; Silva et
al., 2015). In the series analyzed for the state of Ceará, it was noted that the humidity values corroborate with the typical
climatic classification of semiarid that mostly presents hot and dry weather.
3.4 Bivariate correlation between NCPPDS and climate variables
In the analysis of the correlation between the NCPPDS in the state of Ceará (2013-2018) and the climatic variables
(TCA, PA, and RHCA), it was possible to observe a strong degree of relationship between the variables in the period investigated
(Table 4).
10Research, Society and Development, v. 10, n. 12, e181101220313, 2021
(CC BY 4.0) | ISSN 2525-3409 | DOI: http://dx.doi.org/10.33448/rsd-v10i12.20313
Table 4. Annual Pearson correlation matrix between the number of cases of patients with primary dengue symptoms and
climate variables in the Ceará-Brazil (2013-2018).
Factor NCPPDS TCA PA RHCA
NCPPDS ρ2013=-0.83** ρ2013= 0.60* ρ2013= 0.75**
ρ2014= -0.90** ρ2014= 0.17 ρ2014= 0.53
1 ρ2015= -0.64* ρ2015= 0.29 ρ2015= 0.69*
ρ2016= -0.52 ρ2016= 0.19 ρ2016= 0.55
ρ2017= -0.64* ρ2017= 0.76** ρ2017= 0.89**
ρ 2018= -0.76** ρ2018= 0.70* ρ2018= 0.78**
TCA ρ2013= -0.83** ρ2013= -0.25 ρ2013= -0.58*
ρ2014= -0.90** ρ2014= -0.50 ρ2014= -0.76**
ρ2015= -0.64* 1 ρ2015= -0.57 ρ2015= -0.75**
ρ2016= -0.52 ρ2016= -0.38 ρ2016= -0.53
ρ2017= -0.64 ρ2017= -0.56 ρ2017= -0.66*
ρ2018= -0.76** ρ2018= -0.50 ρ2018= -0.70
PA ρ2013= 0.60* ρ2013= -0.25 ρ 2013= 0.89**
ρ2014= 0.17 ρ2014= -0.50 ρ2014= 0.88**
ρ2015= 0.29 ρ2015= -0.57 1 ρ2015= 0.86**
ρ2016= 0.19 ρ2016= -0.38 ρ2016= 0.83**
ρ2017= 0.76** ρ2017= -0.56 ρ2017= 0.92**
ρ2018= 0.70* ρ2018= -0.50 ρ2018= 0.89**
RHCA ρ2013= 0.75** ρ2013= -0.59 ρ2013= 0.89
ρ2014= 0.53 ρ2014= -0.76** ρ2014= 0.88**
ρ2015= 0.69* ρ2015= -0.75** ρ2015= 0.86** 1
ρ2016= 0.55 ρ2016= -0.53 ρ2016= 0.83**
ρ2017= 0.89** ρ2017= -0.66* ρ2017= 0.92**
ρ2018= 0.78** ρ2018= -0.70* ρ2018= 0.89**
NCPPDS: number of cases of patients with primary dengue symptoms; TCA: compensated average temperature; PA:
Average precipitation; RHCA: compensated average relative humidity.
* Significant correlation pResearch, Society and Development, v. 10, n. 12, e181101220313, 2021
(CC BY 4.0) | ISSN 2525-3409 | DOI: http://dx.doi.org/10.33448/rsd-v10i12.20313
thermal amplitudes with the cases of dengue and infestation of the Ae. aegypti, and the correlations had negative results
indicating an inversely proportional relationship. It is also reported that the average air temperature has low monthly thermal
amplitudes, with the minimum and maximum monthly thermal averages being optimal for the proliferation of the dengue
vector, thus precipitation becomes the differential in the climatic dynamics of the disease (Magalhães & Zanella, 2013).
In the state of Paraíba, also located in northeastern Brazil, the analysis of the spatial modeling of dengue cases and
climatic variables for three cities in that state during the period (2011-2014) showed that the average temperature, maximum
temperature, and minimum temperature did not present good correlation with dengue cases, the authors point out that the low
seasonal thermal amplitude of these climatic variables in the study area may have implications for this result, in this way, Ae.
aegypti always find ideal temperatures for its development throughout the year (Almeida & Silva, 2017).
Hay et al. (2000) through the analysis of monthly time series of severe dengue in Bangok, with monthly averages of
temperature and precipitation collected during 33 years, showed that the interannual periodicity of dengue was not
accompanied by similar periodic cycles of temperature and precipitation. The authors concluded that intrinsic factors such as
population immunity had a greater impact than the climate behind the epidemics.
Some studies cite temperature as one of the climatic variables strongly correlated with dengue, these studies point out
implications of temperature in all stages of development of the mosquito transmits dengue, as well as the interactions in the
different seasons of the year (Massad et al., 2011; Mutheneni et al. 2017; Vezzani, Velásquez & Schweigmann, 2004).
In contrast, in this research there was no positive correlation between the NCPPDS and annual TCA for the state of
Ceará, it is possible that characteristics of climatic seasonality of the 184 cities studied or even the vast territorial extension of
the state have implications for this result. Once the regions of the state of Ceará are influenced by variations in seasonal,
interannual and decennial scales under their temperatures (Costa, Mateus & Da Silva, 2014).
Pearson's correlation for NCPPDS and PA in Ceará can be classified in 2013, 2017 and 2018 as being strong and
positive, the incidence of NCPPDS was directly proportional to PA (Table 4), in the months of the rainy season there was greater
precipitation and high NCPPDS (Figure 2 and Figure 3). In 2013, 2017, and 2018 the variance shared by NCPPDS and PA was
significant, at the level of 36%, 58%, and 49%, in these respective years.
Other studies in some regions of Brazil also showed a positive correlation between precipitation and the frequency of
dengue cases, a higher number of dengue cases was found in periods with greater rainfall intensity (Duarte et al., 2019., De
Jesus Corrêa, Da Costa & Pereira, 2016, Siqueira et al., 2018; Silva & Magalhães, 2017). In particular, for Fortaleza, the
correlation analysis of the prevalence of diseases transmitted by the mosquito Ae. aegypti and the influence of climatic
variables (2013-2017) agrees with the findings of this research, where it was evidenced a strong relationship between dengue
and precipitation and relative humidity (Araújo, Uchoa & Alves, 2019). Contrary to these results, there are studies that report
the absence or weak correlation between the number of dengue cases and precipitation (Barbosa & Da Silva., 2016., Câmara et
al., 2009).
Two major dengue epidemics were recognized in Puerto Rico in the years 2007 and 2010, the analysis of the
correlation between dengue cases and precipitation showed a greater number of dengue cases in coastal areas, especially in the
north of the coast, places on the island that received more annual rainfall had a higher incidence of dengue, rain levels may
have contributed to these epidemics (Schimer et al., 2011).
In Delhi, capital of India, during the period from 2011 to 2016, Bisht et al. (2019) revealed that rain peaks and dengue
cases showed a two-month difference in the latency period, when this period was adjusted, a high positive correlation was
noted that demonstrates a clear dependence of dengue cases on precipitation.
The contribution of rain patterns to the increase in dengue epidemics was also noted in Sri Lanka from 2004 to 2015,
the country experienced progressive growth of the disease, mainly in urbanized areas and with a high population density. In the
12Research, Society and Development, v. 10, n. 12, e181101220313, 2021
(CC BY 4.0) | ISSN 2525-3409 | DOI: http://dx.doi.org/10.33448/rsd-v10i12.20313
Colombo district, there was a great spread of the disease and the precipitation factor was shown to play a vital role in the
spread of dengue, thus, a strong relationship was noted between the number of dengue cases and precipitation. It can be
observed that generally the dengue epidemic is activated significantly after 3-4 weeks of the beginning of the rains
(Edirisinghe, 2017).
Pearson's correlation discussed in this research identified a significant relationship between NCPPDS and PA for three
years. In all series studied there was a higher incidence of dengue in the rainy months, a fact that can be correlated with
precipitation. Although, as reported in the literature, the state of Ceará presents high climatic variability and spatial variability
of precipitation (Martins & Vasconcelos Júnior, 2017).
NCPPDS in Ceará was directly proportional to RHCA, Pearson's correlation showed a relationship ranging from very
strong to strong. In the years 2013, 2015 and 2018 the correlation was strong and positive, in 2017 a very strong and positive
correlation. The months of the rainy season had high humidity and higher NCPPDS (Fig. 2 and Fig.4), which corroborates with
the result exposed in Pearson's correlation matrix (Tab.4). The analysis of variance of the NCPPDS and RHCA showed shared
variance in 2013, 2015, 2017, and 2018, at the level of 56%, 48%, 79%, and 61%, respectively.
Rao et al. (2018) reported the prevalence of dengue in India from the month of July with a peak in September, and it is
notorious that climatic conditions of rain, temperature, and relative humidity favor the proliferation of the disease. Continuous
rains for a long period cause a temperature reduction from June to November, favoring the increase in relative humidity and
decreasing the evaporation rate, thus maintaining secondary reservoirs containing rainwater, which makes it favorable for the
development of the dengue vector.
In Tawau, Malaysia, dengue prediction models based on 12 years of study made a statistically significant cross-
correlation between climate predictors and the disease, in this data analysis an average relative humidity of 82.5% was verified
and the fact that all epidemics of dengue occurred with average relative humidity above 80% (Jayaraj et al., 2019).
According to Campbell et al. (2013), 80% of the 1.2 million cases of dengue in Thailand between (1983-2001)
occurred when the average temperature was 27.0 to 29.5°C and the humidity was greater than 75%. These studies prove the
correlation between humidity and dengue incidence, a fact similar to that found in this research, where it was possible to notice
that precipitation and humidity are critical variables for the increase of NCPPDS in the state of Ceará.
Humidity is reported by Vargas et al. (2010) as a variable that affects the development of Ae. aegypti, changes in the
mosquito are body size estimated by the size of the wing, as well as by a traditional estimate of its length, and these estimates
were highly correlated with humidity. Brisht et al. (2019) stated that humidity favors the useful life of mosquitoes, so with the
increase in humidity, the mosquito is life days increase, leading to the conclusion of the extrinsic incubation period for the
dengue virus in Aedes.
Some research in Brazil has shown the humidity variable as being relevant for the development of the dengue-
carrying mosquito and the incidence in the number of cases of the disease (Custódio et al., 2019; Correia, 2017; Degener et al.,
2014; Silva et al., 2015). The degree of correlation of the NCPPDS and RHCA showed in Tab.4 reveals humidity as the variable
with the greatest direct association with dengue, followed by precipitation, both showed a strong degree of relationship with
each other since rainier days tend to be wetter. This result agrees with Araújo, Uchôa & Alves (2019) which showed a strong
relationship between the variables precipitation and humidity with dengue, Zika and chikungunya diseases for the city of
Fortaleza during the period (2013-2017).
In this research, it was possible to notice the interrelationship between the climatic variables, hotter and drier months
tend to have lower levels of precipitation and humidity, colder and humid months tend to have higher values of precipitation
and humidity, this fact may favor the increase breeding sites of the dengue-transmitting mosquito, as a consequence there may
13Research, Society and Development, v. 10, n. 12, e181101220313, 2021
(CC BY 4.0) | ISSN 2525-3409 | DOI: http://dx.doi.org/10.33448/rsd-v10i12.20313
be an increase in the NCPPDS. The relationship between dengue and the climatic variables studied for the state of Ceará (2013-
2018) can be summarized in Figure 5, which was built based on the analysis of Pearson's correlation shown in Table 4.
Figure 5. Relationship of dengue with climate variables in the state of Ceará-Brazil (2013-2018).
Source: Authors.
It was observed a significant correlation between dengue and climatic variables, and a directly proportional
relationship between dengue (Figure 5), relative humidity and precipitation (↑↑), and inversely proportional between dengue
and temperature (↑↓).
Based on the data discussed in this research and other studies on dengue, it is clear that dengue is influenced by
climatic variables, although other factors may collaborate to trigger major epidemics of the disease, such as lack of urban
planning and health education.
4. Conclusion
The analysis of the dengue databases in the state of Ceará (2013-2018) obtained by SINAN together with the
climatological data of TCA, PA, and RHCA, coming from INMET and FUNCEME allowed to identify a significant correlation
between climatic variables and NCPPDS. In all the annual series analyzed, the city of Fortaleza, capital of the state of Ceará, was
in the ranking of the cities most affected by dengue, followed by its metropolitan region, and 2015 was the year with the
highest incidence of dengue cases in the state.
Pearson's correlation showed a strong and inversely proportional relationship between NC PPDS and TCA in five of the
years studied. PA and RHCA have a directly proportional relationship with the NC PPDS. In four years of the series studied RHCA
had a significant correlation with the number of dengue cases, the variable with the greatest direct and positive association,
followed by precipitation.
All climatic variables analyzed in this research are associated with the NC PPDS. The degree of association and how it
occurs differs like the relationship. The inversely proportional correlation of TCA with dengue does not reveal that this variable
is not relevant for situational analysis of the disease, since the mechanisms of dengue transmission, the stages of development
of the dengue-transmitting mosquito are notably affected by variations in temperature. Factor as high climatic variability of the
state of Ceará may have caused the inverse nature of this relationship, which does not mean that the temperature in the state is
not an associated factor with the NCPPDS, there is no simultaneity in these values, that is, high-temperature values do not cause
14Research, Society and Development, v. 10, n. 12, e181101220313, 2021
(CC BY 4.0) | ISSN 2525-3409 | DOI: http://dx.doi.org/10.33448/rsd-v10i12.20313
necessarily increase in cases of dengue, since the semi-arid climate would be conducive to the proliferation of mosquitoes and
consequently the disease all year round.
These results can be useful for developing strategies to combat dengue since it was clear that rainy months in the state
of Ceará have a higher incidence of cases of the disease associated with RH CA between 78.20 to 87.35%, these climatic
variables can be used as good predictors of disease infestation. Therefore, the differential in this association is to perceive the
interrelationship between the variables, correlated climatic characteristics can favor the generation of dengue epidemics
worldwide, the complexity of this disease requires that environmental and social factors are also observed so that it is possible
to expand dengue prevention and control measures.
Therefore, the differential in this association is to perceive the interrelationship between variables, correlated climatic
characteristics can favor the generation of dengue epidemics worldwide, the complexity of this disease requires that they also
be observed environmental and social factors, so that it is possible to expand the prevention and control measures of dengue.
Future research and work may investigate the socioeconomic situation, age and sex of people most affected by dengue
in the state of Ceará, a temporal analysis or prediction of epidemic events through other statistical models may increase the
level of correlation of climate variables with the dengue.
Acknowledgments
The authors would like to thank the Cearense Foundation for Research Support (FUNCAP), research project n°
3781047/2017, the Secretary of Health of the State of Ceará (SESA) and the Government of the State of Ceará.
References
Almeida, C. A. P., & Silva, R. M. (2017). Modelagem espacial dos casos de dengue e variáveis socioambientais em João Pessoa, Cabedelo e Bayeux, Paraíba.
Revista Brasileira de Geografia Física, 10(05), 1455-1470.
Andrade, E. M. D., Silva, B. B. D., Rodrigues, M. M. A., Mendonça, M. A. B., & Chaves, L. C. G. (2012). Extreme temperature trends in the equatorial region
of Brazil: Case study of the state of Ceará. Revista Ciência Agronômica, 43, 262-272.
Araújo, R. A. F., Uchôa, N. M., & Alves, J. M. B. (2019). Influência de Variáveis Meteorológicas na Prevalência das Doenças Transmitidas pelo Mosquito
Aedes Aegypti. Revista Brasileira de Meteorologia, 34, 439-447.
Barbosa, I. R., & da Silva, L. P. (2015). Influência dos determinantes sociais e ambientais na distribuição espacial da dengue no município de Natal-RN.
Revista Ciência Plural, 1(3), 62-75.
Bhatt, S., Gething, P. W., Brady, O. J., Messina, J. P., Farlow, A. W., Moyes, C. L., & Hay, S. I. (2013). The global distribution and burden of dengue. Nature,
496(7446), 504-507.
Bisht, B., Kumari, R., Nagpal, B. N., Singh, H., Kumar, S., Gupta, A. K., & Tuli, N. R. (2019). Influence of environmental factors on dengue fever in Delhi.
International Journal of Mosquito Research, 6(2), 11-18.
Bo, Z., Ma, Y., Chang, Z., Zhang, T., Liu, F., Zhao, X., & Li, Z. (2020). The spatial heterogeneity of the associations between relative humidity and pediatric
hand, foot and mouth disease: Evidence from a nation-wide multicity study from mainland China. Science of The Total Environment, 707, 136103.
Brasil., 2017. Governo do Estado do Ceará. Secretaria da Saúde. Monitoramento dos casos de dengue, chikungunya e Zika até a semana epidemiológica 39 de
2017. Boletim Epidemiológico 39, 1-13.
Brasil., 2019. Ministerio da Saúde. Secretaria de Vigilância em Saúde. Monitoramento dos casos de dengue, febre de chikungunya e doença aguda pelo vírus
Zika até a Semana Epidemiológica 52 de 2018. Boletim Epidemiológico, 50 (4), 1-14.
Bueno, F. F., Fonseca, A. R., Braga, F. A., & Miranda, P. S. C. (2010). Qualidade do ar e internações por doenças respiratórias em crianças no município de
Divinópolis, Estado de Minas Gerais. Acta Scientiarum. Health Sciences, 32(2), 185-189.
Câmara, F. P., Gomes, A. F., Santos, G. T. D., & Câmara, D. C. P. (2009). Clima e epidemias de dengue no Estado do Rio de Janeiro. Revista da Sociedade
Brasileira de Medicina Tropical, 42(2), 137-140.
Campbell, K. M., Lin, C. D., Iamsirithaworn, S., & Scott, T. W. (2013). The complex relationship between weather and dengue virus transmission in Thailand.
The American journal of tropical medicine and hygiene, 89(6), 1066.
Correia, W. L. F. (2017). Influence of meteorological variables on dengue incidence in the municipality of Arapiraca, Alagoas, Brazil. Revista da Sociedade
Brasileira de Medicina Tropical, 50, 309-314.
15Research, Society and Development, v. 10, n. 12, e181101220313, 2021
(CC BY 4.0) | ISSN 2525-3409 | DOI: http://dx.doi.org/10.33448/rsd-v10i12.20313
Cortez, H. D. S., Lima, G. P. D., & Sakamoto, M. S. (2017). A seca 2010-2016 e as medidas do Estado do Ceará para mitigar seus efeitos. Parcerias
Estratégicas, 22(44), 83-118.
Costa, I. M., Mateus, A. E., & Da Silva, D. F. (2014). Escalas temporais e tendências observadas nas temperaturas m áximas no Estado do Ceará Timescales
and observed trends in the highest temperatures in the state of Ceará. AMBIÊNCIA, 10(2), 465-487.
Costa, J. A., & Silva, D. D. (2017). Distribuição espaço-temporal do Índice de anomalia de chuva para o Estado do Ceará. Revista brasileira de geografia
física, 10(4), 1002-1013.
Chizzotti, A. (2018). Pesquisa em ciências humanas e sociais. Cortez editora.
Custódio, J. M. D. O., Nogueira, L. M. S., Souza, D. A., Fernandes, M. F., Oshiro, E. T., Oliveira, E. F. D., & Oliveira, A. G. D. (2019). Abiotic factors and
population dynamic of Aedes aegypti and Aedes albopictus in an endemic area of dengue in Brazil. Revista do Instituto de Medicina Tropical de São Paulo,
61.
de Carvalho Rocha, J. V., & dos Santos, V. A. (2017). Caracterização De Mudanças Climáticas Na Cidade Do Recife Utilizando Séries Temporais. Revista
Brasileira de Climatologia, 20.
de Jesus Corrêa¹, J. A., da Costa, A. C. L., & Pereira, I. C. N. (2016). Associação entre a precipitação pluviométrica e a incidência de dengue em sete
municípios do estado do Pará. Revista Brasileira de Geografia Física, 9(07), 2264-2276.
de Medeiros Silva, F. C., de Souza Bezerra, H., de Araújo, A. O. C., de Carvalho, L. E. S., & da Silva, J. A. (2021). Estudo temporal das arboviroses: Uma
análise espacial. Research, Society and Development, 10(7), e10910716220-e10910716220.
de Oliveira, E. H., Rodrigues, F. R., Coêlho, M. B., Verde, R. M. C. L., & Sousa, F. D. C. A. (2020). Análise epidemiológica dos casos de dengue no Estado
do Maranhão, Brasil. Research, Society and Development, 9(4), e78942491-e78942491.
Degener, C. M., Ázara, T. M. F. D., Roque, R. A., Codeço, C. T., Nobre, A. A., Ohly, J. J., & Eiras, Á. E. (2014). Temporal abundance of Aedes aegypti in
Manaus, Brazil, measured by two trap types for adult mosquitoes. Memórias do Instituto Oswaldo Cruz, 109, 1030-1040.
Duarte, J. L., Diaz-Quijano, F. A., Batista, A. C., & Giatti, L. L. (2019). Climatic variables associated with dengue incidence in a city of the Western Brazilian
Amazon region. Revista da Sociedade Brasileira de Medicina Tropical, 52.
Edirisinghe, G. (2017). Contribution of rainfall patterns for increased dengue epidemic in Sri Lanka. American Scientific Research Journal for Engineering,
Technology, and Sciences (ASRJETS), 35(1), 284-294.
Evans, J. D. (1996). Straightforward statistics for the behavioral sciences. Thomson Brooks/Cole Publishing Co.
Field, A. (2009). Descobrindo a estatística usando o SPSS-5. Penso Editora.
Flahault, A., de Castaneda, R. R., & Bolon, I. (2016). Climate change and infectious diseases. Public health reviews, 37(1), 1-3.
Francisco, P. R. M., & Santos, D., 2017. Climatologia do estado da Paraíba. EDUFCG, Campina Grande.
FUNCEME, 2015. Fundação Cearense de Metorologia e Recursos Hídricos.Umidade relativa cai em nível de emergência no Ceará. Avaliabe at:.
http://www.funceme.br/?p=1316. (Accessed 02 August 2019).
Guzman, M. G., & Harris, E. (2015). Dengue. The Lancet, 385(9966), 453-465.
Hay, S. I., Myers, M. F., Burke, D. S., Vaughn, D. W., Endy, T., Ananda, N., & Rogers, D. J. (2000). Etiology of interepidemic periods of mosquito-borne
disease. Proceedings of the National Academy of Sciences, 97(16), 9335-9339.
IBGE., 2019. Instituto Brasileiro de Geografia e Estatística. https://cidades.ibge.gov.br/brasil/ce/panorama.
INMET., 2020. Instituto Nacional de Metereologia. http://www.inmet.gov.br/portal/index.php?r=clima/normaisClimatologicas.
IPECE, 2017. Instituto de Pesquisa e Estratégia Econômica do Ceará. Ceará em números 2017. https://www.ipece.ce.gov.br/ceara-em-numeros. (Accessed 17
September 2019).
IPECE, 2019. Instituto de Pesquisa e Estratégia Econômica do Ceará. https://ipecedata.ipece.ce.gov.br/ipece-data-web/module/perfil-regional.xhtml.
Jayaraj, V. J., Avoi, R., Gopalakrishnan, N., Raja, D. B., & Umasa, Y. (2019). Developing a dengue prediction model based on climate in Tawau, Malaysia.
Acta tropica, 197, 105055.
Lima, E. P., Goulart, M. O. F., Albuquerque, M. R., Victor, F. M., & Pinto, N. B. (2013). Série histórica da dengue e do Aedes aegypti no Ceará. Revista
Brasileira em Promoção da Saúde, 26(3), 340-348.
Lucena, R. L., Cabral, J. B., & Steinke, E. T. (2018). Comportamento Hidroclimatológico do Estado do Rio Grande do Norte e do Município de Caicó. Revista
Brasileira de Meteorologia, 33, 485-496.
Magalhães, G. B., & Zanella, M. E. (2013). Comportamento espacial da dengue e sua relação com o clima na região metropolitana de Fortaleza. Revista
Brasileira de Climatologia, 12.
Martins, E. S. P. R., & Vasconcelos Júnior, F. D. C. (2017). O clima da Região Nordeste entre 2009 e 2017: monitoramento e previsão. Parcerias estratégicas,
22(44), 63-79.
16Research, Society and Development, v. 10, n. 12, e181101220313, 2021
(CC BY 4.0) | ISSN 2525-3409 | DOI: http://dx.doi.org/10.33448/rsd-v10i12.20313
Massad, E., Coutinho, F. A. B., Lopez, L. F., & Da Silva, D. R. (2011). Modeling the impact of global warming on vector-borne infections. Physics of Life
Reviews, 8(2), 169-199.
Mordecai, E. A., Cohen, J. M., Evans, M. V., Gudapati, P., Johnson, L. R., Lippi, C. A., & Weikel, D. P. (2017). Detecting the impact of temperature on
transmission of Zika, dengue, and chikungunya using mechanistic models. PLoS neglected tropical diseases, 11(4), e0005568.
Mutheneni, S. R., Morse, A. P., Caminade, C., & Upadhyayula, S. M. (2017). Dengue burden in India: recent trends and importance of climatic parameters.
Emerging microbes & infections, 6(1), 1-10.
Paula, D. P. D., Dias, J. M. A., Ferreira, Ó., & Morais, J. O. (2013). High-rise development of the sea-front at Fortaleza (Brazil): Perspectives on its valuation
and consequences. Ocean & coastal management, 77, 14-23.
Rao, M. R. K., Padhy, R. N., & Das, M. K. (2018). Episodes of the epidemiological factors correlated with prevailing viral infections with dengue virus and
molecular characterization of serotype-specific dengue virus circulation in eastern India. Infection, Genetics and Evolution, 58, 40-49.
Santos, D. N. D., da Silva, V. D. P., Sousa, F. D. A., & Silva, R. A. (2010). Estudo de alguns cenários climáticos para o Nordeste do Brasil. Revista Brasileira
de Engenharia Agrícola e Ambiental, 14, 492-500.
Schirmer, P. L., Lucero, C., Oda, G., & Holodniy, M. (2011). Correlation of Annual Precipitation with Dengue Infections in Puerto Rico Veterans Affairs
Facilities, 2007-2010. American Journal of Infection Control, 39(5), E66-E67.
Silva, A. M., Silva, R. M. D., Almeida, C. A. P. D., & Chaves, J. J. D. S. (2015). Modelagem geoestatística dos casos de dengue e da variação
termopluviométrica em João Pessoa, Brasil. Sociedade & Natureza, 27, 157-169.
Silva, F. G., & Magalhães, S. C. M. (2017). Correlação Entre Fatores Climá Ticos, Socioambientais E A Dengue Na Microrregião Montes Claros/MG.
Caminhos de Geografia, 18(61), 231-244.
Silva, M. J. D., Queiroz, M. G. D., Jardim, A. M. D. R. F., Araújo Júnior, G. D. N., & Silva, T. G. F. D. (2018). Gradientes pluviométricos do estado de
Pernambuco: uma análise do litoral ao semiárido.
Siqueira, I. S., Queiroz, J. C. B., Amin, M. M., & Câmara, R. K. C. (2018). A Relação da Incidência de Casos de Dengue com a Precipitação na Área Urbana
de Belém-PA, 2007 a 2011, Através de Modelos Multivariados de Séries Temporais. Revista Brasileira de Meteorologia, 33, 380-389.
Vargas, R. E. M., Ya-Umphan, P., Phumala-Morales, N., Komalamisra, N., & Dujardin, J. P. (2010). Climate associated size and shape changes in Aedes
aegypti (Diptera: Culicidae) populations from Thailand. Infection, Genetics and Evolution, 10(4), 580-585.
Vezzani, D., Velázquez, S. M., & Schweigmann, N. (2004). Seasonal pattern of abundance of Aedes aegypti (Diptera: Culicidae) in Buenos Aires city,
Argentina. Memórias do Instituto Oswaldo Cruz, 99(4), 351-356.
Viana, D. V., & Ignotti, E. (2013). A ocorrência da dengue e variações meteorológicas no Brasil: revisão sistemática. Revista Brasileira de Epidemiologia, 16,
240-256.
WHO (2019). World Health Organization. https://www.who.int/denguecontrol/epidemiology/en.
WHO (2019). World Health Organization. Global strategy for dengue prevention and control 2012-2020, p.43.
Wu, X., Lang, L., Ma, W., Song, T., Kang, M., He, J., & Ling, L. (2018). Non-linear effects of mean temperature and relative humidity on dengue incidence in
Guangzhou, China. Science of the Total Environment, 628, 766-771.
Xu, Z., Bambrick, H., Yakob, L., Devine, G., Lu, J., Frentiu, F. D., & Hu, W. (2019). Spatiotemporal patterns and climatic drivers of severe dengue in
Thailand. Science of the Total Environment, 656, 889-901.
Zell, R., Krumbholz, A., & Wutzler, P. (2008). Impact of global warming on viral diseases: what is the evidence? Current Opinion in Biotechnology, 19(6),
652-660.
Zhou, H., Deng, Z., Xia, Y., & Fu, M. (2016). A new sampling method in particle filter based on Pearson correlation coefficient. Neurocomputing, 216, 208-
215.
17You can also read