GITT Analysis of Lithium Insertion Cathodes for Determining the Lithium Diffusion Coefficient at Low Temperature: Challenges and Pitfalls - IOPscience
←
→
Page content transcription
If your browser does not render page correctly, please read the page content below
Journal of The Electrochemical
Society

OPEN ACCESS

GITT Analysis of Lithium Insertion Cathodes for Determining the Lithium
Diffusion Coefficient at Low Temperature: Challenges and Pitfalls
To cite this article: A. Nickol et al 2020 J. Electrochem. Soc. 167 090546

View the article online for updates and enhancements.

                                This content was downloaded from IP address 46.4.80.155 on 21/11/2020 at 00:15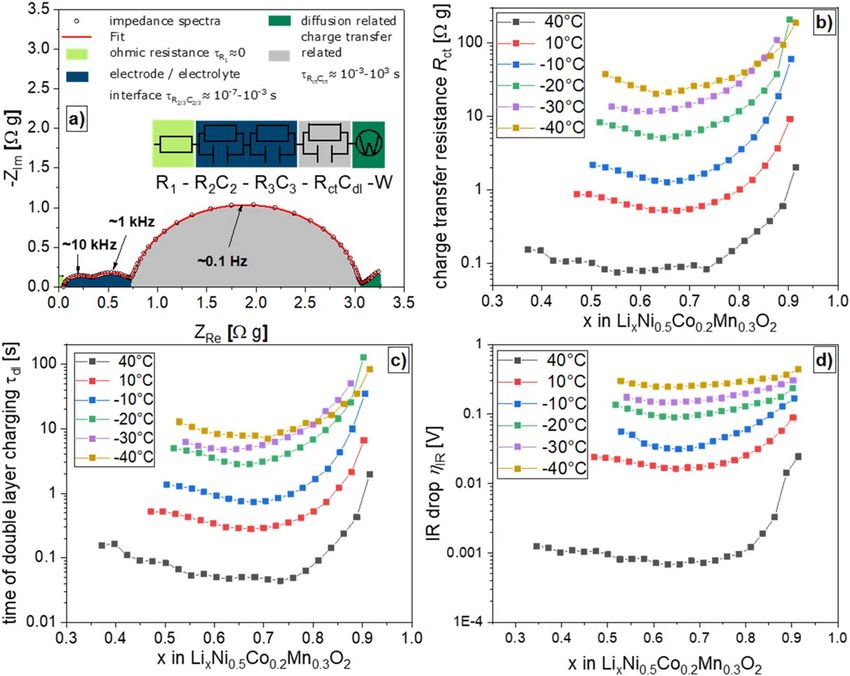
Journal of The Electrochemical Society, 2020 167 090546

                                GITT Analysis of Lithium Insertion Cathodes for Determining the
                                Lithium Diffusion Coefficient at Low Temperature: Challenges
                                and Pitfalls
                                A. Nickol,1,z T. Schied,2 C. Heubner,1 M. Schneider,1 A. Michaelis,1,2 M. Bobeth,2 and
                                G. Cuniberti2,3,4
                                1
                                  Fraunhofer IKTS, Fraunhofer Institute for Ceramic Technologies and Systems Dresden, 01277 Dresden, Germany
                                2
                                  Institute for Materials Science and Max Bergmann Center of Biomaterials, TU Dresden, 01062 Dresden, Germany
                                3
                                  Center for Advancing Electronics Dresden, TU Dresden, 01062 Dresden, Germany
                                4
                                  Dresden Center for Computational Materials Science (DCMS), TU Dresden, 01062 Dresden, Germany

                  Understanding the diffusion of lithium ions in electrode materials for lithium ion batteries is of great importance for their
                  knowledge-based optimization and development of novel materials and cell designs. The galvanostatic intermittent titration
                  technique (GITT) is widely applied in battery research to study the diffusion of lithium in anode and cathode materials depending
                  on the degree of lithiation. While transport properties of electrode materials at high and ambient temperatures are largely available,
                  low temperature diffusion and rate coefficients are hardly reported in the literature and vary by orders of magnitude for identical
                  active materials. Herein, we demonstrate and discuss several challenges and pitfalls in the application and evaluation of GITT
                  measurements for determining the effective chemical lithium ion diffusion coefficient in lithium insertion electrodes, which
                  become especially important at low temperature. This includes theoretical considerations and an experimental analysis of the
                  promising cathode material LiNi0.5Co0.2Mn0.3O2 (NCM523) in the wide temperature range of −40 °C to 40 °C. We show how the
                  choice of experimental conditions for the GITT measurements and of the subsequent mathematical evaluation significantly
                  influence the derived diffusion coefficient. The results suggest that the large scattering of reported values of the diffusion
                  coefficient could be caused by the use of different evaluation procedures. Simple calculation methods appear to be less suited the
                  lower the temperature is. It is shown that the complementary use of GITT and EIS supplemented by detailed knowledge of the
                  microstructure of the electrode significantly improves the accuracy of determining the diffusion coefficient.
                  © 2020 The Author(s). Published on behalf of The Electrochemical Society by IOP Publishing Limited. This is an open access
                  article distributed under the terms of the Creative Commons Attribution Non-Commercial No Derivatives 4.0 License (CC BY-
                  NC-ND, http://creativecommons.org/licenses/by-nc-nd/4.0/), which permits non-commercial reuse, distribution, and reproduction
                  in any medium, provided the original work is not changed in any way and is properly cited. For permission for commercial reuse,
                  please email: permissions@ioppublishing.org. [DOI: 10.1149/1945-7111/ab9404]

                  Manuscript submitted January 27, 2020; revised manuscript received April 16, 2020. Published June 1, 2020. This paper is part of
                  the JES Focus Issue on Battery Safety, Reliability and Mitigation.

    Lithium ion batteries (LIBs) are widely applied to power portable                   These electrochemical techniques are advantageous over other
electronics and considered to be among the most promising                               characterization techniques, since the lithium diffusion is directly
candidates enabling large-scale application of electric vehicles due                    related to the measured current and voltage. Among the different
to their high energy density, good cycle life, and excellent storage                    electrochemical methods available for the determination of diffusion
characteristics when compared to other battery chemistries.1–4                          coefficients, GITT is most often applied and considered the most
However, the performance is dramatically reduced at low tempera-                        reliable method.26,28 However, while diffusion data at room tempera-
ture, limiting the deployment of LIBs under cold conditions, such as                    ture are largely available for many active materials, low temperature
space applications and plug-in hybrid and all-electric vehicles in the                  diffusion coefficients are hardly accessible. Moreover, despite missing
polar and subpolar zone.5,6 Despite considerable impact on the cycle                    information on the low temperature diffusion, it should be noted that
life7,8 and safety features,9,10 low temperature above all affects the                  lithium diffusion data reported for intercalation materials can vary by
rate capability of LIBs.11,12 This is essentially due to the slowdown                   orders of magnitude for identical materials.29–31
of the lithium transport and transfer mechanisms inside the elec-                           Herein, we demonstrate and discuss several challenges and pitfalls
trodes and the electrolyte, leading to high overvoltage and reduced                     in the application of GITT measurements for determining the effective
capacity at higher loads.5,6 Particularly, the charge transfer at the                   (or apparent) chemical lithium diffusion coefficient in intercalation
electrode/electrolyte interface13,14 and the lithium diffusion in the                   materials with focus on low temperatures. As a representative of
solid active material15,16 are expected to significantly slow down at                    layered oxides, we used the cathode material LiNi0.5Co0.2Mn0.3O2
low temperature.17 The targeted optimization of the rate perfor-                        (NCM523). Our study includes theoretical considerations and experi-
mance at low temperature requires a profound understanding and                          mental results in the temperature range from 40 °C down to −40 °C.
accurate quantification of the rate limiting processes at low                            After a brief report of our experimental analysis, we present different
temperatures. Modeling and simulation of the complex mass and                           evaluation procedures commonly applied in the literature for deter-
charge transport processes inside LIB can provide such fundamental                      mining the effective chemical lithium diffusion coefficient from GITT
insights and corresponding optimization potentials.18–21 However,                       data. The mathematical derivation of corresponding formulas is done
for realistic simulations of the complex interdependent processes                       for a spherical geometry of the oxide particles. The values for the
occurring in LIB, accurate experimental data are urgently                               effective chemical lithium diffusion coefficient in NCM523 derived
needed.22,23 For this purpose, various electrochemical techniques                       by the different methods show considerable deviations. We discuss
have been employed. Particularly, galvanostatic intermittent titration                  the main difficulties in extracting accurate diffusion data from the
technique (GITT),24 potentiostatic intermittent titration technique                     GITT measurements at low temperature and high degree of lithiation.
(PITT),25 electrochemical impedance spectroscopy (EIS), and cyclic                      The impact of experimental parameters, such as temperature, degree
voltammetry (CV) are frequently applied to investigate the lithium                      of lithiation (or state of charge—SOC), and applied current is
(de)intercalation and to determine corresponding parameters, such as                    investigated. Furthermore, the impact of the mathematical evaluation
the exchange current density and lithium diffusion coefficient.26,27                     procedure on the obtained diffusion coefficient is analyzed. Finally,
                                                                                        we summarize major challenges and pitfalls of GITT analysis and
                                                                                        conclude critical aspects to consider for the accurate determination of
  z
      E-mail: alexander.nickol@ikts.fraunhofer.de                                       the effective chemical lithium diffusion coefficient at low temperature.
Journal of The Electrochemical Society, 2020 167 090546

                            Experimental
                                                                                                       ¶c    1 ¶ 2 ¶c
    GITT measurements were performed on LiNi0.5Co0.2Mn0.3O2-based                                         =D 2  r                                     [1]
electrodes (NCM523) in a temperature range of −40 °C to 40 °C. The                                     ¶t   r ¶r ¶r
NCM523 electrodes and pristine NCM523 powder were received from
a commercial supplier (MTI Corp.). They consist of 94.2 wt% active          with the initial condition c (r , t = 0) = c0 and the boundary condi-
material (LiNi0.5Co0.2Mn0.3O2), 2.9 wt% binder (polyvinylidene              tions
fluoride (PVDF)), and 2.9 wt% conducting additive (carbon black),                             ¶c                       ¶c
coated on an aluminum current collector foil. Raw materials and                                         = 0,     -D                 = jS              [2]
electrodes were examined by scanning electron microscopy, energy-                            ¶r   r=0                 ¶r   r = rP
dispersive X-ray spectroscopy, and Brunauer–Emmett–Teller (BET)
gas adsorption measurements. For the determination of the particle size         In the Eqs. 1 and 2, D is the lithium diffusion coefficient and jS is
distribution, the NCM523 cathode was dispersed in N-methyl-2-               the lithium flux density at the particle surface (dimension mol m−2 s−1,
pyrrolidone (NMP) and transferred in an overhead mixer to extract           positive sign for outward diffusion). The diffusion coefficient generally
the binder phase. Afterwards the sample was again dispersed and             depends on the lithium ion concentration. However, for describing the
diluted in NMP. Similarly, samples with pure conductive additive were       diffusion during a single GITT pulse, this dependence can be neglected
prepared. Static light scattering measurements were then carried out        if the change in lithium concentration is small (i.e. for small pulse
using a Mastersizer2000 (Malvern Instruments®) to determine the             duration and current). The solution c (r , t ) of this diffusion problem
particle size distributions of the composite and the conductive additive.   can be found in Refs. 35, 36. The change in the stoichiometry, xS , of
Electrochemical measurements were carried out using T-type                  the lithium intercalation host (e.g. LixNi0.5Co0.2Mn0.3O2) at the particle
Swagelok® cells (3-electrode arrangement) made of polyflouralkoxy            surface is then given by
polymer and a multichannel potentiostat with an integrated frequency
response analyzer VMP3 (Biologic®). The cells were assembled in an                                     cS (t )        j rP ⎛ D t ⎞
                                                                                           xS (t ) =           = x0 - S    f⎜        ⎟                [3]
argon-filled glove box (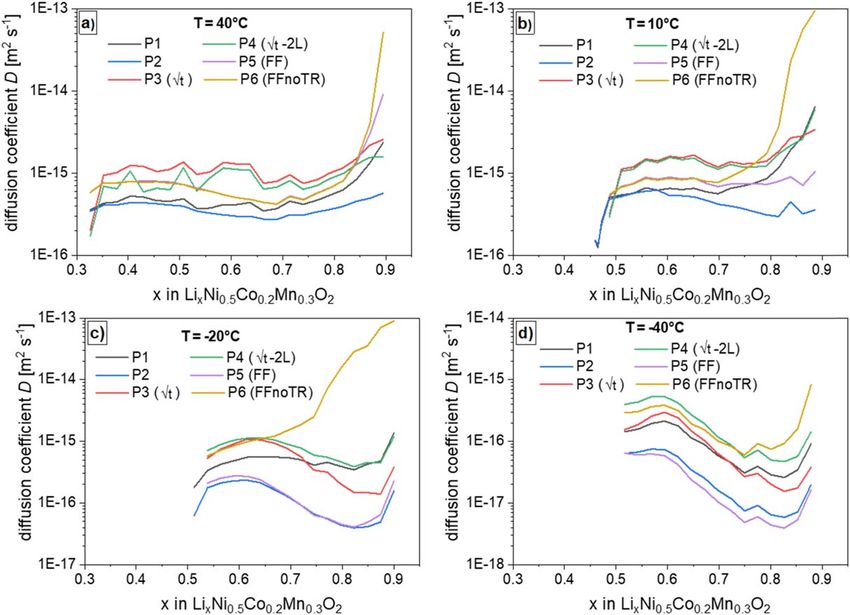
Journal of The Electrochemical Society, 2020 167 090546
contributions hOhm due to the ohmic resistance and hCT due to the because of the square-root time dependence E (t ) - E1 µ t , as well
charge transfer resistance at the solid-electrolyte interface. as due to a certain transition time caused by the charging of the double
Neglecting changes of hOhm and hCT during one GITT pulse owing layer capacitance of the solid/electrolyte interface (discussed in more
to the change of the stoichiometry xS (t ) , the potential change during detail below). The latter particularly applies to lower temperatures.
a GITT pulse can be expressed as While at higher temperature an initial kink in the potential is well
defined, a smooth transition is observed at lower temperature (cf.
E (t ) = hOhm + hCT + Eeq (xS (t )) [6] Fig. 2a). An analogous difficulty due to double layer discharging
concerns the determination of the characteristic potential value E3. In
The effective chemical lithium diffusion coefficient in the active some cases, we found that a kink-like change in the potential curve at
material can be derived from the GITT potential response by E3 was more clearly pronounced than the one at E1. Then, the use of
following the method by Weppner and Huggins.24 In the present value E3 can be more appropriate for determining the diffusion
context of spherical particles, we find from Eqs. 3 to 5 in the limit coefficient. Supposing that the first IR drop, E1 - E0, is identical to
D t rP2 1 the second one, E2 - E3, the denominator E2 - E1 in Eq. 11 can be
dEeq (x ) dxS jS dEeq (x ) replaced by E3 - E0 (cf. Fig. 1), which yields
dE 2
= =- [7]
d t dx d t p D cmax dx 4 ⎛ E4 - E 0 ⎞ rP2
2
D = ·⎜ ⎟ · [12]
which yields the well-known formula for the diffusion coefficient 9p ⎝ E3 - E 0 ⎠ tP
4 ⎛ jS dEeq dx ⎞ Using formula 12 is referred to as calculation procedure P2. A
2
D= ⎜ ⎟ [8] more precise estimation of the diffusion coefficient is based on the
p ⎝ cmax dE d t ⎠ plot of the potential E (t ) vs t from E0 to E2 (Fig. 2b). From such a
plot, the derivative dE d t can be derived by linear regression
(corresponding to formula (36) in Ref. 24). Assuming the lithium within a suitable time interval, where the t behavior is valid. In the
concentration to be close to equilibrium after the relaxation period, fits in Figs. 2b and 2c, we used only the first 20% of the data points
dEeq dx is approximated by (E4 - E0 ) Dx (cf. Fig. 1). The stoichio- (i.e. up to 360 s) to obey the applicability condition t rP2 D of
metry change per pulse is given by Dx = - IP tP (F Vacm cmax ) , where formula (10). For demonstration purpose, we included in the fit
IP is the galvanostatic current (positive sign for charging), tP the Fig. 2b also the data points of the initial transition region. Such a
pulse duration, F the Faraday constant, and Vacm the volume of calculation of the diffusion coefficient by formula (10) using
the cathode material. The lithium surface flux density into the dE d t from a single line fit is referred to as procedure P3. As
particle can be expressed by jS = IP (F Aacm ) , where Aacm is the can be seen in Fig. 2b, inclusion of the initial data points in the fit,
electrochemically active surface area of the cathode material. Inserting which do not obey the t behavior, leads to a higher slope of the
the above relations for dEeq dx and jS into Eq. 8 yields fitted line and consequently to a smaller diffusion coefficient. While
this is of minor importance at higher temperatures with small
4 ⎛ Vacm E4 - E 0 ⎞
2
transition times less than 1 s, this is no longer appropriate at low
D= ⎜ ⎟ [9] temperature (cf. Fig. 2b). To exclude the initial data points from the
p ⎝ A acm tP dE d t ⎠
fit, which do not obey the t behavior, we performed a two-line (2L)
The determination of the active surface area Aacm of a porous fit as shown in Fig. 2c. The fit was done in a way that both lines
composite electrode is generally a difficult task. Recent studies point simultaneously fit the corresponding data points best. The intersec-
out that in case of narrow particle size distributions surface-area- and tion of the two lines determines the duration of the initial potential
volume-based mean approximations are sufficient to predict over- increase, which is excluded from the determination of the slope
voltage and electrode capacity if kinetic losses are dominated either dE d t . With this more accurate value of dE d t , the diffusion
by reaction at the surface or diffusion processes, respectively.37 coefficient results again by using formula (10). This 2L-fit method is
Therefore, Aacm is often approximated by employing the specific referred to as calculation procedure P4. To further improve the
surface area aS = 3eacm rP of an ensemble of spherical particles of determination of the diffusion coefficient by employing data of the
equal radius rP and volume fraction eacm.38 In this case, inserting whole pulse, a so-called least squares GITT technique has been
Aacm = aS·Vtot and Vacm = εacm·Vtot (Vtot is the total electrode reported in Ref. 39, which implies a Pade approximation in a
volume) into Eq. 9, one finds reduced-order lithium ion cell model. This approach allows im-
proved simulation of GITT pulses when compared to the mere t
dependence. In the present study, we performed a fit of the pulse
4 ⎛ rP E 4 - E 0 ⎞
2
D= ⎜ ⎟ [10] E (t ) in Eq. 6 in combination with xS (t ) in Eq. 3 to all data points
9p ⎝ tP dE d t ⎠ measured within the pulse time tP (cf. Fig. 2d). This allows to
employ also data points that do not fulfill t rP2 D for determining
If the whole GITT pulse exhibits the t time dependence, i.e. the diffusion coefficient. Such a full fit (FF) of the pulse has been
E (t ) = E1 + (E2 - E1 ) t tP , Eq. 10 can be simplified to the proposed in Ref. 36 and is referred to as procedure P5 in the
common formula for spherical particles39–41 following. The parameters of our fit procedure are the diffusion
coefficient and the instantaneous IR drop. In case of a gradual initial
4 ⎛ E4 - E 0 ⎞ rP2
2 potential increase, as seen in Fig. 2d, the deviation of the full fit from
D = ·⎜ ⎟ · [11] the data is very large (green line in Fig. 2d). Thus, it was necessary
9p ⎝ E 2 - E1 ⎠ tP to exclude this transition region (TR) from the fit. This was done by
using the duration of the TR determined by a 2L-fit as shown in
Fig. 2c. This improved full fit (red line in Fig. 2d) is referred to as
Calculation procedures.—For evaluating the effective chemical
procedure P6.
lithium diffusion coefficient from GITT data, different procedures
have been applied in the literature. In the following, we list the most
Results and Discussion
common methods. In the next section we compare the results obtained
by these methods. Relatively little effort is necessary to derive the Figure 3 depicts cross-sectional SEM images of the investigated
diffusion coefficient by using formula (11), referred to as procedure NCM523 electrode showing a porous composite of oxide phase,
P1 in the following. However, as can be seen in Figs. 1 and 2, the binder, and conducting additive. The enlarged view of the surface of
accurate determination of the potential value E1 is often difficult a secondary oxide particle reveals an aggregate of small primary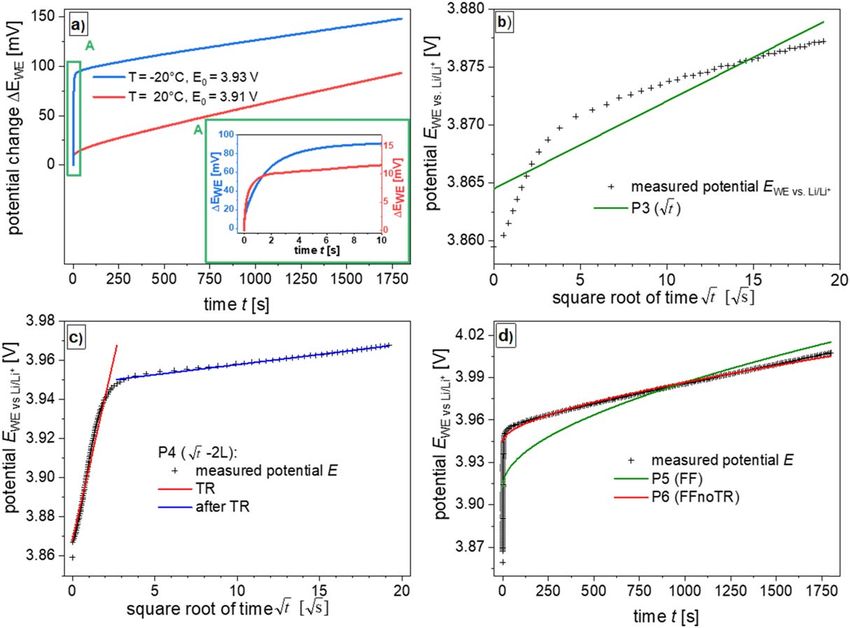
Journal of The Electrochemical Society, 2020 167 090546

Figure 2. Examples of measured GITT pulses, E (t ), at different temperatures and degrees of lithiation, x, of the cathode material NCM523, demonstrating
different calculation procedures for the effective chemical lithium diffusion coefficient. (a) The potential change initially shows a sharp kink at 20 °C and a
gradual increase at −20 °C. (b) Line fit of plot E (t ) vs t to determine dE d t according to procedure P3 (−20 °C). (c) 2-line fit to exclude the initial potential
transient (transition region (TR)) from the determination of dE d t (procedure P4, −20 °C). (d) Full fit of the pulse according to procedures P5 and P6,
respectively (−20 °C). In procedure P6, the fit is performed by omitting the initial potential transient determined by the 2-line fit in diagram (c).

Figure 3. SEM images of the investigated NCM523 electrode showing a porous composite of oxide phase, binder, and conducting additive. The enlarged view
of the surface of a secondary oxide particle shows an aggregate of small primary particles. The cross-sectional EDS mappings prove the presence of all expected
elements. Co, Mn, Ni, and O represent the NCM523 active material. C and F mark the conductive additive and binder, respectively.
Journal of The Electrochemical Society, 2020 167 090546

                                                                                 The median particle size of the NCM523 particles was determined
                                                                                 this way to 4.6 μm. The shoulder at approximately 0.6 μm suggests a
                                                                                 bimodal particle size distribution, with however minor fractions of
                                                                                 small particles that hardly contribute to the capacity of the electrode.
                                                                                     A typical potential response during the GITT measurement of the
                                                                                 NCM523 based cathode is shown in Fig. 5. The profile of the
                                                                                 equilibrium potential (relaxed state) is in good agreement with
                                                                                 previous studies.30,38 The potential response of the individual pulses
                                                                                 obviously changes with the degree of lithiation, indicating changes
                                                                                 of the deintercalation kinetics and the corresponding overvoltage.
                                                                                     Such measurements were conducted at varying temperature in a
                                                                                 range of −40 °C to 40 °C and carefully analyzed. In the following,
                                                                                 we compare results for the effective chemical lithium diffusion
                                                                                 coefficient in NCM523 derived by using the different calculation
                                                                                 procedures outlined above. Figure 6 shows the corresponding values
                                                                                 for the diffusion coefficient as a function of the lithiation degree x in
                                                                                 LixNi0.5Co0.2M0.3O2 for selected temperatures ranging from 40 °C
                                                                                 down to −40 °C. The lithiation range covered by the GITT
                                                                                 measurements is narrowed with decreasing temperature. Due to
                                                                                 the higher overvoltage at low temperature, the predefined cutoff
                                                                                 potential is already reached at higher lithiation degree compared to
Figure 4. Particle size distributions of the composite and carbon black          measurements at higher temperatures. For the calculations, a mean
(conductive additive) determined by static light scattering. The particle size   oxide particle radius rP of 5 μm was used. The diffusion coefficients
distribution of NCM523 is obtained by a weighted subtraction of the data for     were determined by means of a MathWorks MATLAB program with
the composite and the pure carbon black.                                         GITT data like shown in Fig. 5 as input.
                                                                                     The potentials E1 and E3, used in procedures P1 and P2, were
                                                                                 taken from the GITT data 5 s after switching on and off the current.
                                                                                 In view of the small time delay of 5 s compared to the total pulse
                                                                                 length of 1800 s, we neglected a corresponding modification of the
                                                                                 pulse time tP in Eqs. 11 and 12. At 40 °C, the derived diffusion
                                                                                 coefficients differ only by a factor of 3 within degrees of lithiation
                                                                                 0.4 < x < 0.8. Procedures P1 and P2 yield comparatively small
                                                                                 values, and procedures P3 and P4 produce the highest diffusion
                                                                                 coefficients. The values from procedures P5 and P6 are almost
                                                                                 identical at 40 °C. With lowering the temperature, the differences
                                                                                 between the derived diffusion coefficients increase up to more than
                                                                                 one order of magnitude. The dependence of the diffusion coefficient
                                                                                 on the degree of lithiation, x, shows a similar tendency for all
                                                                                 procedures except procedure P6 at temperatures 10 °C and −20 °C.
                                                                                 A striking feature of the diagrams in Fig. 6 is the strong increase of
                                                                                 the diffusion coefficient derived by procedure P6 at high degree of
                                                                                 lithiation, which seems unphysical and will be discussed below in
                                                                                 the context of possible error sources at low temperature.
                                                                                     Figure 7 compares diffusion coefficients determined by proce-
                                                                                 dures P4 ( t -2-line-fit) and P6 (full fit excluding TR) at 40 °C, 0 °C
                                                                                 and −40 °C. Both procedures yield good fits (cf. Figs. 2c and 2d),
                                                                                 except for high degrees of lithiation (not shown). Compared to
Figure 5. Typical potential response obtained during a GITT measurement          literature data, the diffusion coefficients shown in Figs. 6 and 7 for
of an NCM523 cathode at a temperature of 30 °C with 0.1 C pulse current,
                                                                                 40 °C roughly agree with room temperature data in Refs. 38, 39, 41,
30 min pulse time, and a relaxation period of 4 h.
                                                                                 and are about one order of magnitude smaller than values in Refs.
                                                                                 42–44 and in Ref. 45 for NCM111. The diffusion coefficient varies
particles. The EDS mappings proves the presence of all expected                  with the degree of lithiation in a complex manner as has been found
elements. Particularly, Co, Mn, Ni, and O represent the active                   by many authors. The chemical diffusion coefficient of layered
material LiNi0.5Co0.2Mn0.3O2, whereas C and F mark the conductive                oxides not only depends on the degree of lithiation (e.g. vacancy
additive (carbon black) and binder (PVDF), respectively. Co, Mn,                 concentration) itself but also on phase transformations as well as
Ni, and O are homogenously distributed in the active material                    changes in the lattice parameters and electronic properties.46,47 Only
particles. Binder and conductive additive adhere to the surface of the           very few data are available for low temperatures: 3 × 10⁻¹⁵ to 4 ×
particles and partly fill the void space between them.                            10−15 m2 s−1 at 0 °C,41 2 × 10⁻¹⁴ m2 s−1 at −20 °C for battery
    Figure 4 shows the particle size distributions of the composite,             charging,43 and 2 × 10⁻¹⁵ to 4 × 10⁻¹⁵ m2 s−1 at −25 °C for
the conductive additive (carbon black) and the NCM523. It should                 NCM622.41 In agreement with recent literature,40,41 the temperature
be noted that the direct determination of the particle size distribution         dependence of the diffusion coefficient turns out to be small. Only at
of the NCM523 is not expedient. During the electrode processing                  −40 °C and lithiation degrees of x > 0.6, the diffusion coefficient is
(slurry preparation, coating and calendaring), the degree of agglom-             considerably smaller than for higher temperatures. An increase of
eration can change dramatically and particle cracking may occur. To              the effective chemical diffusion coefficient for lowering the tem-
get representative data of the particle size distribution of the                 perature from 0 °C to −20 °C was reported in Ref. 43 for battery
NCM523, the composite was detached from the current collector,                   charging. At all temperatures, the diffusion coefficient in Fig. 7
dispersed and analyzed by static light scattering. The particle size             increases with increasing lithiation degree for x > 0.8. Such a
distribution of the NCM523 was then determined by a weighted                     behavior has also been found in Refs. 44, 45. However, an opposite
subtraction of the data for the composite and the pure carbon black.             behavior was observed by other authors.30,38,42,48 We assume that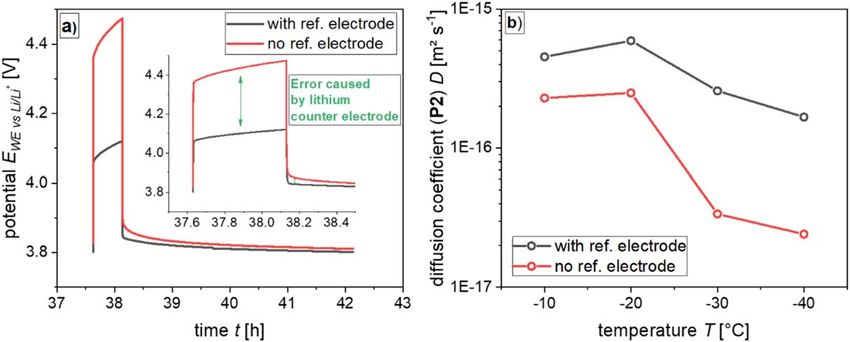
Journal of The Electrochemical Society, 2020 167 090546
Figure 6. Derived diffusion coefficients using different calculation procedures as a function of the lithiation degree x in LixNi0.5Co0.2M0.3O2 for selected
temperatures of (a) 40 °C, (b) 10 °C, (c) −20 °C and (d) −40 °C.
the very low temperature dependence of the diffusion coefficient diffusion analysis that complicate the determination of the diffusion
leads to the different lithiation degree and temperature tendencies coefficient with a focus on low temperatures.
reported in the literature. Presumably, measurement inaccuracies
with higher impact than the temperature dependence will dominate Impact of IR drop.—The diffusion coefficient can easily be
the resulting value of the diffusion coefficient. Moreover, the calculated by using procedure P1 (formula (11)). To this end,
deviations in the calculated diffusion coefficients in Figs. 6 and 7 however, the IR drop (i.e. potential E1 in Fig. 1) has to be determined
point to certain shortcomings of the calculation procedures, being a accurately. It is the sum of the voltage drops due to the ohmic (Ro)
further possible reason for the large scattering of reported diffusion and charge transfer (Rct) resistances. In some cases, mainly at higher
data. In the following, we discuss several aspects of a GITT temperature, the IR drop and the potential change related to changes
of the lithium concentration at the surface of the particles (diffusion
overvoltage) can be clearly distinguished. While the voltage drop
related to the ohmic resistance occurs immediately, the charging of
the electrochemical double layer depends on the characteristic time
constant tdl = Rct Cdl (Cdl—double layer capacity). With increasing
charge transfer resistance, the double layer charging starts to overlap
with the emerging diffusion overvoltage. For example, in Fig. 2a,
GITT pulses measured at 20 °C and −20 °C are compared. While at
20 °C a relatively sharp kink in the potential curve (potential E1) can
be seen, a long-lasting gradual increase is observed at −20 °C
(cf. inset in Fig. 2a), which impedes the application of formula (11).
To quantitatively analyze the initial potential transient, we
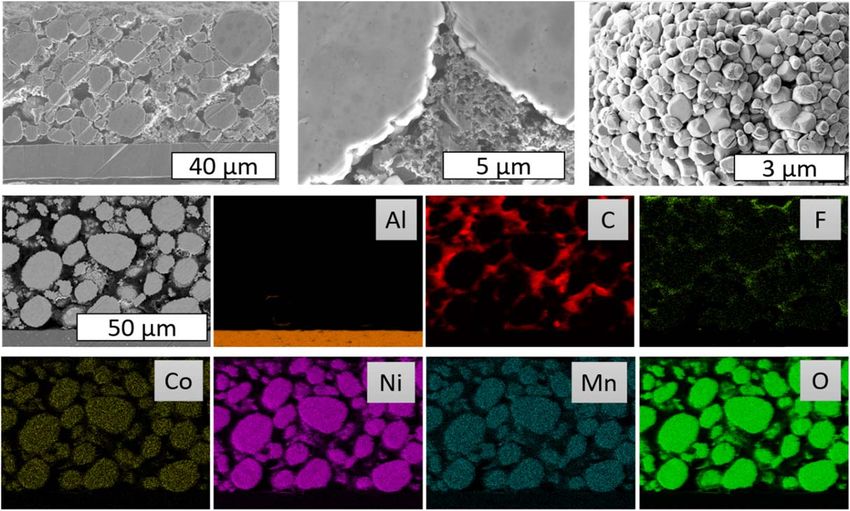
additionally applied EIS prior to each GITT pulse. Figure 8a shows
a typical impedance spectrum of the NCM523-based cathode. The
intercept at high frequency is attributed to the ohmic resistance of
the electrode and the electrolyte. The two semi-circles at medium
frequency are commonly assigned to contact resistance49,50 and the
cathode electrolyte interphase (CEI).51 The large semi-circle and the
straight line at medium to low frequency are related to the interfacial
charge transfer reaction and the lithium diffusion in the solid,
respectively. Fitting the impedance data to an appropriate electrical
Figure 7. Comparison of diffusion coefficients as a function of the lithiation equivalent circuit allows determining the resistances and time
degree at different temperatures derived by calculation procedures P4 constants of the different polarization processes. Our analysis
( t -2L) and P6 (FFnoTR). revealed that the charge transfer resistance is much larger than the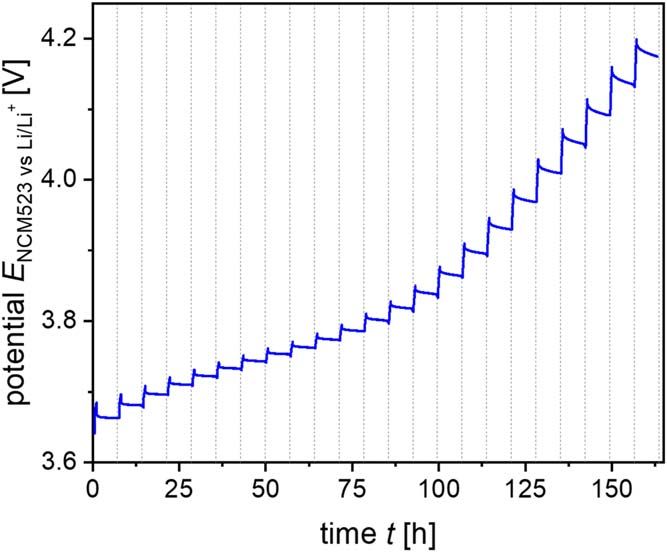
Journal of The Electrochemical Society, 2020 167 090546

Figure 8. (a) Typical impedance spectrum of an NCM523 cathode and electrical equivalent circuit representing the processes in the electrode. (b) Charge
transfer resistance, (c) time constant of double layer charging, and (d) IR drop, determined by fitting the impedance spectra, as a function of the lithiation degree,
x, at different temperatures.

other resistance contributions. It exhibits strong dependencies with                    The comparison between the results obtained for the procedures
respect to temperature and degree of lithiation (Fig. 8b), which                     P2, P4, and P6 indeed shows significant differences at low
causes an analogous behavior of the double layer charging time                       temperature (cf. Fig. 9). While results for P4 are slightly higher
(Fig. 8c). For temperatures above 0 °C and medium lithiation degree,                 than for P2 and show similar dependence on the lithiation degree, P6
the time constant tdl is smaller than 1 s. With decreasing temperature               gives diffusion coefficients up to two orders of magnitude higher at
and increasing lithiation degree, tdl increases dramatically. For
example, in the case of x > 0.9 and T < −10 °C, the time constant
is in the range of 30 to 100 s. Besides proving this overlap of double
layer charging and diffusion in the oxide particles, the derived time
constant can be used to define an appropriate IR drop and
corresponding potential values E1 or E3 in formula (11) and (12),
respectively. Figure 8d shows corresponding IR drops, defined by
E (tdl ) - E0, as a function of the lithiation degree at different
temperatures.
    Actually, the charging of the double layer is completed to 63, 86,
and 95% after a time of 1tdl, 2tdl, and 3tdl, respectively.
Correspondingly, the potential E1 can be defined as E (2tdl ) or
E (3tdl ). Analogously, for discharging the double layer at the end of
the GITT pulse, potential values E3 can be defined as E (tp + 2tdl ) or
E (tp + 3tdl ). Diffusion coefficients calculated according to proce-
dure P2 (formula (12)) with different values E3 = E (tP + Dt ) are
compared in Fig. 9 for T = −20 °C. The diffusion coefficients show
almost similar dependencies on the degree of lithiation, but differ in
their absolute values. Thus, the choice of the transient time affects
the magnitude of the effective chemical diffusion coefficient                         Figure 9. Diffusion coefficient and time constant of double layer charging
obtained from GITT analysis using procedures P1 and P2. In this                      as a function of the lithiation degree determined from GITT measurements at
regard, the application of the procedures P4 and P6 is expected to be                −20 °C according to procedure P2 (formula (12)) with different choices of
more reliable, since they do not require determination of the IR drop.               the potential E3 = E (tP + Dt ) with Dt = 1 s, 10 s, tdl, and 3tdl.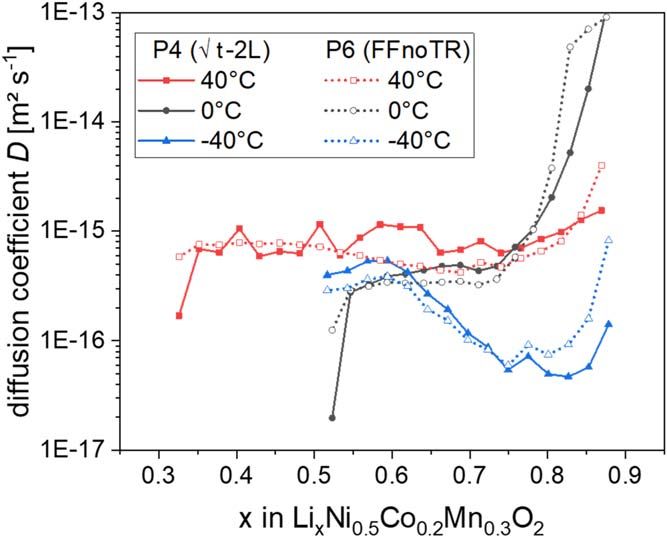
Journal of The Electrochemical Society, 2020 167 090546

   Table I. Specific surface areas derived by different methods as discussed in the text.

                                  Primary particles                             BET NCM523             Particle size               Secondary
                                   rP1 = 0.25 μm            BET electrode         powder               distribution          particles rP2 = 5 μm

   Surface area [m2 g−1]                2.61                     1.62                0.66                  0.20                      0.13

high x. We conjecture that this behavior is related to strong changes         (i) Cross-sectional SEM images of the electrode (cf. Fig. 3) show
of the charge transfer resistance and the corresponding voltage drop              a porous microstructure consisting of sphere-like secondary
during the pulse time, which is neglected in conventional GITT                    oxide particles of about 5 to 30 μm in diameter. The secondary
analysis. Figure 8b shows that Rct changes by orders of magnitude at              particles are aggregates of primary particles with diameters of a
high degree of lithiation. At high temperature, the voltage drop                  few 100 nm. Depending on the degree of sintering, the
related to Rct is small and changes of Rct hardly affect the potential            electrolyte might penetrate the grainy structure to some extent,
response. In contrast, at low temperature Rct becomes very large and,             which is however hardly measurable. The roughness of the
therefore, the change of Rct in the course of one pulse leads to a                secondary particles leads to an enlargement of the surface area
change of the associated voltage drop, which significantly contri-                 compared to a smooth surface. Corresponding calculations
butes to the potential response during the pulse time. Particularly, in           have been performed in Ref. 38. Parts of the oxide surface are
the present case of lithium extraction at high lithiation degree, Rct is          covered by binder and conductive additive. Thus, the geometric
initially high and decreases during the pulse time. Consequently, the             oxide surface is larger than the electrochemically active oxide
potential curve is flattened, leading to an overestimation of the                  surface.26 Despite this fact, the active oxide surface is usually
diffusion coefficient. By comparison, for medium lithiation degrees,               approximated by the geometric one. In case of a narrow
this effect is negligible. Although the charge transfer resistance                distribution of the oxide particle sizes, a representative particle
significantly contributes to the overvoltage in this case, its change              radius rP is chosen and the surface area is estimated by
during the pulse time is small due to a much lower dependence on                  Aacm = (3eacm rP ) Vtot (cf. derivation of formula 10). With
the degree of lithiation (cf. Fig. 8b). We conjecture that this effect            this expression for Aacm, we find D µ rP2. This strong depen-
significantly influences the calculation of the diffusion coefficient                dence implicates that the diffusion coefficient calculated with a
from the GITT data at low temperature. Procedure P6 is particularly               particle radius of e.g. 5 μm (secondary particles) is 400 times
sensitive to changes of Rct because it uses data points up to the end             larger than for a radius of 0.25 μm (primary particles).
of one pulse of 1800 s. For procedure P4, the impact of the varying          (ii) BET measurements capture the entire inner surface of the
charge transfer resistance is less because it uses datapoints only up to          electrode, including very small pores, binder and conductive
360 s after the TR. For very low temperatures of −40 °C this effect               additives, whose impacts on Aacm are not clear. The binder
might be overcompensated by increasing diffusion inhibitions in the               contributes to the BET surface but covers parts of the active
solid. In summary, we think that the diffusion coefficients deter-                 material, preventing direct contact with the electrolyte. The
mined at high lithiation degree (x > 0.8) cannot be considered                    conductive additive exhibits a very large specific surface area,
reliable due to the strong change of the charge transfer resistance               thus influencing the BET surface significantly, but does not
with the degree of lithiation (Fig. 8b). The proper consideration of              contribute to Aacm. Furthermore, it is not clear whether the very
this resistance change in the determination of diffusion coefficients              fine pores are wetted by the electrolyte. The specific BET
by GITT becomes a crucial problem at low temperature and high                     surface of the pristine active material powder is lower than for
lithiation degree. This is however beyond the scope of the present                the electrode (composite) as shown in Table I. Since Aacm
work.                                                                             cannot be larger than the BET surface of active material, the
    It should be noted that both, the impedance and the GITT                      BET surface of the electrode is an overestimation, most likely
analysis are carried out at relatively low currents to comply with the            caused by the large specific surface of the conductive additive.
assumptions used for the mathematical evaluation in the best                      Thus, BET measurements of the electrode are not appropriate
possible way. At higher currents, lithium diffusion in the                        to determine Aacm. The BET surface of the active material,
electrolyte,52 the electronic resistance of the composite53 and                   representing an upper limit of Aacm, lies in between the surfaces
interparticle mechanisms54 become significant for the lithium inter-               determined above for uniformly distributed secondary and
calation, voltage characteristics and attained capacity.55 For the low            primary particles.
currents typically applied for GITT, we verified by impedance                (iii) In the case of a wide particle size distribution, the respective
analysis that the charge transfer resistance (or activation over-                 specific surface area deviates from values obtained from the
potential) clearly dominates the lithium intercalation at low tem-                average particle size. To estimate such impacts, we further
perature. As a consequence, the double layer charging and diffusion               analyzed the particle size distribution of the active material
polarization can considerably overlap for high values of the charge               shown in Fig. 4. The median particle radius of 4.6 μm and the
transfer resistance, mainly found at low temperature and high                     corresponding specific surface area are in good accordance to
lithiation degree. In those cases, the approximate estimation of the              the results of the SEM analysis. The specific surface area
diffusion coefficient by means of formula (11) or (12) can be                      determined by integrating over the entire distribution is
improved by determining appropriate potential values E1 and E3,                   determined to 0.2 m2 g−1, being slightly larger than based on
respectively, based on the knowledge of the time constant of double               the average particle size, which is due to asymmetric distribu-
layer charging. It is however recommended to apply the somewhat                   tion (cf. Table I).
more elaborate procedures P4 or P6, including the knowledge of the
double layer charging time derived by an impedance analysis.                    In view of the different values stated in Table I, the question
                                                                            arises which surface area is suited to determine the diffusion
    Electrochemically active surface area of cathode material.—             coefficient. Since the BET surface area of the active material is
Computation of effective chemical diffusion coefficients from GITT           considerably smaller than the value obtained for the primary
data requires the knowledge of the electrochemically active surface         particles, we conclude that the degree of sintering is comparably
area Aacm of the cathode material (cf. formula (9)). The estimation of      high. This means that the secondary particles are very dense and the
Aacm is usually based on (i) SEM analysis of the microstructure,            electrolyte does not wet the primary particles. The BET surface of
(ii) BET measurements, or (iii) determination of the particle size          the pure active material represents the upper limit for the electro-
distribution by static light scattering.                                    chemically active surface area. Parts of this surface are however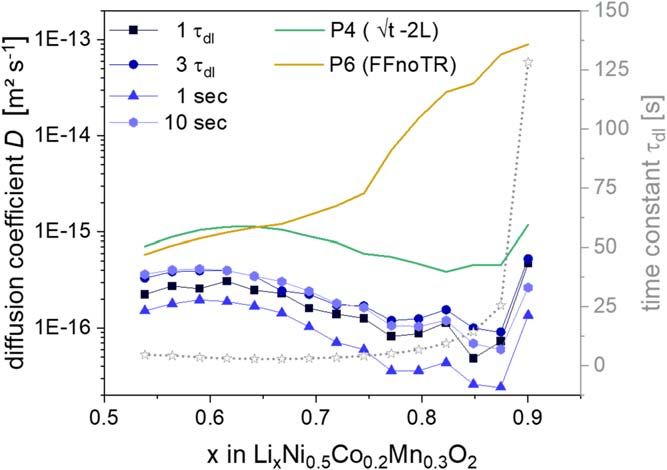
Journal of The Electrochemical Society, 2020 167 090546
Figure 10. (a) GITT measurements performed at 3.8V (xLi in LixNi0.5Co0.2Mn0.2O2 = 0.77) and −40 °C using 2- and 3-electrode configurations. (b) Effective
chemical diffusion coefficients derived with procedure P2 (Eq. 12) from data measured with 2- and 3-electrode configurations at different temperatures.
covered by binder and conductive additives. Considering the results to the fact that the Li deposition at the counter electrode strongly
obtained by the different methods (Table I) and the corresponding slows down at lower temperatures, giving rise to a significant
measurement efforts, the average size of the secondary particles overvoltage, which adds to the potential measured during GITT.
determined by SEM appears to be most reasonable for estimating the This problem can be eliminated by using a reference electrode in a
electrochemically active surface area. 3-electrode arrangement. Figure 10a shows potential responses
Actually, for modelling and simulation of the battery behavior, obtained for GITT measurements at −40 °C in 2- and 3-electrode
we are interested in the effective lithium diffusion in the secondary arrangement. Obviously, the Li metal counter electrode significantly
particles, since in common LIB models the geometry of the particles affects the electrochemical behavior of the cell and cannot be
is usually simplified by spheres of equal size. The lithium ion neglected in the GITT analysis. Figure 10b depicts diffusion
transport in the secondary particles is rather complex consisting of coefficients derived with Eq. 12 in 2- and 3-electrode configuration
grain boundary and volume diffusion.56 It may further be affected by for different temperatures. With lowering the temperature, the
lithium transport through the thin solid-electrolyte interphase film difference between the corresponding diffusion coefficients in-
formed by decomposition of the electrolyte during the initial cycles. creases, due to the increasing impact of the Li metal counter
These processes can roughly be described by an effective chemical electrode. The contribution to the GITT response caused by the
diffusion coefficient. To determine the diffusion coefficient by overvoltage at the Li metal counter electrode could be misinterpreted
procedures P1 to P4, the requirement t rP2 D has to be fulfilled. as higher diffusion overvoltage at the cathode. This would result in
With a typical value D = 10-15 m2 s−1 and a radius of the an underestimation of the diffusion coefficient, particularly at low
secondary particles rP2 = 5 μm, this leads to t 25000 s. More temperatures. Generally, the usage of 2-electrode cells should be
precisely, by comparing with the exact solution of the spherical avoided when analyzing GITT data in the case of considerable
diffusion problem Eq. 3, we find that for D = 10-15 m2 s−1 and charge transfer resistance at the counter electrode.
rP2 = 5 μm the t time behavior is valid with 5% accuracy only
for t < 80 s. Thus, the determination of the slope dE d t should be Appropriate choice of GITT parameters.—The above methods
restricted to a suited initial time interval of the GITT pulse. for determining the effective chemical diffusion coefficient are based
Alternatively, according to calculation procedures P5 and P6, one on certain suppositions. To enable the application of the single
can fit the whole pulse to the spherical solution. We emphasize that particle model, the electric potential and the lithium concentration in
in order to describe the effective diffusion in the secondary particles, the electrolyte should be almost uniform. These quantities are
the calculated diffusion coefficients in Figs. 6 and 7 were referred to essentially affected by the thickness, porosity, and phase composi-
the geometric surface of the secondary particles with radius of 5 μm tion of the electrode.57 Thick electrodes with low porosity increase
corresponding to the peak of the particle size distribution shown in the nonuniformity of the lithium ion concentration. Low amount of
Fig. 4. conductive additive increases the potential gradient. Thus, thin
In summary, exact knowledge of the microstructure of the active electrodes with high porosity and excess of conductive additives
cathode material is indispensable for choosing the proper electro- would be advantageous for an efficient GITT analysis.
chemically active surface area in the calculation of the effective A high uniformity of potential and lithium concentration is
chemical diffusion coefficient. When comparing diffusion data achieved for sufficiently small pulse current. The relaxation period
reported in the literature, one has to pay attention to which surface between the pulses should be long enough to nearly reach equili-
area the diffusion coefficient has been referred. Sometimes the brium. On one hand, the pulse duration should be preferably small so
nominal area of the planar electrode is chosen, which leads to that quantities depending on the lithiation degree, as e.g. the charge
comparatively large diffusion coefficients.26 transfer overvoltage hCT and the slope dE dx change only slightly
during the pulse. On the other hand, in order to obtain an estimate of
Impact of electrochemical cell setup on GITT data.—The the effective chemical diffusion coefficient of lithium within the
majority of investigations reported in the literature are performed secondary particles, the characteristic diffusion penetration length
using 2-electrode coin cells. Therein, the electrode of interest is D tP has to be large enough to probe a sufficiently large volume of
combined with a metallic Li foil, serving as the counter electrode, the secondary particles. Thus, the penetration depth should be
and a porous separator. While these cells are easily prepared and considerably larger than the radius of the primary particles.
yield accurate and reproducible results for long term cycling tests, Considering a diffusion coefficient of D = 10-15 m2 s−1 and a
their applicability for the analysis of the lithium intercalation primary particle radius rP1 = 0.25 μm, the requirement of e.g.
processes in cathode materials is rather limited. This is mainly due D tP > 8 rP1 leads to tP > 4000 s, and for D = 10-16 m2 s−1 atJournal of The Electrochemical Society, 2020 167 090546
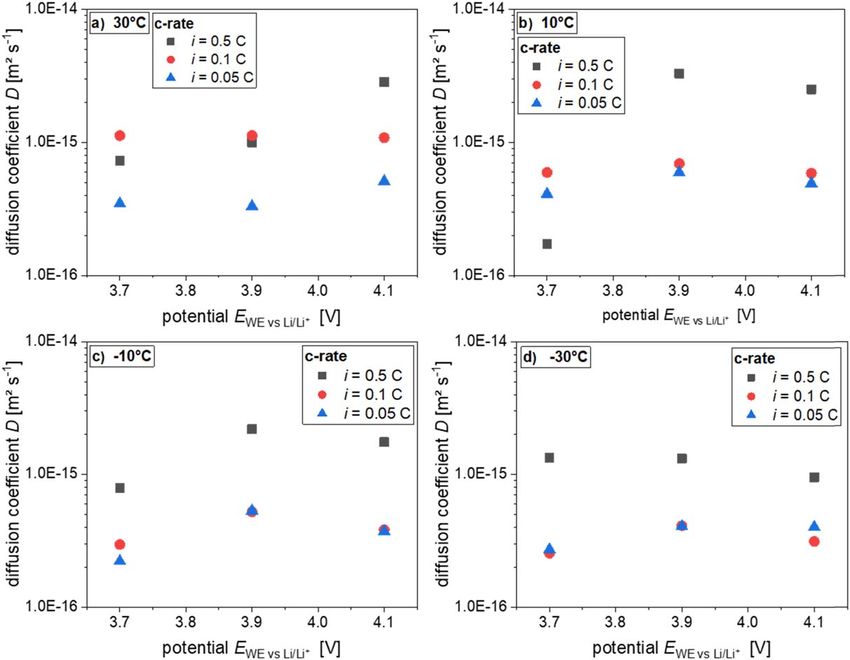
Figure 11. Effective chemical diffusion coefficients calculated with Eq. 12 (P2) as a function of the equilibrium potential for different C-rates and temperatures
of (a) 30 °C, (b) 10 °C, (c) −10 °C and (d) −30 °C.
very low temperature, one obtains tP > 40000 s. This result reveals a the strongly increasing charge transfer resistance. This leads to a
peculiar difficulty in determining a relevant effective chemical gradual initial increase of the potential of a GITT pulse due to a
diffusion coefficient at low temperature, which describes the comparatively slow charging of the electrochemical double layer. In
effective diffusion coefficient in secondary oxide particles. those cases, calculation procedures P1 and P2, which are based on the
To investigate the impact of the applied current on the attained knowledge of the IR drop, are hard to apply. Instead, we expect
diffusion coefficient, we varied the C-rate from 0.05 to 0.5. By procedures P4 and P6 to be more reliable, since the initial potential
adapting the pulse duration, we ensured that the transferred electric increase is excluded from the diffusion analysis. In this respect, it is of
charge per pulse remained constant. With increasing current, the great advantage to perform additional41 electrochemical impedance
lithium concentration at the surface of the particles varies stronger spectroscopy to determine the duration of double layer charging with
during one pulse, especially for small diffusion coefficient at low high accuracy. The knowledge of this charging time enables a more
temperature. Disregarding slight deviations due to measurement accurate determination of the IR drop for procedures P1 and P2
errors, the diffusion coefficients obtained for different sufficiently (provided they are applicable), as well as for choosing the appropriate
small currents should be roughly equal at the respective degree of time region of the GITT data for procedures P4 and P6. At very low
lithiation. For a verification, we compared the corresponding diffusion temperature and high lithiation degree, the double layer charging time
coefficients in Fig. 11. At 30 °C, the applied current practically has no can become so large that a noticeable amount of lithium diffuses out of
clear impact on the determination of the diffusion coefficient (or into) the oxide particles already during this time. The corre-
(Fig. 11a). At lower temperatures, the diffusion coefficients deter- sponding lithium diffusion flux increases gradually with time, which
mined at the C-rate of 0.5 C tend to be larger than determined at lower violates the boundary condition (2) of the diffusion problem of
C-Rates (Figs. 11b–11d), while the values for 0.1 and 0.05 C-rate are common GITT models. A proper consideration of the double layer
in remarkable agreement. Thus, we conclude that a C-rate of 0.1 C, charging in the GITT analysis is however beyond the scope of the
which was used in our above analysis, is suitably small to avoid an present work. This also concerns the consideration of a strongly
adulterant effect by using too large pulse current. varying charge transfer resistance during a GITT pulse at high
lithiation, which particularly affects the application of procedure P6.
A further challenge in estimating the diffusion coefficient is the
Conclusions
appropriate determination of the electrochemically active oxide
In the present study, we compared different calculation procedures surface, which requires exact knowledge of the cathode microstruc-
commonly applied for determining the effective chemical lithium ture. As outlined above, the choice of this surface is related to the
diffusion coefficient from GITT measurements. Diffusion coefficients meaning of the derived diffusion coefficient. In this work, we were
derived by the different procedures can vary by more than an order of interested to derive an effective (apparent) chemical diffusion
magnitude at low temperature. The determination of the diffusion coefficient, which effectively describes the complex lithium diffu-
coefficient at low temperature becomes more complicated because of sion in the secondary particles exhibiting a grainy structure. Thus,Journal of The Electrochemical Society, 2020 167 090546
we chose the geometric surface area of the secondary particles as a 17. D. P. Abraham, J. R. Heaton, S.-H. Kang, D. W. Dees, and A. N. Jansen,
reference. The diffusion data obtained in this way are the basis for J. Electrochem. Soc., 155, A41 (2008).
18. V. Ramadesigan, P. W. C. Northrop, S. De, S. Santhanagopalan, R. D. Braatz, and
simulations of the battery behavior at high C-rates within the V. R. Subramanian, J. Electrochem. Soc., 159, R31 (2012).
pseudo-2D model.32 To get a representative effective diffusion 19. S. Abada, G. Marlair, A. Lecocq, M. Petit, V. Sauvant-Moynot, and F. Huet,
coefficient, the GITT pulse duration has to be chosen sufficiently J. Power Sources, 306, 178 (2016).
large so that the diffusion penetration depth DtP into the secondary 20. T. Danner, M. Singh, S. Hein, J. Kaiser, H. Hahn, and A. Latz, J. Power Sources,
334, 191 (2016).
particles covers a representative volume. This volume should be 21. Y.-H. Chen, C.-W. Wang, X. Zhang, and A. M. Sastry, J. Power Sources, 195, 2851
large compared to the primary particle size. Our investigations also (2010).
demonstrate that the experimental conditions of the GITT measure- 22. M. Ecker, T. K. D. Tran, P. Dechent, S. Käbitz, A. Warnecke, and D. U. Sauer,
ment have significant impact on the attained diffusion coefficients. J. Electrochem. Soc., 162, A1836 (2015).
23. A. Hess, Q. Roode-Gutzmer, C. Heubner, M. Schneider, A. Michaelis, M. Bobeth,
We recommend to carry out measurements in 3-electrode arrange- and G. Cuniberti, J. Power Sources, 299, 156 (2015).
ment to avoid an influence by the Li metal counter electrode. The use 24. W. Weppner and R. A. Huggins, J. Electrochem. Soc., 124, 1569 (1977).
of thin electrodes with large porosity and an excess of conductive 25. C. J. Wen, B. A. Boukamp, R. A. Huggins, and W. Weppner, J. Electrochem. Soc.,
additive minimizes additional transport limitations in the electrode, 126, 2258 (1979).
26. X. Yang and A. L. Rogach, Adv. Energy Mater., 9, 1900747 (2019).
which otherwise lead to nonuniformity in the electric potential and 27. Y. Zhu, T. Gao, X. Fan, F. Han, and C. Wang, Acc. Chem. Res., 50, 1022 (2017).
lithium concentration in the electrolyte across the electrode. Varying 28. I. O. Santos-Mendoza, J. Vázquez-Arenas, I. González, G. Ramos-Sánchez, and
the galvanostatic current allows to check whether it is small enough C. O. Castillo-Araiza, Int. J. Chem. Reactor Eng., 17, 29 (2018).
to have negligible effect on the derived diffusion coefficient. Finally, 29. Y. Xi, Y. Liu, D. Zhang, S. Jin, R. Zhang, and M. Jin, Solid State Ionics, 327, 27
(2018).
we note that the large scattering of diffusion coefficients reported in 30. S. Yang, X. Wang, X. Yang, Y. Bai, Z. Liu, H. Shu, and Q. Wei, Electrochim. Acta,
the literature for similar materials might be related to the above 66, 88 (2012).
discussed problems in determining the diffusion coefficient. In 31. C. Hong, Q. Leng, J. Zhu, S. Zheng, H. He, Y. Li, L. Rui, J. Wan, and Y. Yang,
comparing reported values, one should pay particular attention to J. Mater. Chem. A, 88540 (2020).
32. M. Doyle, T. F. Fuller, and J. Newman, J. Electrochem. Soc., 140, 1526 (1993).
the choice of the electrochemically active surface area and the used 33. S. Santhanagopalan, Q. Guo, P. Ramadass, and R. E. White, J. Power Sources, 156,
calculation procedure. 620 (2006).
34. M. Guo, G. Sikha, and R. E. White, J. Electrochem. Soc., 158, A122 (2011).
35. J. Crank, The Mathematics of Diffusion (Oxford University Press, Oxford) (1979).
Acknowledgments 36. C. Delacourt, M. Ati, and J. M. Tarascon, J. Electrochem. Soc., 158, A741 (2011).
37. F. Röder, S. Sonntag, D. Schröder, and U. Krewer, Energy Technol., 4, 1588
This work was funded by the European Union and the Free State (2016).
of Saxony through the TTkin project (grant no. 100225300 and 38. A. Verma, K. Smith, S. Santhanagopalan, D. Abraham, K. P. Yao, and
100259273). We acknowledge the Center for Information Services P. P. Mukherjee, J. Electrochem. Soc., 164, A3380 (2017).
and High Performance Computing (ZIH) at TU Dresden for 39. Z. Shen, L. Cao, C. D. Rahn, and C.-Y. Wang, J. Electrochem. Soc., 160, A1842
(2013).
computational resources. 40. Y. Wei et al., JACS, 137, 8364 (2015).
41. S. Cui et al., Adv. Energy Mater., 6 (2016).
ORCID 42. Y. Bai, X. Wang, X. Zhang, H. Shu, X. Yang, B. Hu, Q. Wei, H. Wu, and Y. Song,
Electrochim. Acta, 109, 355 (2013).
A. Nickol https://orcid.org/0000-0002-3696-1642 43. J. Schmalstieg, C. Rahe, M. Ecker, and D. U. Sauer, J. Electrochem. Soc., 165,
A3799 (2018).
References 44. R. Amin and Y.-M. Chiang, J. Electrochem. Soc., 163, A1512 (2016).
45. K. M. Shaju, G. V. Subba Rao, and B. V. R. Chowdari, J. Electrochem. Soc., 151,
1. B. Scrosati and J. Garche, J. Power Sources, 195, 2419 (2010). A1324 (2004).
2. Y. Miao, P. Hynan, A. von Jouanne, and A. Yokochi, Energies, 12, 1074 (2019). 46. A. van der Ven, J. Bhattacharya, and A. A. Belak, Acc. Chem. Res., 46, 1216
3. X.-Q. Zhang, C.-Z. Zhao, J.-Q. Huang, and Q. Zhang, Engineering, 4, 831 (2018). (2013).
4. G. Zubi, R. Dufo-López, M. Carvalho, and G. Pasaoglu, Renew. Sustain. Energy 47. Y. Zhu and C. Wang, J. Phys. Chem. C, 114, 2830 (2010).
Rev., 89, 292 (2018). 48. W. Lee, S. Muhammad, T. Kim, H. Kim, E. Lee, M. Jeong, S. Son, J.-H. Ryou, and
5. J. Jaguemont, L. Boulon, and Y. Dubé, Appl. Energy, 164, 99 (2016). W.-S. Yoon, Adv. Energy Mater., 8, 1701788 (2018).
6. G. Zhu et al., J. Power Sources, 300, 29 (2015). 49. M. Gaberscek, J. Moskon, B. Erjavec, R. Dominko, and J. Jamnik, Electrochem.
7. M. Ouyang, Z. Chu, L. Languang, and J. Li et al., J. Power Sources, 286, 309 Solid-State Lett., 11, A170 (2008).
(2015). 50. J. P. Schmidt, T. Chrobak, M. Ender, J. Illig, D. Klotz, and E. Ivers-Tiffée, J. Power
8. T. Waldmann, M. Wilka, M. Kasper, M. Fleischhammer, and M. Wohlfahrt- Sources, 196, 5342 (2011).
Mehrens, J. Power Sources, 262, 129 (2014). 51. X. Zuo, C. Fan, X. Xiao, J. Liu, and J. Nan, J. Power Sources, 219, 94 (2012).
9. M. Fleischhammer, T. Waldmann, G. Bisle, B.-I. Hogg, and M. Wohlfahrt- 52. C. Heubner, M. Schneider, and A. Michaelis, Adv. Energy Mater., 195, 1902523
Mehrens, J. Power Sources, 274, 432 (2015). (2019).
10. A. Friesen, S. Hildebrand, F. Horsthemke, M. Börner, R. Klöpsch, P. Niehoff, 53. R. Tian, N. Alcala, S. J. K. O’Neill, D. V. Horvath, J. Coelho, A. J. Griffin,
F. M. Schappacher, and M. Winter, J. Power Sources , 363, 70 (2017). Y. Zhang, V. Nicolosi, C. O’Dwyer, and J. N. Coleman, ACS Appl. Energy Mater.,
11. A. Tomaszewska et al., eTransportation, 1, 100011 (2019). 3, 2966 (2020).
12. S. Ma, M. Jiang, P. Tao, C. Song, J. Wu, J. Wang, T. Deng, and W. Shang, Progress 54. H. Kikukawa, K. Honkura, and M. Koyama, Electrochimica Acta, 278, 385 (2018).
in Natural Science: Materials International, 28, 653 (2018). 55. R. Tian, S.-H. Park, P. J. King, G. Cunningham, J. Coelho, V. Nicolosi, and
13. S. S. Zhang, K. Xu, and T. R. Jow, Electrochem. Commun., 4, 928 (2002). J. N. Coleman, Nat. Commun., 10, 1933 (2019).
14. S. S. Zhang, K. Xu, and T. R. Jow, J. Power Sources, 115, 137 (2003). 56. M. Park, X. Zhang, M. Chung, G. B. Less, and A. M. Sastry, J. Power Sources, 195,
15. S. S. Zhang, K. Xu, and T. R. Jow, Electrochim. Acta, 48, 241 (2002). 7904 (2010).
16. X.-Z. Liao, Z.-F. Ma, Q. Gong, Y.-S. He, L. Pei, and L.-J. Zeng, Electrochem. 57. C. Heubner, A. Nickol, J. Seeba, S. Reuber, N. Junker, M. Wolter, M. Schneider,
Commun., 10, 691 (2008). and A. Michaelis, J. Power Sources, 419, 119 (2019).You can also read