Understanding Adverse Effects of Temperature Shifts on Li-Ion Batteries: An Operando Acoustic Study
←
→
Page content transcription
If your browser does not render page correctly, please read the page content below
Journal of The Electrochemical
Society

OPEN ACCESS

Understanding Adverse Effects of Temperature Shifts on Li-Ion
Batteries: An Operando Acoustic Study
To cite this article: Wesley Chang et al 2020 J. Electrochem. Soc. 167 090503

View the article online for updates and enhancements.

                               This content was downloaded from IP address 46.4.80.155 on 08/11/2020 at 23:55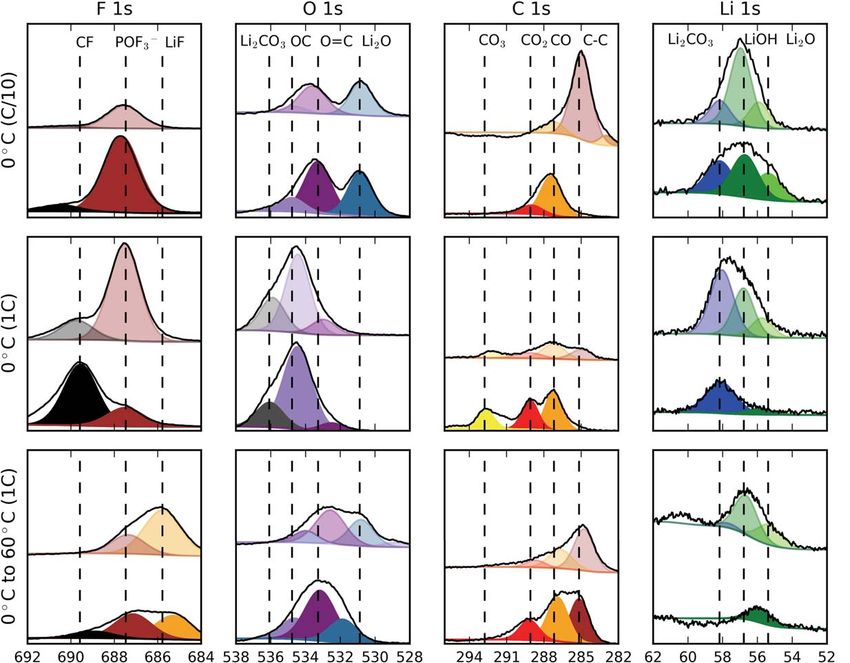
Journal of The Electrochemical Society, 2020 167 090503

                              Understanding Adverse Effects of Temperature Shifts on Li-Ion
                              Batteries: An Operando Acoustic Study
                              Wesley Chang,1,2,3,*,= Clement Bommier,1,2,3,= Thomas Fair,1,2 Justin Yeung,1,2
                              Shripad Patil,4,* and Daniel Steingart1,2,3,4,5,6,z
                              1
                                Department of Mechanical and Aerospace Engineering, Princeton University, Princeton, New Jersey 08540, United States
                              of America
                              2
                                Andlinger Center for Energy and the Environment, Princeton University, Princeton, New Jersey 08540, United States of
                              America
                              3
                                Columbia Electrochemical Energy Center, Columbia University, New York, New York 10027, United States of America
                              4
                                Department of Earth and Environmental Engineering, Columbia University, New York, New York 10027, United States of
                              America
                              5
                                Department of Chemical Engineering, Columbia University, New York, New York 10027, United States of America
                              6
                                Department of Chemical and Biological Engineering, Princeton University, Princeton, New Jersey 08540, United States of
                              America

               Studies related to battery performance and long-term health of commercial Li-ion batteries (LIBs) typically have a fixed
               temperature parameter. However, commercial LIBs are subject to temperature fluctuations due to their local environment and
               operating conditions, and these transient temperatures are well known to impact long-term stability. Herein, we demonstrate the
               adverse effects of temperature shifts, and show that transitioning from low temperature to higher temperature can lead to
               catastrophic failure within practical temperature ranges experienced by commercial LIBs. We show there exists an Arrhenius
               relationship between the rate of acoustic attenuation and the magnitude of the temperature shift. A combination of acoustic
               attenuation, which marks gassing occurrence during cycling, and post mortem chemical analyses provides further mechanistic
               insight into the Li-rich solid electrolyte interphase (SEI) formation at low temperatures and subsequent reactions with the
               electrolyte at higher temperatures. Further, several strategies to prevent or mitigate catastrophic failure are introduced. On a broader
               scale, this research further highlights the importance of temperature and current controls integration into battery management
               systems (BMS) for both safety and extension of cycle life as battery systems move toward fast charge (>3 C) capability.
               © 2020 The Author(s). Published on behalf of The Electrochemical Society by IOP Publishing Limited. This is an open access
               article distributed under the terms of the Creative Commons Attribution 4.0 License (CC BY, http://creativecommons.org/licenses/
               by/4.0/), which permits unrestricted reuse of the work in any medium, provided the original work is properly cited. [DOI: 10.1149/
               1945-7111/ab6c56]

               Manuscript submitted October 7, 2019; revised manuscript received November 27, 2019. Published February 6, 2020. This paper is
               part of the JES Focus Issue on Battery Safety, Reliability and Mitigation.
               Supplementary material for this article is available online

    Temperature contributions to aging mechanisms of commercial                       operando acoustic detection and material characterization techniques,
lithium-ion batteries (LIBs) are generally focused on the harmful                     we demonstrate that LiCoO2/graphite LIBs (LCO/Gr) experience
high temperature effects, such as electrolyte decomposition and                       catastrophic battery failure when moved from a 0 °C environment to
cathode dissolution at >60 °C, and deleterious low temperature                        a 60 °C environment during cycling. The temperature range of 0 °C
effects, arising from lithium plating on the anode surface during                     to 60 °C was chosen based on the manufacturer specification sheet
charging (generally below 10 °C).1–16 In parallel, researchers have                   for minimum and maximum operating temperatures (linked in
also explored temperature abuse and failure pathways of LIBs due to                   Experimental Methods section). By shifting the environmental tem-
thermal runaway, through means of overcharge and calorimetry.17–23                    perature between the minimum and maximum operating extremes and
    However, these studies seldom consider the effect of temperature                  at a control temperature of 20 °C, which is the baseline environment
shifts, and in the case of abuse and overcharge, operate well outside                 utilized for manufacturer performance testing, the catastrophic failure
manufacturer specifications, thus limiting insight into aging mechan-                  events that could possibly happen even within accepted ranges could
isms under standard operating conditions. LIBs are expected to cycle                  be investigated. Further, it is known that lithium plates readily on
in environments with changing temperatures, with greater tempera-                     graphite below 10 °C at typical 1C charge rates, and that LiPF6
ture margins in polar regions due to extreme seasonal variations.                     electrolyte decomposition beings to occur at 60 °C and higher.1,4,10,16
This is an important consideration to take into account for the                       For all these reasons, it made sense to select these two temperature
building of battery management systems (BMS) in outdoor environ-                      ranges for the temperature shift experiments.
ments, such as mobility applications (i.e. electric vehicles, electric                    From the experimental results, the catastrophic failure in the 0 °C
bikes) and grid-level storage; adaptability to temperature swings in                  to 60 °C temperature shift stems from a two-step process: lithium
the operating environment is critical. The same is true for batteries                 deposition at 0 °C, and subsequent electrolyte gassing reactions at
used in space and in remote sensing applications, where fluctuations                   high temperature (greater than 20 °C) which we determine to be
are even more extreme.                                                                catalyzed by the prior lithium deposition. This results in overall
    Recently, Dahn et al. demonstrated cell failure stemming from                     failure of the battery within ten cycles post-temperature-shift,
gassing effects during a cold to hot temperature transition.24 Volume                 showing how critical it is to manage current rate as a function of
analysis quantified the volume increase that occurs when lithium                       temperature, especially for battery applications which require
plating is observed during cycling at 10 °C in ethylene carbonate-free                operation in fluctuating temperatures. We further demonstrate that
electrolytes. This work aims to establish a mechanistic understanding                 heating the cycling environment to any temperature above 20 °C,
of temperature shift effects on gassing. Through a combination of                     after initial cycling in
Journal of The Electrochemical Society, 2020 167 090503
dramatically attenuated in the presence of a gaseous medium due to speed of sound Cs, with the speed of sound being a function of the
a high acoustic impedance mismatch. Finally, we explore several elastic modulus of the material, E, as well as the density ρ (Eq. 2).
possible strategies for preventing catastrophic failure from occurring
L L
due to the temperature shift. ToF = = [2]
Cs E r
Experimental Methods
According to acoustic theory, the transmission efficiency from
Li-ion pouch cell cycling.—Cells used for testing were Li-ion
transducer to air is much lower than that from transducer to liquid,
651628 (LCO/Gr) pouch cells, rated for 210 mAh, and obtained
due to a greater impedance mismatch ratio. Therefore, the loss or
from AA Portable Power Corp. (https://batteryspace.com/prod-
complete attenuation of the acoustic signal should be indicative of
specs/4252.pdf). Detailed chemical composition information is
gassing within the pathway between the transmitting and receiving
shown in Table I (from the company specification sheet).
transducers. Individual waveforms are collated via superposition
Cell properties in Table II were obtained by reverse-engineering
onto a heatmap to show their evolution over time. ToF shifts are
a fresh cell at 0% state-of-charge. There were 30 cathode (LCO)
determined using a full waveform cross-correlation function. More
layers and 32 anode (graphite) layers, with each electrode being
information on the technique, as well as more advanced analysis is
double-sided. The LCO electrodes were sonicated in NMP, and the
available in papers by Steingart et al.27–29 and Shearing et al.22 The
graphite electrodes were sonicated in DI water. The slurry was dried
acoustic signal was transmitted and received by a pair of 2.25 MHz
in the vacuum oven at 150 °C overnight in order to obtain the dried
transducers (SIUI) that were contacted across the cell, with the
powder. The weight of the powder was measured to obtain the
signal collected by an ultrasonic pulser-receiver (Epoch 600).
loading (mg cm−2) and density (g cm−3). Areal capacity was
Coupling of the acoustic signal to the cell was applied via an
obtained using the theoretical capacity of 274 mAh g−1 for LCO and
acoustic gel (Sonogel), and transducer pressure was maintained via
372 mAh g−1 for graphite. BET measurements (Micromeritics
springs in a custom 3D printed holder (Formlabs) (SI Fig. 1 is
ASAP 2020 HV) were taken for both the LCO and graphite in
available online at stacks.iop.org/JES/167/090503/mmedia).
order to obtain the BET surface area and micropore volume.
Cells were cycled on a Neware BTS3000 cycler, using constant
Materials characterization.—Scanning electron microscopy
current constant voltage (CCCV) on the charge step and constant
(SEM) was conducted using a Verios 460 XHR with a working
current (CC) on the discharge step. For the CCCV tests, the lower
distance of 4 mm and accelerating voltage of 5 keV. Samples were
current cutoff was always C/10. The voltage window used was
rinsed in dimethyl carbonate and dried in the vacuum antechamber of
between 2.7 V and 4.2 V, consistent with factory specified cut-off
the Argon filled glovebox at 40 °C for 2 h before imaging. Samples
voltages. Cycling was done in environments between 0 °C and 60 °C
were transferred to the imaging room in double sealed containers and
in temperature-controlled incubators. The nominal capacity was
were exposed to air for less than 5 s, using the load lock on the SEM
established by cycling batteries at a C/10 rate at CC.
for near-instant pump down. X-ray photoelectron spectroscopy
Galvanostatic intermittent titration (GITT) testing was conducted
(XPS) was conducted using a Thermo Scientific K-Alpha instrument
to compare relative diffusivity values during the electrochemical
with an Al Kα source and 400 μm spot size (0.05 eV step size for
cycling processes, in a process first described by Weppner et al.25 and
core-level scans, 1 eV for survey scans). The operating pressure was
shown to be functional for porous LIB electrodes by Dees et al.26
less than 1 × 10⁻⁷ Torr, and the samples were transferred via a
Diffusivity measurements were obtained through the use of Eq. 1.
vacuum sample holder and never exposed to atmosphere. Avantage
software was used for the least-squares fitting of XPS spectra with
4 ⎛ mB VM ⎞ ⎛ DEs ⎞ ⎛ L2 ⎞
2 2
D˜ = ⎜ ⎟ ⎜ ⎟ ⎜t ⎟ [1] Lorentzian-Gaussian line shape (30% L/G mix), and a Shirley
pt ⎝ MB S ⎠ ⎝ DEt ⎠ ⎝ D˜ ⎠ background subtraction. Depth profiling was carried out with an
Argon ion gun (2 keV, monatomic, 400 μm spot size) for a series of
For the full cells, a current pulse of C/10 with a transient current 7 etches of 180 s each (21 min total). Raman analysis was done with
time of 10 min and a resting period of 40 min was used. From the a Horiba Raman Spectrometer, using a 532 nm laser. A glass fiber
voltage stability observed in the voltage curves, 40 min was filter paper was used for greater electrolyte retention, before analysis.
determined to be an appropriate rest time to attain steady stage FTIR was conducted using a Nicolet iN10 MX Infrared Microscope.
following the 10 min C/10 pulse.
Results and Discussion
Acoustic monitoring.—Acoustic ultrasound is used as a tool to
measure the time-of-flight (ToF) of a waveform passing through a Temperature shift effects during cycling.—While battery man-
cell. The ToF can be obtained by the cell thickness L, divided by the ufacturers generally recommend LIB operation and storage at
temperatures between 20 °C and 30 °C, it is common for batteries
Table I. Chemical Composition. to be placed in environments which deviate from those guidelines.
Therefore, the aim of this work was to explore the effect of
Content temperature shifts between the absolute minimum and maximum
Chemical Name (wt%) CAS Index No manufacturer specified temperatures. For the case of the LIB chosen
for this study, the minimum and maximum temperature range was
Lithium cobalt oxide 50 12190-79-3 0 °C to 60 °C, with baseline performance testing completed at 20 °C.
Graphite 10 7782-42-5 The effect of shifting the battery between these temperature
Polypropylene 5 9003-07-0 environments on lifetime cycling was first investigated.
PVDF 2 24937-79-9 Six batteries were cycled with various permutations of a 5 °C/
Polyethylene 5 9002-88-4 20 °C/60 °C temperature profile, with 30 cycles at each temperature
Carboxymethylcellulose 0.5 9004-32-4 followed by a final 30 cycle step at 20 °C (Fig. 1a). Each cycle
Lithium hexafluoropho- 5 21324-40-3 consisted of a CCCV charge to 4.2 V cutoff, and a CC discharge to
sphate 2.7 V cutoff. While five of the permutations appear to perform
Ethylene carbonate 5 96-49-1 consistently, the low to high temperature transition (5 °C/60 °C/
Dimethylcarbonate 5 616-38-6 20 °C) was a condition that warranted further investigation. Not only
Nickel 2.5 7440-02-0 did it fail completely after cycling at 60 °C, but it showed physical
Copper 5 7440-50-8 signs of severe gassing (Fig. 1c). The gassing phenomenon is typical
Aluminum 5 7429-90-5 of overcharging or exposure to higher temperatures. However, none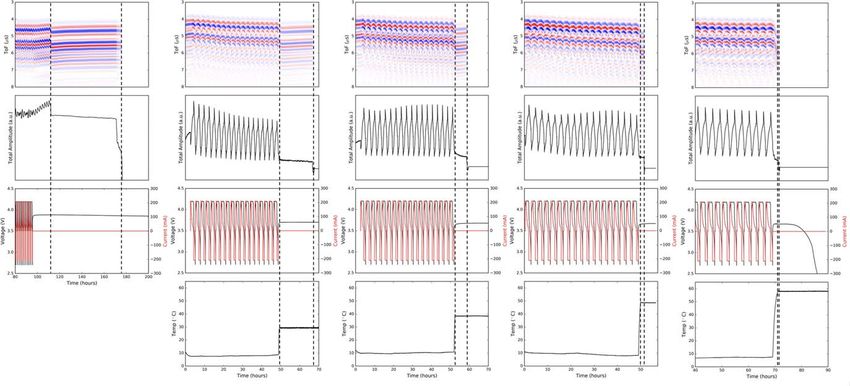
Journal of The Electrochemical Society, 2020 167 090503

   Table II. Cell Properties.

                   Electrode         # Layers                Thickness (um)                     Loading (mg cm−2)                             Density (g cm−3)

   LCO             Cathode           30                      58                                 8.9                                           1.54
   Graphite        Anode             32                      66                                 7.0                                           1.06
                   Capacity (mAh cm−2)                       BET Surface Area (m2 g−1)                                    BET Micropore Volume (cm3 g−1)

   LCO             2.44                                      2.45                                                         0.000753
   Graphite        2.60                                      3.18                                                         0.000214

of the cells were overcharged to greater than 4.2 V, and since the                   as well as substantial gas formation, presumably due to reactions
other cells were also exposed to higher temperature (yet none                        induced by the temperature shift. To further explore and understand
showed significant signs of gassing or cell failure), it was suspected                the dependence of gas formation on temperature gradients and the
that the low temperature to high temperature shift affected the                      root cause of the gassing occurrence, fresh 210 mAh pouch cells
electrochemical properties which led to cell failure.                                were initially cycled at cold (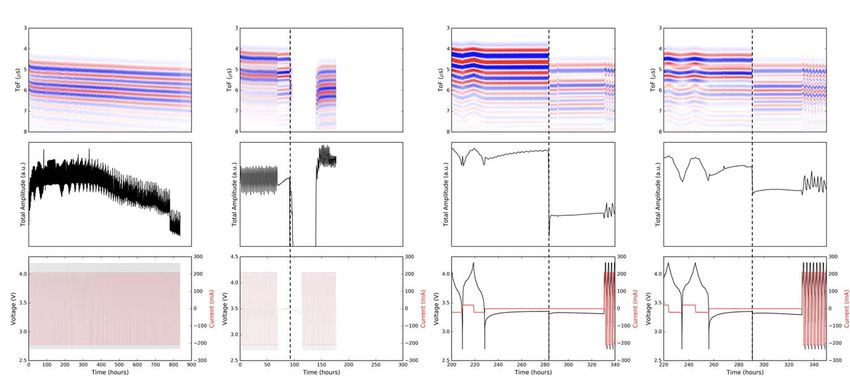
Journal of The Electrochemical Society, 2020 167 090503

Figure 2. Acoustic and electrochemical data of 210 mAh pouch cells initially cycled at cold (
Journal of The Electrochemical Society, 2020 167 090503

                                                                                        After observing these differences between the 20 °C and 60 °C
                                                                                    shifted cells, the acoustic effects of a 20 °C to 60 °C shift, and of a
                                                                                    constant 60 °C environment were tested (Figs. 4a–4b). The constant
                                                                                    60 °C cycled cell confirmed that a constant high temperature of
                                                                                    60 °C does not cause signal attenuation (Fig. 4a). Therefore, the shift
                                                                                    in temperature is vital to the gassing occurrence, rather than simply
                                                                                    cycling at the elevated temperature. The 20 °C to 60 °C shift also led
                                                                                    to signal loss, suggesting occurrence of gas formation (Fig. 4b).
                                                                                    However, unlike the
Journal of The Electrochemical Society, 2020 167 090503
CCCV commences, indicating that minimal damage or gassing a C-F bond degradation product of LiPF6. These are in addition to
occurs. This is in contrast to the cells that were cycled at a faster other peaks that are also observed in the anode cycled at C/10, such
rate of 1C at the low temperature before the similar transition to a as POF3- at 687.5 eV and LiOH at 533.2 eV.33–35 However, the
warmer temperature. At a slower C/10 rate, lithium plating is higher binding energy peaks observed in the cell cycled at 0 °C all
mitigated at the same cold temperature because of minimized mass disappear in the 0 °C to 60 °C transitioned cell. Particularly, the peaks
transport issues. During the subsequent higher temperature shift, fitted to C-F in the F 1s scan, and to Li2CO3 in the O 1s, C 1s, and Li
there is less plated lithium to react. Therefore, a slower C/10 rate at 1s scans no longer appear (Fig. 5c). Presumably, the transition to
the initial low temperature may be a method to prevent catastrophic 60 °C caused these higher binding energy species (C-F and Li2CO3)
failure upon shifting to a higher temperature environment. formed during cycling at cold temperatures to react with the
The sum of these acoustic results leads to a few conclusions. electrolyte and produce gaseous products such as CO2 and other
First, the attenuation of the signal in all the temperature transitions is organic compounds.35 These are possible components of the out-
accompanied by visible gassing, and happens under open circuit gassing observed in the cell that went through the 0 °C to 60 °C
voltage and at 0% SOC. This precludes SEI formation during transition, based on appearance and subsequent disappearance of
cycling as the reason for gassing, and also eliminates the effect of products formed on the SEI. Further studies utilizing gas chromato-
being at 100% SOC, which is known to lead to gassing effects. graphy mass spectroscopy (GC-MS) may help elucidate the exact
Second, the kinetics of the signal attenuation is highly dependent on composition of the aforementioned gasses.36,37 In the current study,
the temperature environment the battery is transitioned to. we have focused on operando acoustic detection of observed physical
As such, we can surmise that: (1) the acoustic signal attenuates changes, and correlation of these results with changes in the chemical
due to gas formation, (2) the gas formation is dependent on composition of the SEI and the degraded electrolyte.
temperature, and (3) the gas formation results from a reaction
enabled by a high rate/low temperature electrochemical event. Cells Analysis of electrolyte from full cells.—As both the acoustic and
placed in a 60 °C environment without cycling, or cycled at low surface chemical analyses suggest that electrolyte decomposition
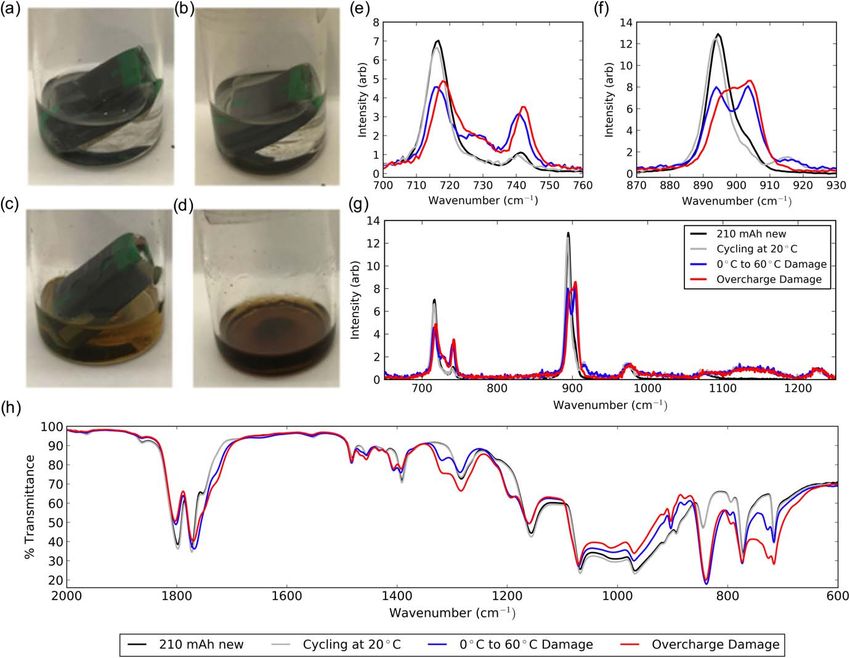
current rates with aJournal of The Electrochemical Society, 2020 167 090503 Figure 5. XPS spectra (F 1s, O 1s, C 1s, and Li 1s scans) of the graphite anode after (a) cycling at 0 °C, C/10 rate, at 100% SOC; (b) cycling at 0 °C, 1C rate, at 0% SOC; and (c) cycling at 0 °C followed by transition to 60 °C, 1C rate, and at 0% SOC. For each plot, the darker colored bottom spectrum indicates the initial surface scan, and the corresponding lighter colored top spectrum indicates the depth profile scan after 21 min of etching. Y-axis is intensity in counts per second (arbitrary units) and x-axis is binding energy in eV. Point scans were taken with 400 μm spot size and 0.05 eV step size, and depth profile was conducted with a 2 keV monatomic Ar-ion gun for a total of 7 etch cycles at 3 min each. aforementioned spectra, there are significantly attenuated peaks at The gas formation and electrolyte breakdown stemming from the 720 cm−1 and 900 cm−1, while the peak at 746 cm−1 shows a much low to high temperature shift suggest a parallel to the degradation greater prominence. Additionally, the peaks at 720 cm−1 and mechanisms that occur during battery overcharging: lithium metal 900 cm−1 are now convoluted into two separate peaks. For the deposits on the surface of the graphite anode and a significant increase 720 cm−1 peak, we can see the appearance of a shoulder peak close in impedance is observed. When repeating the same electrolyte to 730 cm−1, while the 900 cm−1 peak effectively separates into two extraction procedure with an overcharged cell, the electrolyte takes different peaks: one at 895 cm−1, and another closer to 905 cm−1. on a substantially darker color. This parallel between the temperature The shift to a higher wavenumber for both the 720 cm−1 and the shifted cell and the overcharged cell thus provides strong evidence of 900 cm−1 peaks is due to the presence of a Li+ ion coordinated with the mechanistic similarity between the two conditions. the EC molecule. As such, the EC-Li+ ring bending mode is closer The set of four electrolytes was also characterized with Fourier the 730 cm−1, while the EC-Li+ ring breathing mode is closer to Transform Infrared Spectroscopy (FTIR), as shown in Fig. 6h. The 905 cm−1. This indicates that the electrolyte solution from the 0 °C new electrolyte and the electrolyte cycled at 20 °C showed nearly to 60 °C transition case has either a much greater concentration of Li identical profiles, as we observed with their corresponding Raman than the other solutions, a reduced concentration of pristine EC spectra. This further confirms that under normal cycling conditions molecules, or a combination of both. We postulate that, at low and at normal temperatures, electrolyte does not degrade. However, temperatures, lithium was plated on the graphite anode while we do see a significant change in the FTIR spectra with the migrating from the cathode. Once brought to a higher temperature, overcharged and the 0 °C to 60 °C electrolyte. some of the surface plated lithium then reacted with EC in the Notably, the peak for the damaged electrolytes at 1800 cm−1 electrolyte, to progressively passivate the surface. The byproduct of decreases in adsorption intensity, while the neighboring peak at this reaction is soluble in EC, which is why the breakdown products 1750 cm−1 remains similar. The peaks in this region represent the were able to leach into the pristine electrolyte and increase the C=O stretching mode, and in the case of LiPF6 EC:DMC a lower ratio lithium concentration. This is also confirmed in the XPS spectra by of 1800 cm−1 to 1750 cm−1 peak intensity is sign of an increased Li the complete disappearance of the high binding energy species concentration in the electrolyte,34,46,47 which mirrors the observations which had appeared in the 0 °C cycled cell, and the subsequent low made with the Raman results. Additionally, there is a stronger lithium counts observed in the SEI for the 0 °C to 60 °C case. adsorption peak for the damaged electrolytes at 844 cm−1, which
Journal of The Electrochemical Society, 2020 167 090503
Figure 6. Optical images of 1 M LiPF6 in EC:DMC electrolyte from (a) the new and uncycled 210 mAh cell; (b) the 210 mAh cell after 600 cycles at 20 °C; (c)
a cell with apparent gassing after cycling with 20 °C to 60 °C transition; (d) electrolyte flushed from a cell that was overcharged; (e) expanded detail of the EC
ring-bending mode around 720 cm−1, along with the PF6− symmetric stretch around 740 cm−1; (f) expanded detail of the EC ring-stretching mode around
900 cm−1; (g) full Raman spectra of the electrolytes shown in (a–d). Raman plots have been normalized according to the C-H stretch, which is represented by the
peak at 1220 cm−1. The Raman spectra show that the damaged overcharged electrolyte exhibits a slightly more pronounced peak splitting of the 720 cm−1 and
900 cm−1 peaks, along with a more prominent 745 cm−1 stretching band (compared with the 0 °C to 60 °C damaged electrolyte). (h) FTIR spectra of the same
electrolytes.
corresponds to the LiPF6, thus implying the higher concentration.48 the low temperature. Reduced plating at the slower rate led to less
Lastly, small peaks develop at 1150 cm−1 [ν(C-O)s], and 1405 cm−1 decomposition reactions occurring during the shift to higher
[δCH2(sc)], for the damaged electrolytes.49,50 These peaks are all temperature. Because plating is irreversible, we explored a second
secondary bands stemming from the increased presence of Li+ in the strategy of full electrolyte replacement to mitigate gassing due to
electrolyte. The decreased prominence of those bands in the damaged temperature shifts. To replace the electrolyte, a clean hypodermic
electrolyte thus implies the decreased presence of EC in the electro- needed was used to make two small indentures in the pouch, with
lyte, as some must have invariably been consumed during side 1 M LiPF6 EC:DMC (1:1) electrolyte injected into the cell. The
reactions catalyzed by the cycling/temperature shift or overcharge. procedure was repeated at least three times to ensure complete
The similarities in the Raman and FTIR spectra of both types of flushing and rejuvenation of the old electrolyte.
damaged electrolytes suggest that cycling cells in low temperatures The effect of electrolyte replacement of the 0 °C to 60 °C shifted
and high currents followed by transitions to high temperature lead to cell was analyzed via capacity and diffusivity measurements. As
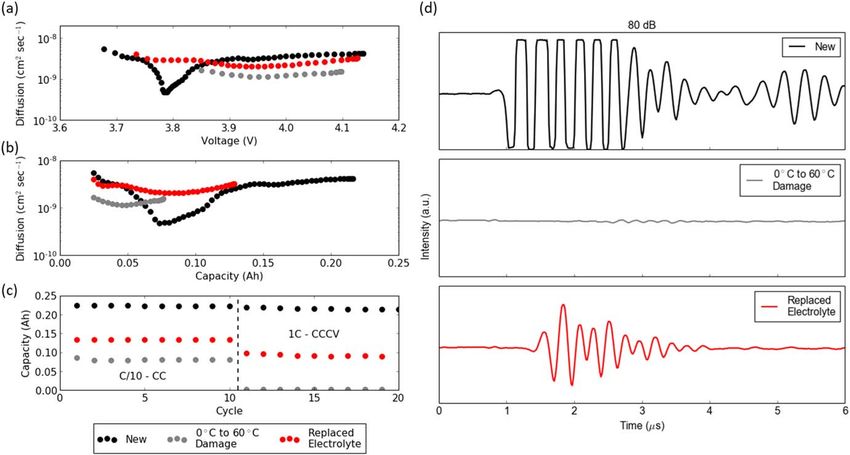
deleterious effects for the battery: lithium plating which then catalyzes indicated in Fig. 1, the 0 °C to 60 °C shift during cycling causes a
subsequent degradation of the electrolyte when brought to higher dramatic decrease in the cell capacity. As also shown in Fig. 7c, the
temperatures. Thus, it is of critical importance for BMS systems to capacity falls from 0.22 Ah (black) to 0.084 Ah (gray). The large
avoid situations that could result in Li-deposition/Li-rich SEI layers, diffusivity trough around 3.8 V (Fig. 7a) as depicted in GITT also
events that can easily happen at temperatures under 10 °C, especially disappears completely, suggesting that lithium storage capabilities at
if those batteries are to be exposed to temperatures above 20 °C. Such that state of charge are no longer electrochemically accessible in the
a variation in temperature is a feature of many climate regions. degraded electrolyte. Average diffusivity values above 3.9 V are also
significantly lower than for a fresh cell. After electrolyte replace-
Electrolyte replacement strategy.—The temperature shift in- ment, the total cell capacity increased from 0.084 Ah to 0.137 Ah
duced gassing and catastrophic loss of cell performance was (Fig. 7c, red). While still quite short of the nominal capacity of
prevented by implementing a slower C/10 cycling protocol during 0.21 Ah, electrolyte replacement did manage to recover close to 20%Journal of The Electrochemical Society, 2020 167 090503
Figure 7. (a) GITT diffusivity vs voltage of fresh 210 mAh cell (black), damaged cell from 0 °C to 60 °C shift (gray), and damaged cell from 0 °C to 60 °C shift
with electrolyte replaced (red); (b) GITT diffusivity of same 3 cells vs capacity; (c) capacity of the three cells at C/10 (CC) for 10 cycles followed by 1C (CCCV)
for 10 cycles; (d) acoustic waveform snapshots at a gain of 80 dB, resulting in oversaturated signal for the fresh cell, completely attenuated signal for the
damaged cell, and signal present for the subsequently replaced electrolyte.
of the total cell capacity. Additionally, diffusivity values in the upper shifts to various temperatures ranging from 20 °C to 60 °C, which led
voltage plateau are higher than before electrolyte replacement, to a statistically significant Arrhenius relationship between rate of
though still lower than a fresh cell. While replacing the electrolyte signal attenuation and magnitude of temperature shift. Acoustic signal
does improve cell health with regards to capacity and diffusivity, it attenuation proved to be an effective parameter for determining when
cannot fully restore a cell to its pristine condition. substantial gassing occurred, which was then correlated with post
Aside from marginal recovery of the diffusivity and capacity, mortem chemical analysis of the SEI and electrolyte. It was shown
electrolyte replacement also affects the acoustic properties of the that lithium deposition at 20 °C) can lead to extensive gassing and Center for Complex Materials, a National Science Foundation
catastrophic failure even if the battery is held at open circuit potential (NSF)-MRSEC program (DMR-1420541). D.S., C.B. and W.C.
at bottom-of-charge. The occurrence of gassing was determined for designed the experiments and performed the electrochemical/acousticJournal of The Electrochemical Society, 2020 167 090503
measurements. T.F., J.Y., and S.P. assisted in the collection of the 24. Q. Q. Liu, D. J. Xiong, R. Petibon, C. Y. Du, and J. R. Dahn, “Gas evolution during
electrochemical data and cell disassembly. D.S. supervised the unwanted lithium plating in li-ion cells with ec-based or ec-free electrolytes.”
J. Electrochem. Soc., 163, A3010 (2016).
project. Funding Sources including a gift from Ford Motor 25. W. Weppner and R. A. Huggins, “Determination of the kinetic parameters of
Company and cells provided by the Department of Energy Vehicle mixed‐conducting electrodes and application to the system Li3Sb.” J. Electrochem.
Technologies Office XCEL Program from Idaho National Lab. Soc., 124, 1569 (1977).
Thanks to Eric Dufek, Tanvir Tanim and Skrikant Nagpure for 26. D. W. Dees, S. Kawauchi, D. P. Abraham, and J. Prakash, “Analysis of the
galvanostatic intermittent titration technique (GITT) as applied to a lithium-ion
insightful conversations. D.S. is a founder of Feasible, which employs porous electrode.” J. Power Sources, 189, 263 (2009).
the ultrasonic technique (patent application #20160223498) used 27. A. Hsieh, S. Bhadra, B. J. Hertzberg, P. J. Gjeltema, A. W. Goy, J. A. Fleischer, and
herein. Feasible did not fund the work nor participate in its execution. D. Steingart, “Electrochemical-acoustic time of flight: In operando correlation of
physical dynamics with battery charge and health.” Energy Environ. Sci., 8, 1569
References (2015).
28. G. Davies, K. W. Knehr, B. V. Tassell, T. Hodson, S. Biswas, A. G. Hsieh, and
1. M. T. F. Rodrigues, G. Babu, H. Gullapalli, K. Kalaga, F. N. Sayed, K. Kato, D. A. Steingart, “State of charge and state of health estimation using electro-
J. Joyner, and P. M. Ajayan, “A materials perspective on li-ion batteries at extreme chemical acoustic time of flight analysis.” J. Electrochem. Soc., 164, A2746 (2017).
temperatures.” Nat. Energy, 2, 17108 (2017). 29. K. W. Knehr, T. Hodson, C. Bommier, G. Davies, A. Kim, and D. A. Steingart,
2. G. Sarre, P. Blanchard, and M. Broussely, “Aging of lithium-ion batteries.” “Understanding full-cell evolution and non-chemical electrode crosstalk of li-ion
J. Power Sources, 127, 65 (2004). batteries.” Joule, 2, 1146 (2018).
3. M. Dubarry, N. Qin, and P. Brooker, “Calendar aging of commercial li-ion cells of 30. B. P. Matadi, S. Geniès, A. Delaille, C. Chabrol, E. de Vito, M. Bardet, J. F. Martin,
different chemistries—a review.” Curr. Opin. Electrochem., 9, 106 (2018). L. Daniel, and Y. Bultel, “Irreversible capacity loss of li-ion batteries cycled at low
4. F. Leng, C. M. Tan, and M. Pecht, “Effect of temperature on the aging rate of li ion temperature due to an untypical layer hindering li diffusion into graphite electrode.”
battery operating above room temperature.” Sci. Rep., 5, 12967 (2015). J. Electrochem. Soc., 164, A2374 (2017).
5. M. Fleischhammer, T. Waldmann, G. Bisle, B. I. Hogg, and M. Wohlfahrt- 31. T. Waldmann and M. Wohlfahrt-Mehrens, “Effects of rest time after Li plating on
Mehrens, “Interaction of cyclic ageing at high-rate and low temperatures and safety safety behavior—ARC tests with commercial high-energy 18650 Li-ion cells.”
in lithium-ion batteries.” J. Power Sources, 274, 432 (2015). Electrochim. Acta, 230, 454 (2017).
6. M. Ouyang, Z. Chu, L. Lu, J. Li, X. Han, X. Feng, and G. Liu, “Low temperature 32. J. Vetter, P. Novák, M. R. Wagner, C. Veit, K. C. Möller, J. O. Besenhard,
aging mechanism identification and lithium deposition in a large format lithium iron M. Winter, M. Wohlfahrt-Mehrens, C. Vogler, and A. Hammouche, “Ageing
phosphate battery for different charge profiles.” J. Power Sources, 286, 309 (2015). mechanisms in lithium-ion batteries.” J. Power Sources, 147, 269 (2005).
7. S. S. Zhang, K. Xu, and T. R. Jow, “Low temperature performance of graphite 33. K. N. Wood and G. Teeter, “XPS on Li-battery-related compounds: analysis of
electrode in li-ion cells.” Electrochim. Acta, 48, 241 (2002). inorganic SEI phases and a methodology for charge correction.” ACS Appl. Energy
8. S. F. Schuster, T. Bach, E. Fleder, J. Müller, M. Brand, G. Sextl, and A. Jossen, Mater., 1, 4493 (2018).
“Nonlinear aging characteristics of lithium-ion cells under different operational 34. B. Jiang, V. Ponnuchamy, Y. Shen, X. Yang, K. Yuan, V. Vetere, S. Mossa,
conditions.” J. Energy Storage, 1, 44 (2015). I. Skarmoutsos, Y. Zhang, and J. Zheng, “The anion effect on Li+ Ion coordination
9. S. Nowak and M. Winter, “Review—chemical analysis for a better understanding of structure in ethylene carbonate solutions.” J. Phys. Chem. Lett., 7, 3554 (2016).
aging and degradation mechanisms of non-aqueous electrolytes for lithium ion 35. B. S. Parimalam, A. D. MacIntosh, R. Kadam, and B. L. Lucht, “Decomposition
batteries: method development, application and lessons learned.” J. Electrochem. reactions of anode solid electrolyte interphase (SEI) components with LiPF6.”
Soc., 162, A2500 (2015). J. Phys. Chem. C, 121, 22733 (2017).
10. T. Waldmann, M. Wilka, M. Kasper, M. Fleischhammer, and M. Wohlfahrt- 36. Z. Mao, M. Farkhondeh, M. Pritzker, M. Fowler, and Z. Chen, “Calendar aging and
Mehrens, “Temperature dependent ageing mechanisms in lithium-ion batteries—a gas generation in commercial graphite/NMC-LMO lithium-ion pouch cell.”
post-mortem study.” J. Power Sources, 262, 129 (2014). J. Electrochem. Soc., 164, A3469 (2017).
11. M. S. D. Darma, M. Lang, K. Kleiner, L. Mereacre, V. Liebau, F. Fauth, 37. C. P. Aiken, J. Xia, D. Y. Wang, D. A. Stevens, S. Trussler, and J. R. Dahn, “An
T. Bergfeldt, and H. Ehrenberg, “The influence of cycling temperature and cycling apparatus for the study of In Situ gas evolution in Li-ion pouch cells.”
rate on the phase specific degradation of a positive electrode in lithium ion batteries: J. Electrochem. Soc., 161, A1548 (2014).
a post mortem analysis.” J. Power Sources, 327, 714 (2016). 38. K. Kumai, H. Miyashiro, Y. Kobayashi, K. Takei, and R. Ishikawa, “Gas generation
12. M. Rosa Palacín, “Understanding ageing in li-ion batteries: a chemical issue.” mechanism due to electrolyte decomposition in commercial lithium-ion cell.”
Chem. Soc. Rev., 47, 4924 (2018). J. Power Sources, 81–82, 715 (1999).
13. J. Xia, L. Ma, and J. R. Dahn, “Improving the long-term cycling performance of 39. R. Imhof and P. Novák, “Oxidative electrolyte solvent degradation in lithium‐ion
lithium-ion batteries at elevated temperature with electrolyte additives.” J. Power batteries: an In Situ differential electrochemical mass spectrometry investigation.”
Sources, 287, 377 (2015). J. Electrochem. Soc., 146, 1702 (1999).
14. A. J. Smith, H. M. Dahn, J. C. Burns, J. C., and J. R. Dahn, “Long-term low-rate 40. M. Morita, Y. Asai, N. Yoshimoto, and M. Ishikawa, “A raman spectroscopic study
cycling of LiCoO2/Graphite li-ion cells at 55 °C.” J. Electrochem. Soc., 159, A705 of organic electrolyte solutions based on binary solvent systems of ethylene
(2012). carbonate with low viscosity solvents which dissolve different lithium salts.”
15. M. Ecker, N. Nieto, S. Käbitz, J. Schmalstieg, H. Blanke, A. Warnecke, and D. J. Chem. Soc. Faraday Trans., 94, 3451 (1998).
U. Sauer, “Calendar and cycle life study of li(NiMnCo)O2-based 18650 lithium-ion 41. B. Klassen, R. Aroca, R. M. Nazri, and G. A. Nazri, “Raman spectra and transport
batteries.” J. Power Sources, 248, 839 (2014). properties of lithium perchlorate in ethylene carbonate based binary solvent systems
16. C. Campion, W. Li, and B. Lucht, “Thermal decomposition of LiPF6-Based for lithium batteries.” J. Phys. Chem. B, 102, 4795 (1998).
electrolytes for lithium-ion batteries.” J. Electrochem. Soc., 152, A2327 (2005). 42. M. Masia, M. Probst, and R. Rey, “Ethylene carbonate−Li+: A theoretical study
17. Y. Fernandes, A. Bry, and S. de Persis, “Identification and quantification of gases of structural and vibrational properties in gas and liquid phases.” J. Phys. Chem. B,
emitted during abuse tests by overcharge of a commercial li-ion battery.” J. Power 108, 2016 (2004).
Sources, 389, 106 (2018). 43. L. Doucey, M. Revault, A. Lautié, A. Chaussé, and R. Messina, “A study of the Li/
18. Y. Fernandes, A. Bry, and S. de Persis, “Thermal degradation analyses of carbonate Li+ couple in DMC and PC solvents: I. Characterization of LiAsF6/DMC and
solvents used in li-ion batteries.” J. Power Sources, 414, 250 (2019). LiAsF6/PC solutions.” Electrochim. Acta, 44, 2371 (1999).
19. Y. Zheng, K. Qian, D. Luo, Y. Li, Q. Lu, B. Li, Y. B. He, X. Wang, J. Li, and 44. R. Aroca, M. Nazri, G. A. Nazri, A. J. Camargo, and M. Trsic, “Vibrational spectra
F. Kang, “Influence of over-discharge on the lifetime and performance of and ion-pair properties of lithium hexafluorophosphate in ethylene carbonate based
LiFePO4/graphite batteries.” RSC Adv., 6, 30474 (2016). mixed-solvent systems for lithium batteries.” J. Solut. Chem., 29, 1047 (2000).
20. N. S. Spinner, C. R. Field, M. H. Hammond, B. A. Williams, K. M. Myers, A. 45. C. M. Burba and R. Frech, “Spectroscopic measurements of ionic association in
L. Lubrano, S. L. Rose-Pehrsson, and S. G. Tuttle, “Physical and chemical analysis solutions of LiPF6.” J. Phys. Chem. B, 109, 15161 (2005).
of lithium-ion battery cell-to-cell failure events inside custom fire chamber.” 46. D. M. Seo, S. Reininger, M. Kutcher, K. Redmond, W. B. Euler, and B. L. Lucht,
J. Power Sources, 279, 713 (2015). “Role of mixed solvation and ion pairing in the solution structure of lithium ion
21. D. P. Finegan, E. Darcy, M. Keyser, B. Tjaden, T. M. M. Heenan, R. Jervis, battery electrolytes.” J. Phys. Chem. C, 119, 14038 (2015).
J. J. Bailey, N. T. Vo, O. V. Magdysyuk, and M. Drakopoulos, “Thermal runaway: 47. A. V. Cresce et al., “Solvation behavior of carbonate-based electrolytes in sodium
identifying the cause of rupture of li-ion batteries during thermal runaway.” Adv. ion batteries.” Phys. Chem. Chem. Phys., 19, 574 (2017).
Sci., 5, 1870003 (2018). 48. M. Nie, D. P. Abraham, D. M. Seo, Y. Chen, A. Bose, and B. L. Lucht, “Role of
22. D. P. Finegan, J. Darst, W. Walker, Q. Li, C. Yang, R. Jervis, T. M. M. Heenan, solution structure in solid electrolyte interphase formation on graphite with LiPF6 in
J. Hack, J. C. Thomas, and A. Rack, “Modelling and experiments to identify high- propylene carbonate.” J. Phys. Chem. C, 117, 25381 (2013).
risk failure scenarios for testing the safety of lithium-ion cells.” J. Power Sources, 49. P. Lanz and P. Novák, “Combined in situ Raman and IR microscopy at the interface
417, 29 (2019). of a single graphite particle with ethylene carbonate/dimethyl carbonate.”
23. J. B. Robinson, D. P. Finegan, T. M. M. Heenan, K. Smith, E. Kendrick, D. J. J. Electrochem. Soc., 161, A1555 (2014).
L. Brett, and P. R. Shearing, “Microstructural analysis of the effects of thermal 50. A. M. Haregewoin, T. D. Shie, S. D. Lin, B. J. Hwang, and F. M. Wang, “An
runaway on Li-ion and Na-ion battery electrodes.” J. Electrochem. Energy Convers. effective In Situ drifts analysis of the solid electrolyte interface in lithium-ion
Storage, 15, 011010 (2017). battery.” ECS Trans., 53, 23 (2013).You can also read