Synchronized spatial shifts of Hadley and Walker circulations
←
→
Page content transcription
If your browser does not render page correctly, please read the page content below
Earth Syst. Dynam., 12, 121–132, 2021
https://doi.org/10.5194/esd-12-121-2021
© Author(s) 2021. This work is distributed under
the Creative Commons Attribution 4.0 License.

                              Synchronized spatial shifts of Hadley
                                    and Walker circulations
                              Kyung-Sook Yun1,2 , Axel Timmermann1,2 , and Malte F. Stuecker3
                   1 Center
                         for Climate Physics, Institute for Basic Science (IBS), Busan 46241, South Korea
                                 2 Pusan National University, Busan 46241, South Korea
        3 Department of Oceanography and International Pacific Research Center, School of Ocean and Earth Science

                           and Technology, University of Hawai‘i at Mānoa, Honolulu, HI, USA
                                   Correspondence: Kyung-Sook Yun (kssh@pusan.ac.kr)

                                 Received: 7 September 2020 – Discussion started: 28 September 2020
                       Revised: 11 December 2020 – Accepted: 17 December 2020 – Published: 2 February 2021

       Abstract. The El Niño–Southern Oscillation (ENSO) influences the most extensive tropospheric circulation
       cells on our planet, known as Hadley and Walker circulations. Previous studies have largely focused on the effect
       of ENSO on the strength of these cells. However, what has remained uncertain is whether interannual sea surface
       temperature anomalies can also cause synchronized spatial shifts of these circulations. Here, by examining the
       spatiotemporal relationship between Hadley and Walker cells in observations and climate model experiments,
       we demonstrate that the seasonally evolving warm-pool sea surface temperature (SST) anomalies in the decay
       phase of an El Niño event generate a meridionally asymmetric Walker circulation response, which couples the
       zonal and meridional atmospheric overturning circulations. This process, which can be characterized as a phase-
       synchronized spatial shift in Walker and Hadley cells, is accompanied by cross-equatorial northwesterly low-
       level flow that diverges from an area of anomalous drying in the western North Pacific and converges towards
       a region with anomalous moistening in the southern central Pacific. Our results show that the SST-induced
       concurrent spatial shifts of the two circulations are climatically relevant as they can further amplify extratropical
       precipitation variability on interannual timescales.

1   Introduction                                                    Soden, 2007; England et al., 2014; Liu and Zhou, 2017; Ma
                                                                    et al., 2018; Klein et al., 1999; Karnauskas and Ummenhofer,
Changes in the zonal equatorial Walker cell (WC; tropical-          2014). On interannual timescales, the co-variability between
mean zonal cell) and the meridional Hadley Cell (HC; zonal-         WC and HC strengths is tied to the El Niño–Southern Oscil-
mean meridional cell) are known to cause major climate dis-         lation (ENSO)-related sea surface temperature (SST) gradi-
ruptions across our planet. Because of their considerable im-       ents along the Equator, associated with uneven spatial distri-
pacts on various regional climates and extreme events, such         bution of tropical convection (Oort and Yienger, 1996; Klein
as heat waves (Garcia-Herrera et al., 2010), tropical cyclones      et al., 1999; Minobe, 2004). However, observational anal-
(Wu et al., 2018), sea level rise in the western Pacific (Tim-      yses suggest more complicated relationships, which cannot
mermann et al., 2010), droughts (Dai, 2011; Lau and Kim,            be fully explained by peak ENSO dynamics alone (Clarke
2015) and regional monsoon variability (Kumar et al., 1999;         and Lebedev, 1996; Mitas and Clement, 2005; Tanaka et al.,
Bollasina et al., 2011), the variations in the strength and po-     2005; Ma and Zhou, 2016).
sition of WC and HC have been examined extensively across              In general, these two large-scale circulations can change
a wide range of timescales. It has been shown that changes in       independently from each, either in terms of their strength or
the strength of the WC are connected to those of the HC, in         their geographical position, but during strong El Niño and La
part due to the shared ascending branch of zonal and merid-         Niña winters these circulations can change in unison. More
ional overturning cells in the warm-pool region (Vecchi and

Published by Copernicus Publications on behalf of the European Geosciences Union.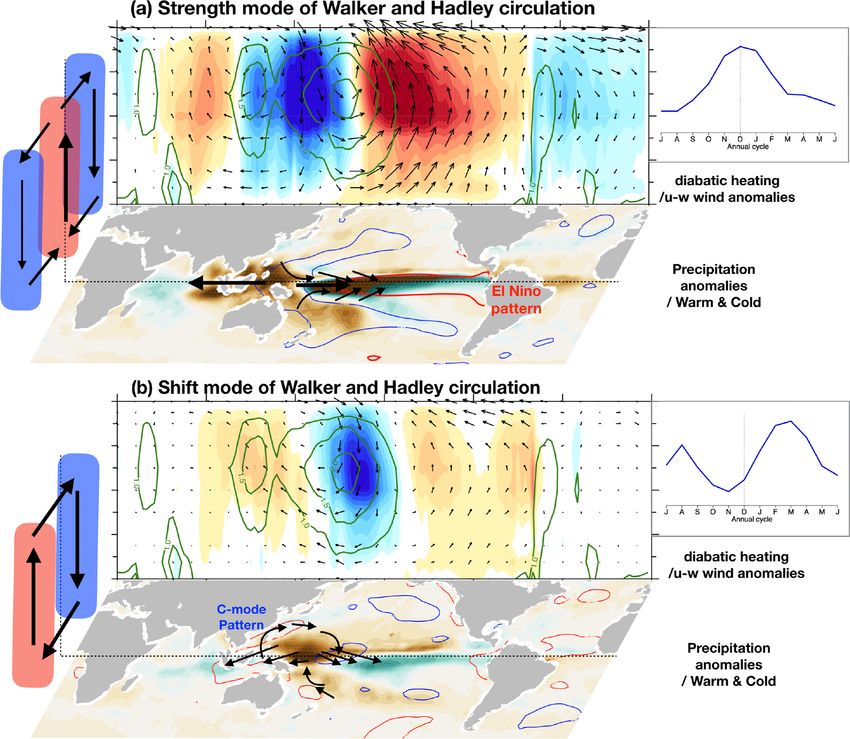
122                                            K.-S. Yun et al.: Synchronized spatial shifts of Hadley and Walker circulations

specifically during peak El Niño events in boreal winter, the     and observations. The AMIP multi-model ensemble (MME)
WC weakens and the rising branch shifts eastward. This is         represents the SST-forced signal, whereas a mixed signal
accompanied by a strengthening of the HC and an enhanced          of SST-forced variability and unforced atmospheric noise is
upward motion in the equatorial region (Ma and Li, 2008;          present in the observations and individual AMIP simulations.
Bayr et al., 2014; Guo and Tan, 2018; Minobe, 2004; Klein et      Additionally, to examine the impact of SST forcing ampli-
al., 1999) (also see Fig. S1 and Table S1 in the Supplement).     tude on the WC–HC synchronization, we analyzed a set of
For peak La Niña conditions in winter the atmospheric re-         40 multi-model CMIP5 historical simulations covering the
sponse is approximately the opposite. Previous studies have       industrial period from 1900–2005 (see Taylor et al., 2012 for
mostly focused on the response of the HC and WC strength          details). Only one ensemble member (r1i1p1) was used for
to the peak phase of ENSO (i.e., a weakening of WC and            each model. All observations and MME data were interpo-
strengthening of HC). Here we address a different question:       lated to a regular 2.5◦ × 2.5◦ horizontal grid before the anal-
Under what circumstances do the WC and HC show con-               yses.
current shifts in their geographic position? We further in-
vestigate whether these two dominant atmospheric circula-
tion cells are coupled even in the absence of tropical ENSO-      2.3   Walker cell and Hadley cell variability
related SST anomalies. To address these questions, we con-
duct a comprehensive analysis of the dynamical coupling be-       We calculated the monthly mass stream function (MSF)
tween HC and WC using observational data and a series of          anomalies on the three-dimensional atmospheric circulation
SST-forced atmospheric general circulation model (AGCM)           to describe the WC and HC circulations:
simulations. We will focus on 2 important degrees of free-
dom that characterize variations in these circulations: their                     2π a ps
                                                                                       Z
strength and spatial position.                                    ψWC (x, z, t) =          uD dp,                            (1)
                                                                                   g p
                                                                                           Z ps
                                                                                  2π acosφ
2     Data and method
                                                                  ψHC (y, z, t) =               [v]dp.                       (2)
                                                                                      g     p

2.1    Observations
                                                                  Following previous work (Yu and Zwiers, 2010), the tropical
We used the monthly reanalysis circulation dataset from           zonal circulation (ψWC ) is expressed as the divergent com-
the European Centre for Medium-Range Weather Forecasts            ponent (uD ) of zonal wind averaged over the tropics (5◦ S–
(ECMWF) atmospheric interim (ERAI) data from 1979 to              5◦ N) (zonal mass stream function). The tropical meridional
2017 (Dee et al., 2011). In addition, we obtained the monthly     circulation (ψHC ) is the zonally averaged meridional mass
SST and precipitation data from the extended reconstruction       stream function. Next, we conducted an empirical orthogo-
of global SST (ERSSTv5) since 1854 (Smith et al., 2008) and       nal function (EOF) analysis of monthly MSF anomalies to
Global Precipitation Climatology project (GPCP) version 2.3       characterize the dominant modes of the tropical atmospheric
from 1979 to 2017 (Adler et al., 2003), as well as the Cli-       mass flux variability. For fair comparison between observa-
matic Research Unit (CRU) TS4.03 land precipitation from          tions and simulations, the MSF fields in every single model
1901 to 2017 (Harris et al., 2014), respectively. The monthly     were projected onto the EOF pattern derived from the obser-
anomalies for 1979–2017 were calculated by removing the           vations to generate principal component (PC) time series for
seasonal cycle and linear trend coefficient during the analysis   the simulated WC and HC variability. The interannual com-
period. The ENSO variability was characterized by a spatial       ponent of variability was isolated by applying a 10-point But-
average of SST anomalies over the tropical eastern Pacific        terworth band-pass filter with 1.5-year (18-month) and 10-
Niño3 region (5◦ S–5◦ N, 150–90◦ W).                              year cutoffs. The WC and HC strengths were, respectively,
                                                                  calculated as the maximum value of tropical mean (5◦ S–
                                                                  5◦ N) MSF at 500 hPa and as the maximum of zonal mean
2.2    AMIP and CMIP models
                                                                  MSF at 500 hPa within the latitudinal zone of 30◦ S–30◦ N
We used 40 AGCM simulations from the forced AGCM In-              (Oort and Yienger, 1996), respectively.
tercomparison Projection (AMIP): 19 model runs are part of
the Coupled Model Inter-comparison Project (CMIP) Phase
5 (Taylor et al., 2012) and 21 models are part of Phase 6         2.4   Phase synchronization of Walker cell and Hadley
(Eyring et al., 2016) (i.e., AMIP5 and AMIP6; Tables S2 and             cell variability
S3). The AMIP simulations were forced by the observed SST
and sea ice concentrations from 1979–2008 for AMIP5 and           To examine the phase synchronization of the large-scale cir-
from 1979–2014 for AMIP6. The AMIP runs use the ob-               culation, we calculated the complex analytical signal (T̂ (t))
served SST boundary forcing, which allows us to directly          using the Hilbert transform. The amplitude and phase of the
compare SST-forced atmospheric responses in simulations           PC time series can be obtained from T̂ (t), based on a Carte-

Earth Syst. Dynam., 12, 121–132, 2021                                               https://doi.org/10.5194/esd-12-121-2021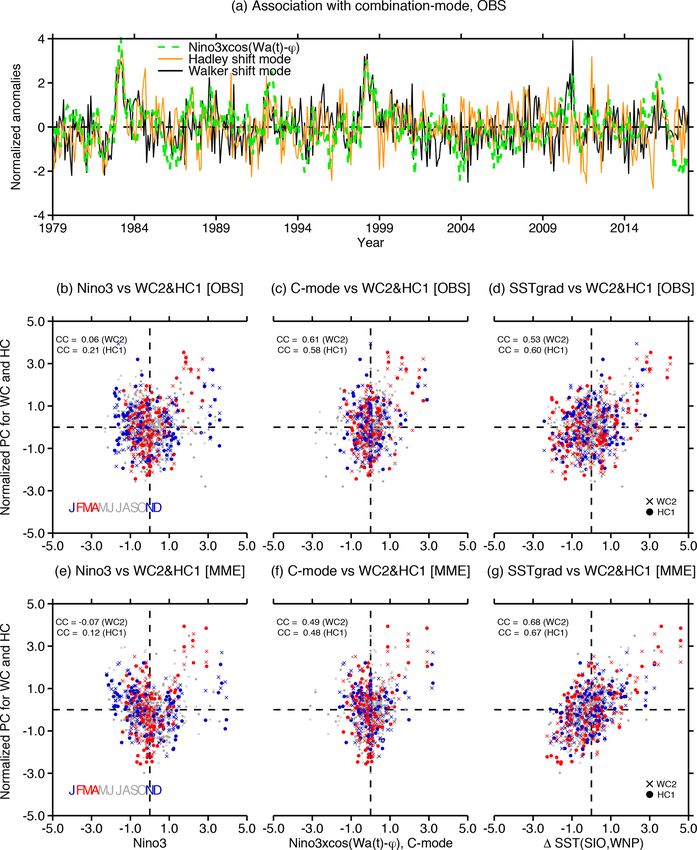
K.-S. Yun et al.: Synchronized spatial shifts of Hadley and Walker circulations                                              123

sian to polar coordinate transform (e.g., Stein et al., 2014):     HC (Fig. 1c and e). No statistically significant linear corre-
        q                                                          lation between the PCs of HC1 or WC2 and Niño3 anoma-
α(t) = Re(T̂ (t))2 + Im(T̂ (t))2 and                               lies can be found on interannual timescales (CC ∼ 0.06 for
                                                                   WC2-Niño3; CC ∼ 0.2 for HC1-Niño3). This indicates that
               Im(T̂ (t))
8(t) = Arg                  ,                               (3)    the peak ENSO dynamics alone cannot explain the synchro-
               Re(T̂ (t))                                          nized spatial shifts in these two circulations. This stands in
where the generalized phase difference has the following ex-       sharp contrast with the peak-phase ENSO-driven co-varying
pression:                                                          strength of the cells (CC ∼ 0.91 for WC1–Niño3; CC ∼ 0.87
                                                                   for HC2-Niño3; see also Fig. S1c) that has been highlighted
18(t) = 8WC (t) − 8HC (t),                                  (4)    previously. Despite the fact that there is no linear contempo-
where 8WC (t) and 8HC (t) indicate the phase of the WC and         raneous relationship between ENSO (Niño3 SST) and the co-
HC PC time series, respectively. If the absolute tendency of       varying spatial circulation shifts, there is still a pronounced
the phase difference (i.e., | d(18(t)) |) is close to zero, then   statistically significant relationship between WC2 and HC1
                                 dt
8WC (t) and 8HC (t) are synchronized (Pikovsky et al., 2000).      variability (see Fig. 1d; CC ∼ 0.66 significant at 99 % con-
We use the following criterion for phases synchronization:         fidence level) in a 40-member MME of SST-forced AMIP
phases synchronization occurs when the absolute tendency of        experiments. This WC2–HC1 linkage breaks down when the
a smoothed (i.e., 7-month running mean) phase difference of        SST-forced MME component is subtracted from the PCs of
the WC and HC shift modes is less than 0.3 degrees/month.          the individual AMIP runs (i.e., PC differences between indi-
Strictly speaking, phase synchronization can only occur in         vidual AMIP simulations and the MME; Fig. S2). This raises
nonlinear dynamic systems.                                         the question of what type of SST pattern is responsible for the
                                                                   synchronized spatial shifts of WC and HC.
                                                                      This discrepancy calls for two important aspects of ENSO
3     Result
                                                                   to be considered: one is the peak-phase ENSO signal (which
                                                                   occurs in boreal winter); the other are the seasonally mod-
3.1    Phase-synchronized spatial shifts of Walker and
                                                                   ulated characteristics of ENSO, i.e., the combination mode
       Hadley circulations
                                                                   between ENSO and the Indo-Pacific warm-pool SST an-
First, we conduct an EOF analysis of the monthly MSF               nual cycle (C mode; with a time evolution that peaks in
anomalies, obtained from atmospheric reanalysis data cov-          boreal spring) (Stuecker et al., 2013, 2015). The C mode
ering the period 1979–2017. In addition to their co-varying        arises from an amplitude modulation of the warm-pool an-
strength (characterized by EOF1 for WC (WC1) and EOF2              nual cycle (with a frequency of 1 year−1 ) and the inter-
for HC (HC2) – shown in Fig. S1) that has been discussed           annual ENSO signal (∼ 1/2–1/7 year−1 frequency). The C
extensively in previous studies (Ma and Li, 2008; Bayr et          mode plays a crucial role in the phase transition of ENSO
al., 2014; Guo and Tan, 2018; Minobe, 2004), we find that          events as well as in bridging ENSO’s impacts on the East
the EOF2 of the WC (WC2) and the EOF1 of the HC (HC1)              Asian monsoon system (Stuecker et al., 2013, 2015). We em-
are related to each other (correlation coefficient CC ∼ 0.49,      phasize that the meridionally asymmetric anomalous atmo-
Fig. 1a–c). Compared to the climatological circulation pat-        spheric C-mode circulation is mostly associated with strong
tern (contours in Fig. 1a, b) of WC and HC, WC2 and                El Niño events occurring in the eastern equatorial Pacific and
HC1 describe zonal and meridional shifts occurring over            less so for central Pacific El Niño events (McGregor et al.,
the shared rising branch of the two circulations (shading          2013) (e.g., CC ∼ 0.55 for WC2-Niño3 during boreal spring;
in Fig. 1a, b) over the Western Pacific Warm Pool. These           CC ∼ 0.09 for WC2-Niño4). We hypothesize here that the
anomalies characterize an eastward shift of the WC and an          seasonally evolving warm-pool SST anomalies after the peak
equatorially asymmetric clockwise HC that is sometimes re-         ENSO phase (i.e., C mode) serve as a pacemaker linking the
ferred to as cross-equatorial anomalous HC (Table S1 also          phase-synchronized spatial shifts in WC and HC variability.
clearly supports the co-varying zonal and meridional changes       The seasonal differences in relationship between WC2 and
in WC and HC variability). Due to the spatiotemporal orthog-       HC1 and Niño3 indices support our hypothesis (see Fig. S3).
onality of EOF modes, the co-varying spatial shifts of the         The WC2-regressed SST anomaly pattern (bottom in Fig. 1a)
WC and HC are uncorrelated to the strength changes in both         also bears resemblance to the previously suggested C-mode-
circulations (e.g., CC between WC2 and WC strength in-             generated SST dipole pattern with anomalous warming in the
dex ∼ 0.08; CC between HC1 and HC strength index ∼ 0.02;           southern Indian Ocean (SIO) and anomalous cooling in the
see Table S1).                                                     western North Pacific (WNP) (Stuecker et al., 2015; Zhang
   Previous studies showed that the ENSO-related SST vari-         et al., 2016). This suggests that the Walker and Hadley shift
ability leads to the co-varying strength of WC and HC (i.e.,       mode variability is linked via nonlinear C-mode dynamics
Walker and Hadley strength modes) (e.g., Minobe, 2004;             and not well reflected by common ENSO indices (such as
Guo and Tan, 2018). Here, we explore the relationship be-          Niño3) that instead describe peak boreal winter ENSO vari-
tween ENSO and the co-varying spatial shifts of the WC and

https://doi.org/10.5194/esd-12-121-2021                                               Earth Syst. Dynam., 12, 121–132, 2021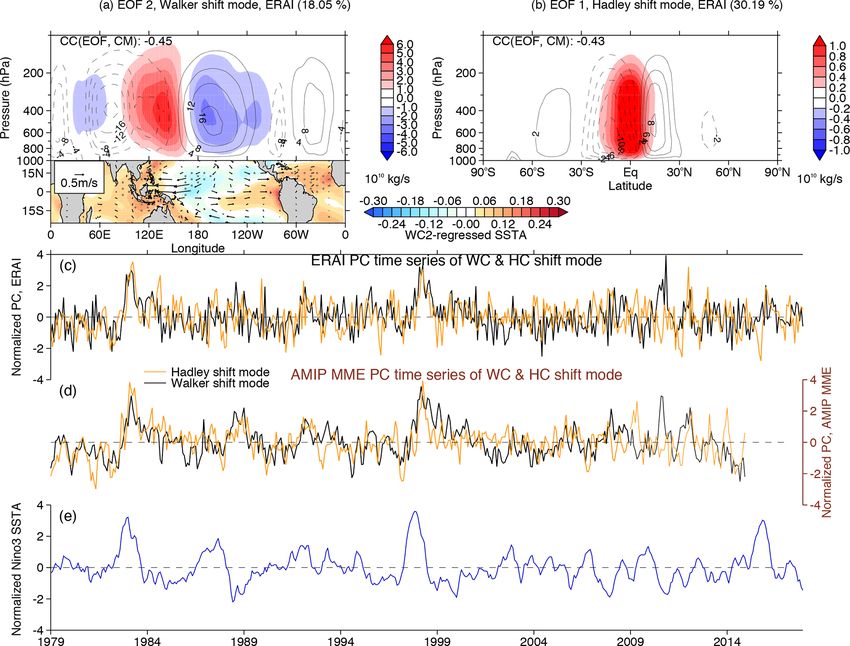
124                                              K.-S. Yun et al.: Synchronized spatial shifts of Hadley and Walker circulations

Figure 1. Phase-synchronized spatial shifts of the Walker and Hadley circulations. (a, b) The dominant patterns of the shift modes (i.e.,
EOF2 for Walker and EOF1 for Hadley; denoted by shading) for (a) Walker circulation (WC) and (b) Hadley circulation (HC) variability.
The WC and HC are identified as (a) tropical (5◦ S–5◦ N) averaged mass stream function (MSF) anomalies and (b) zonally averaged MSF
anomalies, obtained from the monthly ERA interim (ERAI) data during the period 1979–2017. The contours show the climatological mean
(CM) of the MSF for the circulations. The pattern correlation coefficients (CCs) between EOF and CM are also displayed in (a, b). The SST
and 850 hPa wind anomaly patterns regressed against the WC2 principal component (PC) are displayed as a bottom inset in (a). (c, d) The
normalized PC time series of the shift modes (i.e., WC2&HC1), derived from (c) ERAI and (d) the multi-model ensemble (MME) average
for 40 AMIP models (1979–2008 for 19 AMIP5 and 1979–2014 for 21 AMIP6 models). (e) The normalized Niño3 SST anomaly (ERSSTv5)
time evolution.

ability and the associated Walker and Hadley strength modes            linear coupling. Therefore, before focusing on the physical
(Fig. S1).                                                             linkage between these shift modes, we further examine the
                                                                       co-varying WC–HC shifts in the framework of phase syn-
                                                                       chronization and nonlinear coupling. Phase synchronization,
3.2   SST-forced variability of Walker and Hadley                      which requires nonlinear dynamics, is characterized by coop-
      circulations                                                     erative and organized oscillatory behavior between two fluc-
                                                                       tuating systems. To study this process, we first calculate the
In the previous section, we showed that the “Walker and
                                                                       generalized phase difference between WC2 and HC1 vari-
Hadley shift modes” are coupled to each other, and we hy-
                                                                       abilities (i.e., 18 (t) = 81 − 82), using the complex analyt-
pothesized an important role of the seasonally modulated dy-
                                                                       ical signal of the respective principal components WC PC2
namics of ENSO. The previously applied linear correlation
                                                                       and HC PC1 (Sect. 2.4). The analytical signal approach em-
analysis is well suited to analyze the amplitude relationships;
                                                                       beds a time series into a complex space by adding the origi-
however, it is not sensitive to the seasonally modulated non-

Earth Syst. Dynam., 12, 121–132, 2021                                                     https://doi.org/10.5194/esd-12-121-2021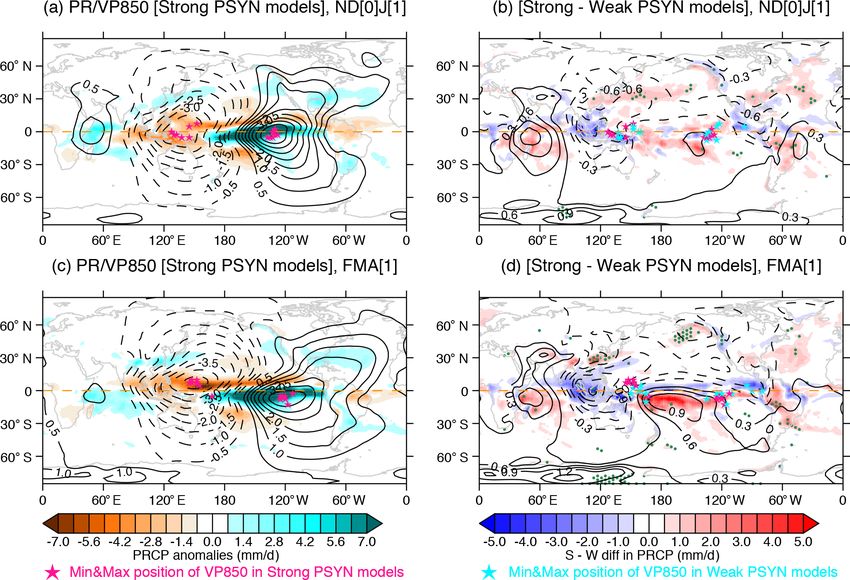
K.-S. Yun et al.: Synchronized spatial shifts of Hadley and Walker circulations                                                        125

Figure 2. SST-forced phase-synchronized spatial shifts of the HC and WC. (a) The smoothed (i.e, 7-month running mean) phase difference
between PC time series of WC2 and HC1 (position of dots) and its absolute tendency (color of dots), obtained from the ERAI observational
data (1979–2017; black) and AMIP MME (1979–2014; gray). Here, the phase is calculated from the analytical signal of the PCs using the
Hilbert transform (see section on the method for detail). The phase-synchronized (PSYN) months are measured by the criterion that the
absolute tendency of phase difference is less than 0.3◦ /month. The red vertically shaded zone indicates PSYN periods that are identical for
both observations and the AMIP MME. (b, c) The absolute tendency of WC–HC phase difference as a function of Niño3 SST anomaly
(pink), obtained from the (b) observations and (c) AMIP MME. Sky-blue dots indicate tendencies calculated from the randomly shuffled
PCs. The frequency histogram of the absolute tendency of the WC–HC phase difference is also vertically plotted in each right inset.

nal time series with the Hilbert transform of this time series          forcing and atmospheric noise: there are four long-lasting
times the imaginary number (Pikovsky et al., 2000; Stein et             (greater than 6 months) PSYN periods in the observations
al., 2014; Rosenblum et al., 1998; Rosenblum, 2000; Tass                but eight such events in the AMIP MME. The WC–HC phase
et al., 1998). The phase difference between WC2 PC and                  synchronization is particularly prominent during the two ex-
HC1 PC (Fig. 2a) shows periods of near-constant phase dif-              treme El Niño events (1982–1893 and 1997–1998) that have
ference. Constant phase differences, which occur more fre-              much longer PSYN periods (exceeding 1 year) in both ob-
quently than expected by randomness, are indicative of the              servations and the AMIP MME. An interesting point is that
emergence of phase synchronization between WC and HC                    the WC–HC phase difference shows a decadal change after
shift modes. When the absolute tendency of the phase dif-               2000 in both observations and the AMIP MME. This may be
ference (i.e., |d(18(t))/dt|) in our calculations is less than          a consequence of the Pacific WC intensification which can be
0.3 degrees/month (Fig. 2a), we refer to the period as a phase-         linked to the concurrent tropical Atlantic warming and trop-
synchronized period. During these periods the phases of two             ical eastern Pacific cooling (England et al., 2014; McGregor
signals are not drifting apart randomly but are bounded by              et al., 2014; associated with multi-decadal climate variabil-
the underlying nonlinear interactions.                                  ity in both the Atlantic and Pacific) and/or zonal shifts in the
   We next examine the question of whether the synchro-                 dominant ENSO SST pattern (Sohn et al., 2013). Further ex-
nization of Walker and Hadley shift modes can in principle              ploration of the underlying physical mechanisms is, however,
be driven by random atmospheric stochastic variability, or              beyond the scope of this study.
if SST-forced variability is a prerequisite. The SST-forced                To further explore the relative effects of random atmo-
AMIP MME shows more frequent phase-synchronized                         spheric noise and SST-forced variability on the WC–HC syn-
(PSYN) months than the observations (Fig. 2a) and most                  chronization, we generate pseudo-PCs by randomly shuffling
CMIP5 models (Fig. S4), exhibiting the effects of both SST              the PCs for both the observations and the AMIP MME and

https://doi.org/10.5194/esd-12-121-2021                                                      Earth Syst. Dynam., 12, 121–132, 2021
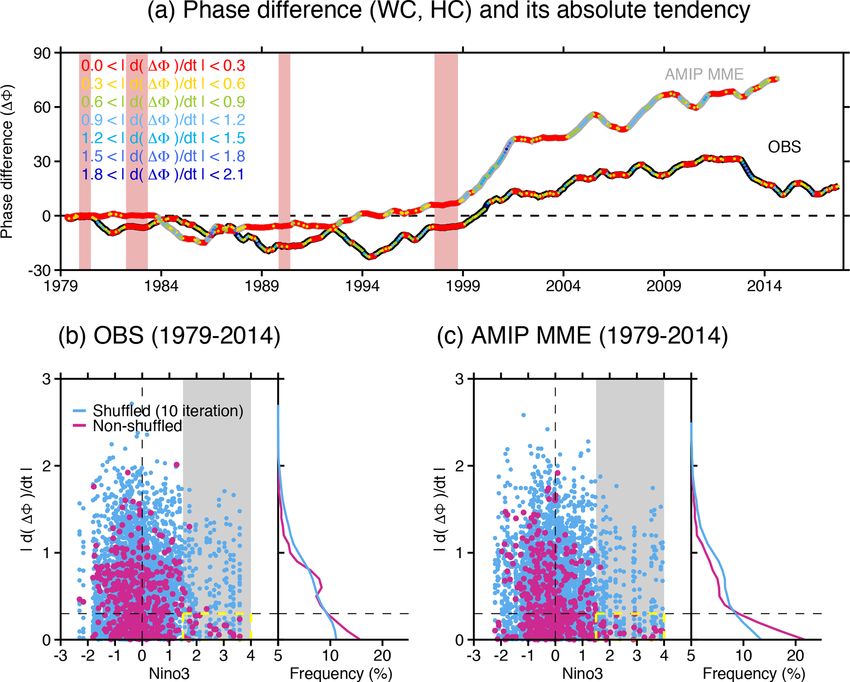
126                                              K.-S. Yun et al.: Synchronized spatial shifts of Hadley and Walker circulations

Figure 3. Seasonal dependency of phase-synchronized spatial shifts of the HC and WC. (a) The normalized PC time series of the shift
modes (i.e., WC2 and HC1) and the combination mode (Stuecker et al., 2013; dashed green line). (b–g) Scatterplot of normalized time series
for SST anomalies (x axis) versus PCs of WC2 (x symbol) and HC1 (y axis), obtained from the observations (1979–2017; b–d) and the
AMIP MME (1979–2014; e–g): (b, e) Niño3, (c, f) combination mode, and (d, g) SST gradient between southern Indian Ocean (20–5◦ S,
90–120◦ E) and western North Pacific (0–15◦ N, 140–170◦ E) (SSTgrad). Each season is displayed in different colors.

repeating this 10 times. A comparison of the phase differ-             domized phases: the frequency for phase synchronization
ence tendencies using the original PCs (pink dots in Fig. 2b,          (i.e., the ratio of the PSYN number compared to the number
c) and of the pseudo-PCs (sky-blue dots) reveals that dur-             in the gray-shaded area) is ∼ 83 % for the observations and
ing the evolution of El Niño events (Niño3 >1.5 standard               96 % for the AMIP MME, whereas the ratio for the pseudo-
deviations (SDs); denoted by gray shading), the phase syn-             PCs (sky-blue dots) is only ∼ 33 % in the observations and
chronization (i.e., |d(18(t))/dt|
K.-S. Yun et al.: Synchronized spatial shifts of Hadley and Walker circulations                                                    127

Figure 4. Global pattern of phase-synchronized spatial shifts of HC and WC. Composite anomalies during PSYN months (i.e., the absolute
tendency of phase difference is less than 0.3) with February–March–April (FMA[1]) extreme El Niño (FMA[1] Niño3 >1.5 SD), obtained
from the observations (a, c) and the AMIP MME (b, d): (a, b) 850 hPa velocity potential (VP850; contours) and 200 hPa velocity potential
(VP200; shading) anomaly; (c, d) precipitation (GPCP for ocean and CRU for land; shading) and 850 hPa wind (vector) anomaly. The
hatching shows the area where the difference is statistically insignificant at the 99 % confidence level.

nization is indistinguishable from random variability, hinting        which is calculated from the SST gradient between the SIO
also at an important nonlinearity in the atmospheric response         (20–5◦ S, 90–120◦ E) and the WNP (0–15◦ N, 140–170◦ E)
to tropical Pacific SST forcing. The PSYN probability from            (i.e., SSTgrad; SST(SIO, WNP)), as shown by the WC2-
pseudo-PCs in the case of extreme El Niño events is simi-             regressed SST pattern in Fig. 1a. We can see strong seasonal
lar to the probability for the entire dataset (∼ 35 %). Con-          characteristics in both SST indices (Niño3, C mode and SST-
sequently, this result indicates that even though the tempo-          grad) as well as in the shift modes (Fig. 3b–g). The com-
ral correlation between all-month Niño3 SST anomalies and             mon Niño3 index peaks in boreal winter (i.e., November–
PC2 WC and PC1 HC is marginal, eastern equatorial Pacific             December–January, NDJ; blue dots) in both observations and
SST forcing still leads to an increased probability for WC–           the AMIP MME. Different from this winter-maximum El
HC phase synchronization, during the El Niño event evolu-             Niño variability, the SSTgrad (or C mode) variability reaches
tion. This discrepancy can be explained by the fact that cor-         its maximum during boreal spring (i.e., February–March–
relations emphasize amplitude relationships and are less sen-         April, FMA; red dots). The difference in seasonality, which
sitive to seasonally modulated coupling which is induced by           is also clearly seen in Fig. S5, can explain the very low corre-
the phase-synchronization mechanism.                                  lation coefficient between the common Niño3 index and the
   Our analysis has revealed that the Walker and Hadley shift         shift modes. Despite this insignificant correlation, during the
modes are more connected to the seasonally modulated dy-              boreal spring, warmer Niño3 anomalies tend to be associated
namics of ENSO (i.e., the C mode) rather than the peak-               with enhanced shift mode variability; however, the opposite
phase ENSO amplitude signal. Figure 3a clearly shows the              is not true for cold Niño3 anomalies (i.e., La Niña). This
statistically significant co-variability between observed time        is consistent with the previous conclusion that the WC–HC
series of WC–HC PCs and the C mode (which is defined here             phase synchronization only occurs during extreme El Niño
as Niño3 × cos(ωa (t) − ϕ), where ωa (t) is angular frequency         events but not during extreme La Niña events. This spring-
of the annual cycle and ϕ is a 1-month phase shift; Stuecker          time seasonal preference is evident for the SSTgrad (or C
et al., 2013) (CC ∼ 0.61 and 0.58 on interannual timescales).         mode) index, resulting in a statistically significant relation-
To further test the association with the C mode, we also con-         ship between SSTgrad (or C mode) and WC–HC coupling in
sider an SST index representing the integrated effect of C-           both observations and the AMIP MME (Fig. 3d and g). This
mode dynamics (see also discussion in Zhang et al., 2016),            again indicates the important impact of springtime SSTgrad

https://doi.org/10.5194/esd-12-121-2021                                                   Earth Syst. Dynam., 12, 121–132, 2021
128                                               K.-S. Yun et al.: Synchronized spatial shifts of Hadley and Walker circulations

Figure 5. Impact of phase-synchronized spatial shifts of the HC and WC on global precipitation. (a) The November–December[0]–
January[1] extreme El Niño (i.e., 1982/1983 and 1997/1998) composite anomaly of precipitation (shading) and 850 hPa velocity potential
(VP850; contours) obtained from the eight strong PSYN models in the AMIP simulations and (b) the difference between eight strong PSYN
models and eight weak PSYN models. (c, d) Same as (a, b), but for February–March–April (FMA[1]). The green dots in (b, d) indicate
the area where the precipitation difference is statistically significant at the 99 % confidence level. The pink and cyan star symbols indicate
the positions of maximum and minimum VP850 anomalies for the strong PSYN and weak PSYN models. Here, the strong PSYN and weak
PSYN model groups are categorized according to interannual correlation coefficients between WC2 and HC1 within 19 AMIP5 and 21
AMIP6 models, respectively (see Tables 2 and 3).

anomalies and C-mode dynamics on the phase synchroniza-                  in previous studies; Stuecker et al., 2013, 2015). This equa-
tion of WC–HC.                                                           torially asymmetric circulation pattern is considerably dif-
                                                                         ferent from the equatorially symmetric pattern derived from
                                                                         the wintertime PSYN composite (see Fig. S6) and even the
3.3   Global pattern and impact of phase-synchronized                    springtime non-PSYN composite (Fig. S7). The meridionally
      spatial shifts                                                     asymmetric WC can be linked to the HC, along with cross-
                                                                         equatorial northwesterly flow. A general agreement between
Our results suggest that the spring SSTgrad anomalies that
                                                                         the observation-based and AMIP MME-based patterns also
occur after the El Niño winter peak phase (Stuecker et al.,
                                                                         reflects that the SST-forced variability acts to modulate the
2015; Zhang et al., 2016) play an important role for the
                                                                         phase synchronization of the WC–HC shift modes.
phase synchronization of WC and HC shift modes. We fur-
                                                                            We emphasize that the simulated ENSO SST anomaly
ther examine the physical mechanism for the WC–HC phase-
                                                                         amplitudes in coupled models of the CMIP5 are correlated
synchronized spatial shifts by exploring the global climate
                                                                         with the probability of phase synchronization between the
patterns that occur during springtime phase-synchronized pe-
                                                                         WC and HC shift modes (Fig. S4). The models exhibiting
riods in WC and HC variability (Fig. 4; composite when
                                                                         large ENSO variability can initiate strong teleconnections
|d(18(t))/dt| 1.5 SD).
                                                                         through the atmospheric bridge process, thus likely lead-
A key feature is that the center of low-level divergence
                                                                         ing to the phase-synchronized zonal and meridional shifts
(upper-level convergence) and drying is located over the off-
                                                                         of the WC and HC, respectively (see Fig. S8). An under-
equatorial WNP region, whereas the center of convergence
                                                                         lying cause could be the strong meridional asymmetry of
and moistening is situated in the off-equatorial southern cen-
                                                                         the warm-pool climatological SST and zonal winds (Fig. S9)
tral Pacific (corresponding to the C-mode pattern discussed

Earth Syst. Dynam., 12, 121–132, 2021                                                         https://doi.org/10.5194/esd-12-121-2021
K.-S. Yun et al.: Synchronized spatial shifts of Hadley and Walker circulations 129
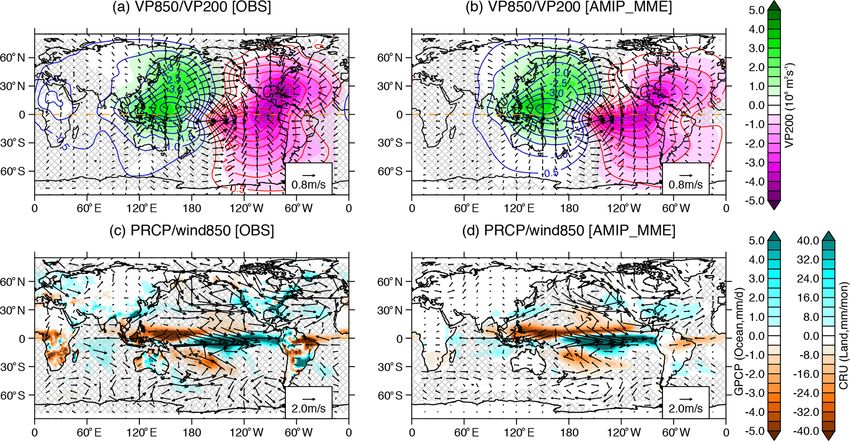
Figure 6. Schematic diagram showing the strength and spatial shift of Walker and Hadley circulations. (a) Walker and Hadley circulation
strength mode (WC1&HC2) and (b) shift mode (WC2&HC1) on interannual timescale. Panel (a) shows the longitude–height structure
averaged over tropics (15◦ S–15◦ N) for the diabatic heating anomalies (shading), climatological diabatic heating (green contours) and u–w
wind anomalies (vectors). The bottom horizontal map shows the precipitation anomalies (shading) and warm/cold SST anomalies (red/blue
contours). The schematic on the left indicates the anomalous Hadley circulation. All plots are based on the regressed anomalies against the
Walker circulation variability (WC1 in a and WC2 in b). The upper right panels show the annual cycle of circulation variability.
and C-mode-associated extreme shifts of the South Pacific By comparing the strong El Niño (i.e., 1982/1983 and
Convergence Zone (SPCZ) shifts (McGregor et al., 2012). 1997/1998) composite averaged for eight strong PSYN mod-
We further hypothesize that stronger phase synchronization els with that averaged for eight weak PSYN models (Fig. 5),
of the WC–HC shift modes can generate larger global pre- we see that the models with a strong coupling between the
cipitation responses, regardless of the ENSO amplitude. To HC and WC shift modes generate a prominent springtime
illustrate this, we use the individual 40 AMIP simulations (FMA) asymmetry between WNP divergence and southern
that have identical ENSO SST amplitude prescribed as their central Pacific convergence. In particular, the geographical
boundary forcing but exhibit different strengths of WC2– positions of minimum low-level divergence and maximum
HC1 phase synchronization. The strong PSYN models and low-level convergence exhibit a clear contrast between the
weak PSYN models are thus classified as a function of their strong PSYN models and weak PSYN models (see pink and
strength of WC2–HC1 phase synchronization, where this cyan star symbols in Fig. 5): the NW-SE oriented pattern
strength is measured by the (interannual) correlation coeffi- is predominant for the strong PSYN models, but it is less
cient between WC2 and HC1 PC variations in the individual pronounced for the weak models. Accordingly, the increased
AMIPs (see Tables S2 and S3 for chosen model groups). precipitation anomalies in the extratropical regions (e.g., East
Asia and South America) are larger for the strong PSYN
https://doi.org/10.5194/esd-12-121-2021 Earth Syst. Dynam., 12, 121–132, 2021130 K.-S. Yun et al.: Synchronized spatial shifts of Hadley and Walker circulations
models compared to the weak PSYN models (Fig. 5b and d). ric response associated with the strength-related WC–HC
These differences in anomalous precipitation and circulation modes (Figs. S10 and S11). Our analysis also highlights the
centers are statistically significant during boreal spring but fact that the analysis of phase relationships (Rosenblum and
not during boreal winter. We also emphasize that these dif- Pikovsky, 2003) between modes of climate variability can
ferences in precipitation are statistically insignificant for the reveal important new insights into their physical coupling
tropical regions, indicating that the extratropical precipita- mechanisms, which are less apparent in amplitude space (as
tion response is not primarily a result from an enhanced trop- described for instance by temporal correlation coefficients).
ical convective activity. Differences in model physics may
generate a strengthened WC–HC synchronization (i.e., NW-
SE skewed asymmetric circulation pattern changes), further Code and data availability. Observation data for this re-
intensifying the post-ENSO impact on extratropical precip- search are available at (1) the ECMWF website (https:
itation variability. This reflects the pronounced impact of //www.ecmwf.int/en/forecasts/dataset/ecmwf-reanalysis-interim;
WC–HC phase-synchronized spatial shifts on extratropical ERA-CLIM, 2021) for ERA-Interim reanalysis data, (2) NCDC
(https://www.ncdc.noaa.gov/data-access/marineocean-data/
precipitation variability, regardless of the ENSO amplitude.
extended-reconstructed-sea-surface-temperature-ersst-v5;
NOAA, 2021) for ERSST v5, (3) ESRL (https://www.esrl.
noaa.gov/psd/data/gridded/data.gpcp.html; Physical Sciences
4 Discussion and conclusion Laboratory, 2021) for GPCP v2.3 and (4) the CEDA website
https://crudata.uea.ac.uk/cru/data/hrg/cru_ts_4.03/ (University of
Focusing on the zonal and meridional displacements of East Anglia CRU, 2021) for CRU TS4.03. The model data for both
two major atmospheric circulation cells, using observational AMIP and CMIP are also available at a publicly accessible ESGF
datasets and the AMIP MME simulations, we examined the CMIP5 website (https://esgf-node.llnl.gov/search/cmip5/) and
intricate coupling between the WC and HC. In addition to a CMIP6 website (https://esgf-node.llnl.gov/search/cmip6/) (ESGF,
well-known ENSO-driven coupling of WC and HC variabil- 2021).
ity amplitude, our study shows that these two circulations can
also shift their positions in a synchronized manner, albeit in
a more subtle manner. Figure 6 illustrates the important dif- Supplement. The supplement related to this article is available
online at: https://doi.org/10.5194/esd-12-121-2021-supplement.
ference between the strength modes (WC1&HC2) and the
shift modes (WC2&HC1). The ENSO-driven strength mode
in its winter maximum is characterized by an equatorially
Author contributions. AT and KSY designed the study. KSY
symmetric Pacific cell pattern between western Pacific diver- wrote the initial paper draft and produced all figures. KSY, AT and
gence and central Pacific convergence, leading to weakening MFS contributed to the interpretation of the results and to the im-
WC and strengthening HC strengths (Fig. 6a). In contrast, provement of the paper.
our analysis revealed that the seasonally evolving spring-
time warm-pool SSTs in combination with post-peak-phase
El Niño SST anomalies can produce a meridionally asym- Competing interests. The authors declare that they have no con-
metric WC and anomalous cross-equatorial flow (from off- flict of interest.
equatorial WNP divergence zone toward the off-equatorial
southern Ocean of central Pacific and Indian Ocean con-
vergence zone), thus connecting the zonal WC and merid- Acknowledgements. This study was supported by the Institute
ional HC (Fig. 6b). This feature is reminiscent of the atmo- for Basic Science (project code IBS-R028-D1). This is IPRC publi-
spheric ENSO combination mode. Coherent WC–HC shifts cation 1496 and SOEST contribution 11219.
have pronounced influences on precipitation, as well as wind
and sea level patterns in both tropical and extratropical re-
gions. Financial support. This research has been supported by the Insti-
An important finding of our study is that the phase syn- tute for Basic Science (grant no. IBS-R028-D1).
chronization is only present for extreme El Niño events and
not for La Niña, indicating an important nonlinearity of the
Review statement. This paper was edited by Ben Kravitz and re-
tropical climate system. In addition, potential asymmetric
viewed by two anonymous referees.
heat capacitor effects of both the Indian and Atlantic oceans,
which tend to be more pronounced during El Niño com-
pared to La Niña (Ohba and Watanabe, 2012; An and Kim, References
2018) may further affect the phase synchronization proper-
ties discussed here. We found that the meridionally asym- Adler, R. F., Huffman, G. J., Chang, A., Ferraro, R., Xie,
metric response for phase synchronization of the WC–HC P. P., Janowiak, J., Rudolf, B., Schneider, U., Curtis, S.,
shift mode is quite different from the meridionally symmet- Bolvin, D., Gruber, A., Susskind, J., Arkin, P., and Nelkin,
Earth Syst. Dynam., 12, 121–132, 2021 https://doi.org/10.5194/esd-12-121-2021K.-S. Yun et al.: Synchronized spatial shifts of Hadley and Walker circulations 131 E.: The version-2 global precipitation climatology project Harris, I., Jones, P. D., Osborn, T. J., and Lister, D. H.: Up- (GPCP) monthly precipitation analysis (1979-present), J. dated high-resolution grids of monthly climatic observations Hydrometeorol., 4, 1147–1167, https://doi.org/10.1175/1525- - the CRU TS3.10 Dataset, Int. J. Climatol., 34, 623–642, 7541(2003)0042.0.Co;2, 2003. https://doi.org/10.1002/joc.3711, 2014. An, S.-I. and Kim, J.-W.: ENSO Transition Asymmetry: Internal Karnauskas, K. B. and Ummenhofer, C. C.: On the dynamics of and External Causes and Intermodel Diversity, Geophys. Res. the Hadley circulation and subtropical drying, Clim. Dyn., 42, Lett., 45, 5095–5104, https://doi.org/10.1029/2018gl078476, 2259–2269, https://doi.org/10.1007/s00382-014-2129-1, 2014. 2018. Klein, S. A., Soden, B. J., and Lau, N.-C.: Remote Sea Bayr, T., Dommenget, D., Martin, T., and Power, S. B.: The east- Surface Temperature Variations during ENSO: Ev- ward shift of the Walker Circulation in response to global warm- idence for a Tropical Atmospheric Bridge, J. Cli- ing and its relationship to ENSO variability, Clim. Dyn., 43, mate, 12, 917–932, https://doi.org/10.1175/1520- 2747–2763, https://doi.org/10.1007/s00382-014-2091-y, 2014. 0442(1999)0122.0.Co;2, 1999. Bollasina, M. A., Ming, Y., and Ramaswamy, V.: An- Kumar, K. K., Rajagopalan, B., and Cane, M. A.: On the weakening thropogenic Aerosols and the Weakening of the South relationship between the Indian monsoon and ENSO, Science, Asian Summer Monsoon, Science, 334, 502–505, 284, 2156–2159, https://doi.org/10.1126/science.284.5423.2156, https://doi.org/10.1126/science.1204994, 2011. 1999. Clarke, A. J. and Lebedev, A.: Long-term changes Lau, W. K. and Kim, K. M.: Robust Hadley Circulation changes in the equatorial Pacific trade winds, J. Cli- and increasing global dryness due to CO2 warming from CMIP5 mate, 9, 1020–1029, https://doi.org/10.1175/1520- model projections, P. Natl. Acad. Sci. USA, 112, 3630–3635, 0442(1996)0092.0.Co;2, 1996. https://doi.org/10.1073/pnas.1418682112, 2015. Dai, A. G.: Drought under global warming: a review, Wires Clim. Liu, B. and Zhou, T. J.: Atmospheric footprint of the Change, 2, 45–65, https://doi.org/10.1002/wcc.81, 2011. recent warming slowdown, Sci. Rep.-UK, 7, 40947, Dee, D. P., Uppala, S. M., Simmons, A. J., Berrisford, P., Poli, https://doi.org/10.1038/srep40947, 2017. P., Kobayashi, S., Andrae, U., Balmaseda, M. A., Balsamo, G., Ma, J. and Li, J. P.: The principal modes of variability of the Bauer, P., Bechtold, P., Beljaars, A. C. M., van de Berg, L., Bid- boreal winter Hadley cell, Geophys. Res. Lett., 35, L01808, lot, J., Bormann, N., Delsol, C., Dragani, R., Fuentes, M., Geer, https://doi.org/10.1029/2007gl031883, 2008. A. J., Haimberger, L., Healy, S. B., Hersbach, H., Hólm, E. V., Ma, J., Chadwick, R., Seo, K. H., Dong, C. M., Huang, G., Isaksen, L., Kållberg, P., Köhler, M., Matricardi, M., McNally, Foltz, G. R., and Jiang, J. H.: Responses of the Tropical Atmo- A. P., Monge-Sanz, B. M., Morcrette, J. J., Park, B. K., Peubey, spheric Circulation to Climate Change and Connection to the C., de Rosnay, P., Tavolato, C., Thépaut, J. N., and Vitart, F.: The Hydrological Cycle, Annu. Rev. Earth. Pl. Sc., 46, 549–580, ERA-Interim reanalysis: configuration and performance of the https://doi.org/10.1146/annurev-earth-082517-010102, 2018. data assimilation system, Q. J. Roy. Meteorol. Soc., 137, 553- Ma, S. and Zhou, T.: Robust Strengthening and Westward Shift 0597, https://doi.org/10.1002/qj.828, 2011. of the Tropical Pacific Walker Circulation during 1979–2012: A England, M. H., McGregor, S., Spence, P., Meehl, G. A., Comparison of 7 Sets of Reanalysis Data and 26 CMIP5 Mod- Timmermann, A., Cai, W., Gupta, A. S., McPhaden, M. els, J. Climate, 29, 3097–3118, https://doi.org/10.1175/jcli-d-15- J., Purich, A., and Santoso, A.: Recent intensification 0398.1, 2016. of wind-driven circulation in the Pacific and the on- McGregor, S., Timmermann, A., Schneider, N., Stuecker, M. F., going warming hiatus, Nat. Clim. Change, 4, 222–227, and England, M. H.: The Effect of the South Pacific Conver- https://doi.org/10.1038/nclimate2106, 2014. gence Zone on the Termination of El Niño Events and the ERA-CLIM: ECMWF reanalysis – Interim data, avail- Meridional Asymmetry of ENSO, J. Climate, 25, 5566–5586, able at: https://www.ecmwf.int/en/forecasts/dataset/ https://doi.org/10.1175/jcli-d-11-00332.1, 2012. ecmwf-reanalysis-interim, last access: 26 January 2021. McGregor, S., Ramesh, N., Spence, P., England, M. H., McPhaden, ESGF: WCRP Coupled Model Intercomparison Project, available M. J., and Santoso, A.: Meridional movement of wind anomalies at: https://esgf-node.llnl.gov/search/cmip5 for CMIP5, https:// during ENSO events and their role in event termination, Geo- esgf-node.llnl.gov/search/cmip6 for CMIP6, last access: 26 Jan- phys. Res. Lett., 40, 749–754, https://doi.org/10.1002/grl.50136, uary 2021. 2013. Eyring, V., Bony, S., Meehl, G. A., Senior, C. A., Stevens, B., McGregor, S., Timmermann, A., Stuecker, M. F., England, M. Stouffer, R. J., and Taylor, K. E.: Overview of the Coupled H., Merrifield, M., Jin, F.-F., and Chikamoto, Y.: Recent Model Intercomparison Project Phase 6 (CMIP6) experimen- Walker circulation strengthening and Pacific cooling ampli- tal design and organization, Geosci. Model Dev., 9, 1937–1958, fied by Atlantic warming, Nat. Clim. Change, 4, 888–892, https://doi.org/10.5194/gmd-9-1937-2016, 2016. https://doi.org/10.1038/nclimate2330, 2014. Garcia-Herrera, R., Diaz, J., Trigo, R. M., Luterbacher, J., Minobe, S.: Year-to-Year Variability in the Hadley and Walker Cir- and Fischer, E. M.: A Review of the European Summer culations from NCEP/NCAR Reanalysis Data, in: The Hadley Heat Wave of 2003, Crit. Rev. Env. Sci. Tec., 40, 267–306, Circulation: Present, Past and Future, edited by: Diaz, H. F. and https://doi.org/10.1080/10643380802238137, 2010. Bradley, R. S., Springer, Dordrecht, 153–171, 2004. Guo, Y. P. and Tan, Z. M.: Relationship between El Nino-Southern Mitas, C. M. and Clement, A.: Has the Hadley cell been strength- Oscillation and the Symmetry of the Hadley Circulation: Role ening in recent decades?, Geophys. Res. Lett., 32, L030809, of the Sea Surface Temperature Annual Cycle, J. Climate, 31, https://doi.org/10.1029/2004gl021765, 2005. 5319–5332, https://doi.org/10.1175/Jcli-D-17-0788.1, 2018. https://doi.org/10.5194/esd-12-121-2021 Earth Syst. Dynam., 12, 121–132, 2021
132                                                K.-S. Yun et al.: Synchronized spatial shifts of Hadley and Walker circulations

NOAA:        Extended      Reconstructed     Sea     Surface     Tem-   Stuecker, M. F., Jin, F.-F., Timmermann, A., and McGregor, S.:
   perature (ERSST), version 5, available at: https:                       Combination Mode Dynamics of the Anomalous Northwest Pa-
   //www.ncdc.noaa.gov/data-access/marineocean-data/                       cific Anticyclone, J. Climate, 28, 1093-1111, 10.1175/jcli-d-14-
   extended-reconstructed-sea-surface-temperature-ersst-v5,                00225.1, 2015.
   last access: 26 January 2021.                                        Tanaka, H. L., Ishizaki, N., and Nohara, D.: Intercomparison of
Ohba, M. and Watanabe, M.: Role of the Indo-Pacific Interbasin             the Intensities and Trends of Hadley, Walker and Monsoon Cir-
   Coupling in Predicting Asymmetric ENSO Transition and Du-               culations in the Global Warming Projections, Sola, 1, 77–80,
   ration, J. Climate, 25, 3321–3335, https://doi.org/10.1175/jcli-d-      https://doi.org/10.2151/sola.2005.021, 2005.
   11-00409.1, 2012.                                                    Tass, P., Rosenblum, M. G., Weule, J., Kurths, J., Pikovsky,
Oort, A. H. and Yienger, J. J.: Observed interannual vari-                 A., Volkmann, J., Schnitzler, A., and Freund, H. J.: Detec-
   ability in the Hadley circulation and its connection to                 tion of n : m phase locking from noisy data: Application
   ENSO, J. Climate, 9, 2751–2767, https://doi.org/10.1175/1520-           to magnetoencephalography, Phys. Rev. Lett., 81, 3291–3294,
   0442(1996)0092.0.Co;2, 1996.                               https://doi.org/10.1103/PhysRevLett.81.3291, 1998.
Physical Sciences Laboratory: GPCP version 2.3 Combined Precip-         Taylor, K. E., Stouffer, R. J., and Meehl, G. A.: An Overview of
   itation Data Set, available at: https://psl.noaa.gov/data/gridded/      Cmip5 and the Experiment Design, B. Am. Meteorol. Soc., 93,
   data.gpcp.html, last access: 26 January 2021.                           485–498, https://doi.org/10.1175/Bams-D-11-00094.1, 2012.
Pikovsky, A., Rosenblum, M., and Kurths, J.: Phase synchronization      Timmermann, A., McGregor, S., and Jin, F. F.: Wind Ef-
   in regular and chaotic systems, Int. J. Bifurcat. Chaos, 10, 2291–      fects on Past and Future Regional Sea Level Trends
   2305, https://doi.org/10.1142/s0218127400001481, 2000.                  in the Southern Indo-Pacific, J. Climate, 23, 4429–4437,
Rosenblum, M.: Synchronization analysis of bivariate time series           https://doi.org/10.1175/2010jcli3519.1, 2010.
   and its application to medical data, in: Medical Data Analysis,      University of East Anglia Climatic Research Unit: Har-
   Proceedings, edited by: Brause, R. W. and Hanisch, E., Lect.            ris, I. C. and Jones, P. D., CRU Time-Series (TS) ver-
   Notes Comput. Sc., 1933, 15–16, 2000.                                   sion 4.03 of high-resolution gridded data of month-
Rosenblum,        M.     and   Pikovsky,      A.:    Synchronization:      by-month variation in climate (Jan. 1901–Dec. 2018),
   from pendulum clocks to chaotic lasers and chem-                        https://doi.org/10.5285/10d3e3640f004c578403419aac167d82,
   ical     oscillators,    Contemp.      Phys.,     44,    401–416,       2021.
   https://doi.org/10.1080/00107510310001603129, 2003.                  Vecchi, G. A. and Soden, B. J.: Global Warming and the Weak-
Rosenblum, M. G., Kurths, J., Pikovsky, A., Schafer, C., Tass, P.,         ening of the Tropical Circulation, J. Climate, 20, 4316–4340,
   and Abel, H. H.: Synchronization in noisy systems and car-              https://doi.org/10.1175/jcli4258.1, 2007.
   diorespiratory interaction, IEEE Eng. Med. Biol., 17, 46–53,         Wu, L., Zhang, H. J., Chen, J. M., and Feng, T.: Impact of Two
   https://doi.org/10.1109/51.731320, 1998.                                Types of El Nino on Tropical Cyclones over the Western North
Smith, T. M., Reynolds, R. W., Peterson, T. C., and Lawrimore,             Pacific: Sensitivity to Location and Intensity of Pacific Warm-
   J.: Improvements to NOAA’s Historical Merged Land–Ocean                 ing, J. Climate, 31, 1725–1742, https://doi.org/10.1175/Jcli-D-
   Surface Temperature Analysis (1880–2006), J. Clim., 21, 2283–           17-0298.1, 2018.
   2296, https://doi.org/10.1175/2007jcli2100.1, 2008.                  Yu, B. and Zwiers, F. W.: Changes in equatorial atmospheric zonal
Sohn, B. J., Yeh, S.-W., Schmetz, J., and Song, H.-J.: Obser-              circulations in recent decades, Geophys. Res. Lett., 37, L05701,
   vational evidences of Walker circulation change over the last           https://doi.org/10.1029/2009gl042071, 2010.
   30 years contrasting with GCM results, Clim. Dyn., 40, 1721–         Zhang, W., Jin, F.-F., Stuecker, M. F., Wittenberg, A. T., Timmer-
   1732, https://doi.org/10.1007/s00382-012-1484-z, 2013.                  mann, A., Ren, H.-L., Kug, J.-S., Cai, W., and Cane, M.: Unrav-
Stein, K., Timmermann, A., Schneider, N., Jin, F.-F., and Stuecker,        eling El Niño’s impact on the East Asian Monsoon and Yangtze
   M. F.: ENSO Seasonal Synchronization Theory, J. Climate, 27,            River summer flooding, Geophys. Res. Lett., 43, 11375–11382,
   5285–5310, https://doi.org/10.1175/jcli-d-13-00525.1, 2014.             https://doi.org/10.1002/2016gl071190, 2016.
Stuecker, M. F., Timmermann, A., Jin, F.-F., McGregor, S., and
   Ren, H.-L.: A combination mode of the annual cycle and
   the El Niño/Southern Oscillation, Nat. Geosci., 6, 540–544,
   https://doi.org/10.1038/ngeo1826, 2013.

Earth Syst. Dynam., 12, 121–132, 2021                                                       https://doi.org/10.5194/esd-12-121-2021
You can also read