The role of FoxP3+ regulatory T cells and IDO+ immune and tumor cells in malignant melanoma - an immunohistochemical study
←
→
Page content transcription
If your browser does not render page correctly, please read the page content below
Salmi et al. BMC Cancer     (2021) 21:641
https://doi.org/10.1186/s12885-021-08385-4

 RESEARCH ARTICLE                                                                                                                                     Open Access

The role of FoxP3+ regulatory T cells and
IDO+ immune and tumor cells in malignant
melanoma – an immunohistochemical
study
Satu Salmi1* , Anton Lin1, Benjamin Hirschovits-Gerz1, Mari Valkonen1, Niina Aaltonen1, Reijo Sironen2,3,
Hanna Siiskonen4 and Sanna Pasonen-Seppänen1

  Abstract
  Background: FoxP3+ Regulatory T cells (Tregs) and indoleamine-2,3-dioxygenase (IDO) participate in the formation
  of an immunosuppressive tumor microenvironment (TME) in malignant cutaneous melanoma (CM). Recent studies
  have reported that IDO expression correlates with poor prognosis and greater Breslow’s depth, but results concerning
  the role of FoxP3+ Tregs in CM have been controversial. Furthermore, the correlation between IDO and Tregs has not
  been substantially studied in CM, although IDO is known to be an important regulator of Tregs activity.
  Methods: We investigated the associations of FoxP3+ Tregs, IDO+ tumor cells and IDO+ stromal immune cells with
  tumor stage, prognostic factors and survival in CM. FoxP3 and IDO were immunohistochemically stained from 29
  benign and 29 dysplastic nevi, 18 in situ -melanomas, 48 superficial and 62 deep melanomas and 67 lymph node
  metastases (LNMs) of CM. The number of FoxP3+ Tregs and IDO+ stromal immune cells, and the coverage and
  intensity of IDO+ tumor cells were analysed.
  Results: The number of FoxP3+ Tregs and IDO+ stromal immune cells were significantly higher in malignant
  melanomas compared with benign lesions. The increased expression of IDO in melanoma cells was associated with
  poor prognostic factors, such as recurrence, nodular growth pattern and increased mitotic count. Furthermore, the
  expression of IDO in melanoma cells was associated with reduced recurrence˗free survival. We further showed that
  there was a positive correlation between IDO+ tumor cells and FoxP3+ Tregs.
  Conclusions: These results indicate that IDO is strongly involved in melanoma progression. FoxP3+ Tregs also seems
  to contribute to the immunosuppressive TME in CM, but their significance in melanoma progression remains unclear.
  The positive association of FoxP3+ Tregs with IDO+ melanoma cells, but not with IDO+ stromal immune cells, indicates a
  complex interaction between IDO and Tregs in CM, which demands further studies.
  Keywords: Melanoma, TME, Immunosuppression, Regulatory T cells, FoxP3, IDO

* Correspondence: satu.salmi@uef.fi
1
 Institute of Biomedicine, University of Eastern Finland, P.O. Box 1627 70211,
Kuopio campus, Kuopio, Finland
Full list of author information is available at the end of the article

                                          © The Author(s). 2021 Open Access This article is licensed under a Creative Commons Attribution 4.0 International License,
                                          which permits use, sharing, adaptation, distribution and reproduction in any medium or format, as long as you give
                                          appropriate credit to the original author(s) and the source, provide a link to the Creative Commons licence, and indicate if
                                          changes were made. The images or other third party material in this article are included in the article's Creative Commons
                                          licence, unless indicated otherwise in a credit line to the material. If material is not included in the article's Creative Commons
                                          licence and your intended use is not permitted by statutory regulation or exceeds the permitted use, you will need to obtain
                                          permission directly from the copyright holder. To view a copy of this licence, visit http://creativecommons.org/licenses/by/4.0/.
                                          The Creative Commons Public Domain Dedication waiver (http://creativecommons.org/publicdomain/zero/1.0/) applies to the
                                          data made available in this article, unless otherwise stated in a credit line to the data.
Salmi et al. BMC Cancer   (2021) 21:641                                                                         Page 2 of 13

Background                                                      immunosuppressive effects and tumor progression [6].
The incidence of malignant cutaneous melanoma (CM)              In TME, IDO-expressing cells include DCs, macro-
has been increasing rapidly for the past decade, and the        phages, MDSCs [6] and some cancer cells, including gas-
increase is estimated to continue [1]. Although CM is a         tric, colon and renal cell carcinomas [7].
highly immunogenic cancer, it can evade the immune                Tregs and IDO are known to be part of the immuno-
system by forming an immunosuppressive tumor micro-             suppressive TME in melanoma [2]. However, there are
environment (TME). An understanding of the role of              controversial results regarding the association between
immune escape has led to novel immunotherapies to               FoxP3+ Tregs and tumor stage and survival in CM.
treat the metastatic disease [2]. Immune evasion results        Most studies have showed that high amounts of IDO+
from several factors that weaken the effect of melanoma-        stromal immune cells and IDO+ melanoma cells associ-
specific effector T cells. These factors include anti-          ate with a poor prognosis in CM. However, the correl-
inflammatory cytokines, such as IL-10, defects in antigen       ation between IDO and FoxP3+ Tregs has not been
presentation of melanoma cells and expression of immune         thoroughly studied, even though it is known that IDO is
checkpoint molecules, such as PD-L1 and CTLA-4.                 an important regulator of Tregs activity [8].
Furthermore, tumor immunosuppression results from the             In the present study, we investigated the associations
presence of immunosuppressive cells, such as tumor-             of FoxP3+ Tregs and IDO+ stromal immune and tumor
associated macrophages (TAMs) and regulatory T cells            cells with prognostic factors and survival in CM. In
(Tregs), as well as cells that express amino-acid cataboliz-    addition, the correlation between FoxP3+ Tregs and
ing enzymes like indoleamine-2,3-dioxygenase (IDO) [3].         IDO+ stromal immune and IDO+ tumor cells was ex-
  Regulatory T cells (Tregs) are a highly immunosup-            amined. Our objective was to enhance our understand-
pressive subpopulation of CD4+ T cells expressing Fork-         ing of the role and interrelationship of these important
head box P3-transcription factor (FoxP3). Tregs help to         immunosuppressive factors of the TME in melanoma
maintain self-tolerance and immune homeostasis in               progression. Our results show that the number of
healthy individuals and they play a crucial role in pre-        FoxP3+ Tregs and IDO+ stromal immune cells is signifi-
venting autoimmune responses. In cancer, Tregs silence          cantly higher in malignant lesions, compared with be-
the anti-tumor immune effect and thus promote tumor             nign nevi. Increased numbers of IDO-expressing tumor
growth by suppressing the proliferation and cytokine se-        cells was associated with poor prognostic factors. Our
cretion of effector T lymphocytes. Tregs act by secreting       data also shows a positive correlation between IDO+
inhibitory cytokines, such as IL-10 and TGF-β, express-         tumor cells and FoxP3+ Tregs, but the number of
ing immune checkpoint molecule CTLA-4, degrading                FoxP3+ Tregs was not associated with tumor stage or
ATP, destroying effector T cells through direct cytotox-        survival.
icity by secretion of granzyme and perforin, and inhibit-
ing effector T cell differentiation by consuming IL-2,
through expression of CD25 [4].                                 Methods
  Indoleamine-2,3-dioxygenase (IDO) is a cytosolic              Histological specimens
enzyme that catalyses the first and rate-limiting step of       This retrospective study consists of 29 benign nevi (5
tryptophan catabolism by converting tryptophan to               junctional nevi, 14 intradermal nevi, 10 composite nevi),
kynurenine. Tryptophan depletion is an immunomodu-              29 dysplastic nevi, 18 in situ melanomas, 48 superficial
latory process because, the decrease in tryptophan in-          melanomas (Breslow depth < 1 mm), 62 deep melanomas
hibits effector T cell proliferation and activates apoptosis    (Breslow depth > 4 mm) and 67 lymph node metastases.
in effector T cells, and an increase in kynurenine and its      The samples were histopathologically diagnosed between
downstream metabolites promote Treg differentiation             the years 1980 and 2010 in Kuopio University Hospital.
[5]. IDO has both immunogenic and immunosuppressive             Only pT1 and pT4 melanomas were included in the
effects, which are controlled by local factors such as IL-      study, as these tumors have clearly distinct prognosis.
6, IL-12, IL-10, IFN-γ, CTLA-4 and PD-1. These factors             From a total of 253 samples, 240 were stained for
modulate IDO expression and help to maintain immune             FoxP3 and 252 for IDO. Highly pigmented samples, as
homeostasis. In addition to effector T cell inhibition and      well as samples with destroyed tissue structure or large
Treg activation, the immunosuppressive effects of IDO           necrotic areas were omitted, yielding 183 representative
include natural killer cell (NK) inhibition, as well as acti-   samples for FoxP3 analysis and 193 for IDO analysis
vation of dendritic cells (DCs) and myeloid-derived sup-        (Table 1). Analysed samples including clinical data are
pressor cells (MDSCs). In the early elimination phase of        listed in Table 2. These sample sizes are sufficient to ob-
cancer progression, IDO is produced at low levels within        serve correlations or differences between groups. Out of
the TME and it inhibits tumor growth. In the immune             total of 101 samples with clinicopathological data, data
escape phase, IDO production is increased, leading to           were missing from 0 to 3 samples depending on variable.
Salmi et al. BMC Cancer    (2021) 21:641                                                                                  Page 3 of 13

Table 1 Numbers of FoxP3 and IDO stainings evaluated by                   Histopathological parameters for the samples were pro-
hotspot method                                                            vided by an expert pathologist (RS).
Sample sizes              FoxP3 stainings                IDO stainings
Benign nevi               25 (14%)                       26 (13%)         FoxP3 and IDO immunohistochemical stainings
Dysplastic nevi           27 (15%)                       13 (7%)          For immunohistochemical stainings, 4 μm thick tissue
                                                                          sections were immunostained separately for FoxP3 and
In situ melanoma          15 (8%)                        46 (24%)
                                                                          IDO. For FoxP3 stainings, after deparaffinization, the tis-
pT1                       36 (20%)                       35 (18%)
                                                                          sue sections were cooked in 10 mM citrate buffer (pH 6.0)
pT4                       39 (21%)                       49 (25%)         in a microwave oven twice for 5 min, and after cooling
pN1                       41 (22%)                       46 (24%)         they were washed with 0.05 M phosphate buffered saline
Total                     183 (100%)                     193 (100%)       (PBS; pH 7.0). The endogenous peroxidase activity was
                                                                          blocked with 5% H2O2 for 5 min. Thereafter, the sections
                                                                          were washed and incubated with 1.5% normal horse
                                                                          serum in PBS for 15 min in room temperature to block
                                                                          unspecific binding according to the Vectastain Elite ABC
                                                                          Kit (Vector Laboratories, Burlingame, California, USA).
Table 2 Clinicopathological parameters of the malignant cases
Variable                                   pT1                           pT4                     pN1                        Total
Number of cases                            31 (30.7%)                    36 (35.6%)              34 (33.7%)                 101 (100%)
Age
  Mean ± SD                                60.8 ± 11.8                   64.8 ± 16.2             51.71 ± 17.0               59.2 ± 16.1
  Range                                    35–81                         15–92                   5–83                       5–92
Sex
  Female                                   16 (15.8%)                    13 (12.9%)              15 (14.9%)                 44 (43.6%)
  Male                                     15 (14.9%)                    23 (22.8%)              19 (18.8%)                 57 (56.4%)
Breslow’s depth (mm)
  Mean ± SD                                0.68 ± 0.23                   8.52 ± 9.75                                        4.89 ± 8.12
  Range                                    0.29–1.00                     4.00–60.00                                         0.29–60.00
Relapse
  Yes                                      4 (4.0%)                      20 (19.8%)              30 (29.7%)                 54 (53.5%)
  No                                       26 (25.7%)                    14 (13.9%)              1 (1.0%)                   41 (40.6%)
  Spread at diagnosis                      0 (0.0%)                      1 (1.0%)                3 (3.0%)                   4 (40.6%)
  Missing                                  1 (1.0%)                      1 (1.0%)                0 (0.0%)                   2 (2.0%)
Anatomic site of primary melanoma
  Head and neck                            9 (8.9%)                      9 (8.9%)                6 (5.9%)                   24 (23.7%)
  Trunk                                    4 (4.0%)                      4 (4.0%)                4 (4.0%)                   12 (11.9%)
  Back                                     7 (6.9%)                      11 (10.9%)              8 (7.9%)                   26 (25.7%)
  Upper limbs                              7 (6.9%)                      3 (3.0%)                2 (2.0%)                   12 (11.9%)
  Lower limbs                              4 (4.0%)                      3 (3.0%)                10 (9.9%)                  17 (16.8%)
  Feet                                     0 (0.0%)                      3 (3.0%)                1 (1.0%)                   4 (4.0%)
  Hands                                    0 (0.0%)                      0 (0.0%)                0 (0.0%)                   0 (0.0%)
  Fingers or toes                          0 (0.0%)                      3 (3.0%)                0 (0.0%)                   3 (3.0%)
  Not found                                0 (0.0%)                      0 (0.0%)                3 (3.0%)                   3 (3.0%)
Cause of death
  Malignant melanoma                       1 (1.0%)                      19 (18.8%)              26 (25.7%)                 46 (45.5%)
  Other                                    7 (6.9%)                      8 (7.9%)                0 (0.0%)                   15 (14.8%)
  Alive                                    19 (18.8%)                    3 (3.0%)                5 (5.0%)                   27 (26.7%)
  Unknown                                  4 (4.0%)                      6 (5.9%)                3 (3.0%)                   13 (12.9%)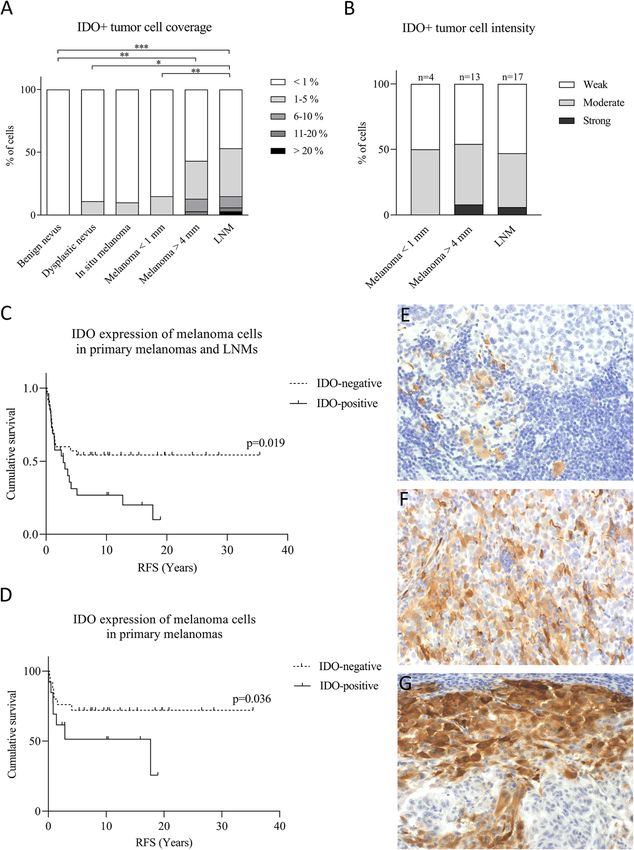
Salmi et al. BMC Cancer   (2021) 21:641                                                                       Page 4 of 13

After blocking, the sections were incubated at 4 °C          antibodies (1:400, Texas Red anti-rabbit IgG, Vector and
overnight with the primary antibody (1:100, mouse            1:200, Fluorescein-anti rabbit, Vector). Nuclei were la-
monoclonal anti-Foxp3 antibody, Abcam, Cambridge,            belled with DAPI (1 μg/ml, Sigma-Aldrich). The sections
UK), followed by incubation with 0.5% biotinylated sec-      were mounted in Vectashield (Vector H-1000, Vector)
ondary antibody (1:100, anti-mouse, Vector Laborator-        and the samples were viewed and imaged with a Zeiss
ies) for 30 min at room temperature. The bound               Axio Observer inverted microscope (20 x or 40 x NA 1.3
antibody was visualised by using the Vectastain Elite        oil objectives) equipped with a Zeiss LSM 700 confocal
ABC kit (Vector Laboratories, Burlingame, California,        module (Carl Zeiss Microimaging GmbH, Jena, Germany).
USA). The colour was developed with 0.05% 3,3′-di-
aminobenzidine (DAB) containing 0.8% NiCl and 3%             Evaluation of Foxp3+ regulatory T cells
H2O2 in PBS. Mouse IgG was used as a negative control        FoxP3+ Tregs were evaluated with the hot spot analysis
and tonsil tissue served as a positive control. A coun-      [9–11]. The areas of the highest FoxP3+ cell density (hot
terstain was omitted, because non-specific background        spots) were located by scanning each tissue section at
staining from the primary immunohistochemical stain          low (× 50–100) magnification with a Zeiss Axio Lab.A1
was observed to provide adequate anatomical and              (Carl Zeiss, Germany) light microscope, and then either
histological reference to accurately determine the loca-     three or five representative areas (depending on the
tion of the tumor. Finally, the sections were washed,        lesion size) were selected and imaged at × 200 magnifi-
dehydrated, and mounted in DePex.                            cation. Tumor cells were present in each picture to
  For IDO stainings, before deparaffinization, the sec-      ensure proximity to the lesion.
tions were cooked at 58 °C for 30 min. Then, after depar-      All images were captured using a Zeiss AxioCam ERc
affinization, the tissue sections were cooked in 10 mM       5S microscope-mounted camera (Carl Zeiss, Germany).
citrate buffer (pH 6.0) in a pressure cooker for 15 min,     The images were captured at a resolution of 2560 × 1920
and after cooling at room temperature, they were             px with a resulting physical pixel size of 0.11 μm/px.
washed with 0.1 M phosphate buffer (PB; pH 7.0). There-      From the images, the number of FoxP3+ regulatory T
after, the endogenous peroxidase activity was blocked        cells was evaluated using automatic digital image ana-
with 1% H2O2 for 5 min. The sections were then washed        lysis (Additional file 1). The results of the automated
and incubated with 1% milk powder in PBS for 30 min          analysis were verified by two researchers (SS, AL) who
at 37 °C to block unspecific binding. The sections were      independently counted the positive cells manually from
incubated in the primary antibody (1:100, rabbit mono-       75 randomly chosen samples, so that 25 of these samples
clonal anti-IDO antibody, Cell Signalling, Danvers, MA,      were analysed by both investigators. The Pearson correl-
USA) at 4 °C overnight, followed by incubation with the      ation for the automated analysis method and manual
biotinylated secondary antibody (1:200, anti-rabbit, Vec-    counts were 0.96 and 0.89, and 0.96 between manual
tor Laboratories, Burlingame, CA, USA) for 1 h at room       counts. The adequacy of the cell selections completed by
temperature. The bound antibody was visualised with          the automatic digital image analysis software was also
the Vectastain Elite ABC kit similarly to FoxP3 stainings.   checked for each picture. The cell count was analysed
DAB was used as the chromogen to visualize the stain-        manually in cases where positive cells were significantly
ings, and the nuclei were counterstained with Mayer’s        over or under selected by the software (271 pictures;
hematoxylin. Negative controls were treated in the same      32% of all pictures).
way, but the primary antibodies were omitted. Tonsil tis-      FoxP3+ T cells were distinguished from other FoxP3-
sue was used as a positive control. Thereafter, the sec-     expressing cells by the cell size, morphology and staining
tions were washed, dehydrated, and mounted in DePex.         intensity. Cells were excluded if they were considered
                                                             too large, had an aspect ratio > 2.0 (ratio of major axis to
IDO + CD68, CD68 + CD11c and IDO + FoxP3                     minor axis), or if they touched the edges of the image.
immunofluorescence double stainings                          Only cells stained intensely enough to clearly stand out
Deparaffinized sections were cooked in 10 mM citrate         from the background were counted. These criteria were
buffer (pH 6.0) in a pressure cooker for 10 min, and they    used for manual counting as well as the automated
were washed after cooling with 0.1 M phosphate buffer        image analysis method.
(PB; pH 7.0). Thereafter, the sections were treated with
50 mM glycine for 20 min at room temperature to              Evaluation of IDO stainings
quench any autofluorescence. The sections were blocked       IDO-positivity was evaluated separately from stromal
with 1% bovine serum albumin for 30 min, followed by         immune cells and melanoma cells. IDO-positive stromal
an overnight incubation at 4 °C with the primary anti-       immune cells were counted using the hot spot –method,
bodies against IDO, CD68 and FoxP3. After washing, the       similar to FoxP3+ regulatory T cells (see the previous
sections were incubated for 1 h with the secondary           section), except that IDO+ stromal immune cell
Salmi et al. BMC Cancer (2021) 21:641 Page 5 of 13
counting in the microscopic images was only done tumors more than 1% (categories 1–4) IDO+ melanoma
manually. IDO+ stromal immune cells were evaluated cells of all tumor cells. Similarly, IDO intensity in IDO-
based on the nuclear and cell morphology, excluding positive malignant tumors was divided into two groups
IDO+ tumor cells and IDO+ endothelial cells or fibro- (either low and moderate or strong) by combining the
blasts from the analyses. IDO+ stromal immune cells intensity categories 2 and 3. The higher categories were
were analysed independently by two researchers (SS, fused because of small sample sizes. P values equal to or
BHG), the Pearson correlation coefficient between the less than 0.050 were considered statistically significant.
two analyses was 0.88. Samples with significantly dis-
tinctive cell numbers were re-evaluated. Results
The percentage and staining intensity of IDO+ tumor Patient characteristics
cells were also evaluated from primary melanomas and Patient and clinicopathological characteristics are pre-
LNMs. The number of IDO-positive melanoma cells was sented in Table 2. The mean follow-up was 9.7 ± 8.9
assessed semi-quantitatively using a 5-level scoring sys- years (median 7.7 years).
tem from 0 to 4. Score 0 was given if the sample con-
tained less than 1% IDO-positive melanoma cells of all FoxP3+ Tregs and IDO+ stromal immune cells are more
tumor cells, score 1 if 1–5% of cancer cells were IDO- abundant in malignant melanoma compared with benign
positive, and scores 2 to 4 if IDO-positive cancer cells lesions
comprised 6–10%, 11–20% and over 20% of all cancer Melanoma specimens were stained for FoxP3 and IDO
cells, respectively. From those malignant cases that con- to examine the number and localization of FoxP3+
tained > 1% IDO+ tumor cells, the staining intensity of Tregs and IDO+ stromal immune cells. IDO+ stromal
IDO+ melanoma cells was also assessed semi- immune cells mainly accumulated in the areas with clear
quantitatively using a 3-level scoring system. Staining in- lymphocyte infiltration and thus resided mostly in the
tensity was scored 1 for weak, 2 for moderate and 3 for perilesional stroma, similar to FoxP3+ Tregs. However,
strong. The intensity score was determined by the pre- they were also found in intratumoral stroma in deep
dominant intensity deposit. IDO+ tumor cells were ana- melanomas and LNMs. The representative immunohis-
lysed independently by two investigators (SS, BHG). tochemical stainings of FoxP3 and IDO are presented in
Samples with a distinct index were re-evaluated by third Figs. 1 and 2. Part of the IDO+ stromal immune cells
investigator (SPS). IDO-positive tumor cells were not were CD68+ and CD11c + antigen presenting cells
evaluated from melanin-containing samples because (Fig. 3A-B). Double immunofluorescence staining
melanin would have interfered with the evaluation. showed that part of the CD68+ macrophages expressed
IDO (Fig. 3A-B), and these CD68+ IDO-expressing cells
Statistical analysis were also positive for the dendritic cell marker CD11c
Statistical analyses were conducted using IBM SPSS Sta- (white arrows in Fig. 3A-B). However, not all CD68+
tistics 25 (IBM Corporation, Armonk, New York, USA). macrophages were IDO positive (Fig. 3A, C), suggesting
A non-parametric Kruskal-Wallis test with pairwise that the main IDO expressing antigen presenting cells
comparisons was used to compare the different histo- are dendritic cells. The morphology of IDO+ stromal
logical groups, and a Pearson χ2-test was used to analyze immune cells also resembled the morphology of den-
the associations with clinicopathological parameters. A dritic cells with numerous cytoplasmic processes. The
Mann Whitney U-test was used to compare immune cell staining pattern for IDO was cytoplasmic, while the
counts between IDO-positive and IDO-negative tumors. transcription factor FoxP3 was localized to the cell nu-
A Kaplan-Meier with log-rank test, and a Cox’s regres- clei (Fig. 3D).
sion were used for univariate and multivariate survival The amount of FoxP3+ Tregs was significantly higher
analyses, respectively. For the χ2-test and survival evalu- in thin and deep melanomas and lymph node metastases
ations, the FoxP3+ Treg and IDO+ stromal immune cell of CM, compared with benign nevi (p-values < 0.0001)
counts, analyzed by hotspot analyses, were divided into (Fig. 4A). In line with FoxP3+ Treg counts, the IDO+
two groups (low or high) based on the median. Cell stromal immune cell count was also significantly higher
counts less than the median value represented low, and in malignant lesions, compared with benign nevi (p <
cell counts higher than the median represented high cell 0.0001) (Fig. 4B). The amount of the IDO+ stromal
numbers (median = 56.50 for FoxP3 + Tregs and 40.70 immune cells was higher in deep melanomas and
for IDO+ stromal cells). For χ2-tests and survival ana- LNMs, compared with dysplastic nevi (p-values 0.003
lyses, the coverage of IDO+ melanoma cells was divided and < 0.001, respectively), and in in situ melanomas,
into two groups (IDO-positive and IDO-negative tu- compared with benign nevi (p = 0.012). Interestingly,
mors), fusing categories 1–4. Thus, IDO-negative tumors IDO+ stromal immune cell numbers were also signifi-
contained less than 1% (category 0) and IDO-positive cantly higher in LNMs compared with thin melanomasSalmi et al. BMC Cancer (2021) 21:641 Page 6 of 13
Fig. 1 Representative immunohistochemical stainings of FoxP3+ Regulatory T cells (Tregs). Immunohistochemical stainings of FoxP3 in benign (a)
and dysplastic nevi (b), in situ melanoma (c), superficial (Breslow’s depth < 1 mm, d) and deep (Breslow’s depth > 4 mm, e) melanomas and lymph
node metastasis (f). The dashed line in a and b marks the epidermis in benign and dysplastic nevi, respectively, and the dashed line in c stands
for the tumor-stroma borderline in in situ melanoma. In in situ, thin and deep melanomas and LNMs (c-f), FoxP3+ Tregs are also found inside the
tumor cell nests. The asterisks in c-f indicates the stromal compartment of the tumor. Scale bar is 50 μm in a for a-c (× 200 magnification) and
100 μm in d for d-f (×100 magnification)
(p = 0.009). However, the correlation between FoxP3+ and LNMs, compared with benign nevi (p-values 0.006
Treg and IDO+ stromal immune cell counts was ra- and < 0.001, respectively) (Fig. 5A). Furthermore, IDO+
ther weak (Pearson’s r = 0.43, P < 0.001). tumor cells were more abundant in LNMs compared
with thin melanomas and dysplastic nevi (p-values 0.009
IDO expression in tumor cells is more abundant in and 0.014, respectively). There was no statistically sig-
malignant melanoma, compared with benign lesions nificant difference in IDO intensity between malignant
The coverage and intensity of IDO+ tumor cells was also tumors that contained IDO-expressing melanoma cells
analysed. The number of IDO+ tumor cells was low, but (Fig. 5B).
they most often localized in the invasive front in the
same area as the IDO+ stromal immune cells (Fig. 3D). Correlations of FoxP3+ Treg and IDO+ stromal immune
Moreover, IDO+ tumor cells formed IDO-positive islets cell numbers with clinicopathological parameters
inside the tumor nests. The staining pattern of IDO+ High IDO+ stromal immune cell count was associated
tumor cells was also cytoplasmic. The coverage of IDO+ with the presence of mitoses (p = 0.004, data not shown).
tumor cells was significantly higher in deep melanomas There were no associations of FoxP3+ Treg numbersSalmi et al. BMC Cancer (2021) 21:641 Page 7 of 13
Fig. 2 Representative immunohistochemical stainings of IDO. Immunohistochemical stainings of IDO in benign (a) and dysplastic nevi (b), in situ
melanoma (c), superficial (Breslow’s depth < 1 mm, d) and deep (Breslow’s depth > 4 mm, e) melanomas and lymph node metastasis (f). The
dashed line in c marks for the tumor-stroma borderline in in situ melanoma. IDO+ stromal immune cells were found both intratumorally and in
the peritumoral stroma. The asterisks in c-f indicates the stromal compartment of the tumor. Scale bar is 50 μm in a for a-c (× 200 magnification)
and 100 μm in d for d-f (× 100 magnification)
with any of the clinicopathological parameters (gender, 0.009) and distal (p = 0.040) recurrence (Table 3). How-
ulceration, nodular growth pattern, presence of mitoses ever, the presence of IDO+ melanoma cells was not asso-
or recurrence). ciated with recurrence when assessing primary tumors
only. In addition, moderate or high IDO expression inten-
Correlations of IDO expression and intensity of melanoma sity in melanoma cells of LNMs was associated with
cells with clinicopathological parameters lymph node capsule rupture (p = 0.014).
To study the association of IDO+ melanoma cell coverage In univariate survival analyses, IDO-positive tumors
with clinicopathological parameters and survival, samples were associated with poor recurrence-free survival (RFS),
were divided into two groups; IDO-negative and IDO- both in analyses conducted in all groups (pT1, pT4,
positive tumors, which represented samples that con- LNMs) (Fig. 5C) and primary melanomas only (Fig. 5D)
tained less than 1% or more than 1% IDO+ tumor cells of (p-values 0.019 and 0.036, and number on events 36 and
all melanoma cells, respectively. The presence of IDO+ 15, respectively). However, the significance was not ap-
melanoma cells was associated with a nodular growth pat- parent in multivariate analysis of survival, when the
tern (p = 0.050), the presence of mitoses (p = 0.047), over- histological group (pT1, pT4 and LNM) or Breslow’s
all recurrence (p = 0.014), as well as locoregional (p = depth was used as a covariate. There was no associationSalmi et al. BMC Cancer (2021) 21:641 Page 8 of 13
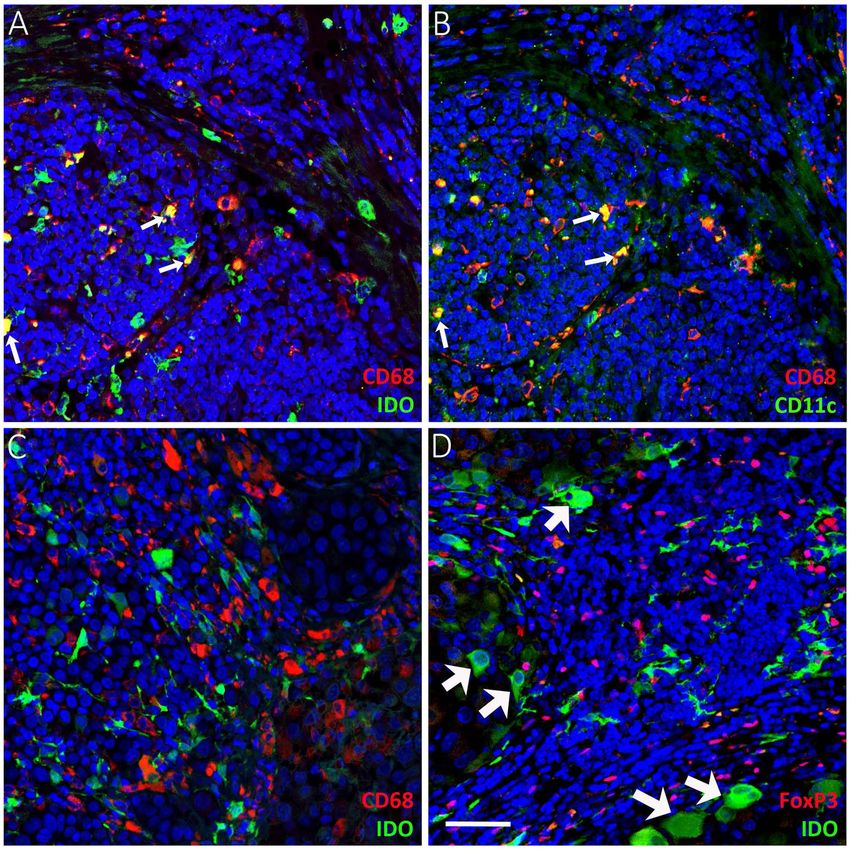
Fig. 3 Double immunofluorescence staining of CD68 + IDO, CD68 + CD11c and FoxP3 + IDO. Double stainings for CD68 + IDO (a) and CD68 +
CD11c (b) from serial sections show that part of the CD68+ antigen presenting cells express IDO (a, colocalization, yellow, white arrows) and
these same cells are also CD11c + (b, colocalization, yellow, white arrows). Most of the CD68+ cells do not express IDO (c), which suggest that the
main IDO-expressing antigen presenting cells are CD11c + dendritic cells. Double stainings for FoxP3 + IDO (d) shows the colocalization of Tregs
with IDO-expressing tumor cells (d, white arrows). a, b and d from lymph node metastases and c from superficial melanoma (pT1). Scale bar
50 μm (× 200 magnification)
of IDO expression in melanoma cells with overall or dis- Tregs and IDO. We show that high amounts of IDO-
ease specific survival, and IDO expression intensity did expressing melanoma cells correlate with poor prognos-
not correlate with survival either. tic factors and poor RFS in CM. Moreover, the number
of both FoxP3+ regulatory T cells and IDO+ stromal im-
IDO-positive tumors contained higher amounts of mune cells was shown to be more abundant in malig-
immune cell infiltrates than IDO-negative tumors nant melanomas, compared to benign lesions. We also
IDO-positive tumors contained significantly higher amounts analysed the tumor immune cell infiltrates in relation to
of FoxP3+ Tregs (p < 0.0001), IDO+ stromal immune cells IDO-expressing melanoma cells and found that IDO-
(p < 0.0001), and both CD68+ and CD163+ tumor associ- positive tumors contain significantly higher amounts of
ated macrophages (TAMs) (p-values < 0.0001), compared to FoxP3+ Tregs, IDO+ stromal immune cells, and both
IDO-negative tumors (data not shown). However, IDO+ CD68+ and CD163+ tumor associated macrophages
stromal immune cell or FoxP3+ Treg counts did not correl- (TAMs), compared with IDO-negative tumors. It has
ate with macrophage counts. been shown that an immunosuppressive TME is a driv-
ing factor for tumor growth and disease progression in
Discussion CM [12]. Our study of two immunosuppressive factors,
In the present study, our aim was to gain more informa- FoxP3+ Tregs and IDO, support this notion. In particu-
tion on the role and interactions of two important im- lar, IDO expression in the melanoma cells seem to play
munosuppressive factors of the TME of CM, FoxP3+ an important role in melanoma progression, and ourSalmi et al. BMC Cancer (2021) 21:641 Page 9 of 13 Fig. 4 Mean counts of FoxP3+ Tregs (a) and IDO+ stromal immune cells (b) analyzed by hotspot analysis. FoxP3+ Tregs were analysed from 183, and IDO+ stromal immune cells from 193 melanocytic samples. The data represents mean ± SD. Statistically significant differences between the groups are shown in brackets (Kruskal-Wallis test). *P < 0.05, **P < 0.01, ***P < 0.001 results also suggest that FoxP3+ Tregs and IDO+ im- also indicated that high amounts of FoxP3+ Tregs was mune stromal cells enhance tumorigenesis in CM. associated with better prognosis in CM [20]. Tjin et al. Our results support earlier reports on the association of evaluated several immune escape markers and immuno- IDO+ stromal immune and tumor cells with poor progno- suppressive cells in stage IV melanomas; they reported sis in CM. For example, Rubel et al. found that high very low expression of Foxp3+ in tumor-infiltrating im- amounts of both IDO+ melanoma and stromal cells cor- mune cells, which suggested a minor role for Tregs in relate with poor progression-free survival (PFS), and high stage IV melanomas [21]. Our study also indicates that amounts of IDO+ melanoma cells were also positively as- FoxP3+ Tregs are not as strongly involved in CM sociated with Breslow’s depth [13]. In another study, tumorigenesis as IDO+ cells. We found that malignant abundance of IDO-expressing melanoma cells in LNMs of melanocytic lesions contained higher amounts of CM was associated with poor OS [14]. Similarly, our re- FoxP3+ Tregs compared with benign nevi, but FoxP3+ sults indicate that IDO expression in both stromal im- Tregs was not associated with clinicopathological pa- mune cells and tumor cells promote tumorigenesis in rameters, tumor stage or survival. CM, as the number of both IDO+ stromal immune cells Discrepancies between studies in the the role of and IDO+ tumor cells was significantly higher in malig- FoxP3 + Tregs in CM may be partly due to the different nant compared with benign lesions. In addition, overex- study materials and/or cell counting methods used. Fur- pression of IDO in melanoma cells was associated with thermore, FoxP3 is not expressed exclusively by Tregs; poor prognostic factors and recurrence. Importantly, IDO indeed, some conventional CD4+ T cells with no im- has already been studied as a target of immunomodulatory munosuppressive properties also express FoxP3, as well treatments in CM. Preliminary results from clinical trials as some CD8+ T cells, referred to as regulatory CD8+ T assessing the effects of IDO-inhibition to patient survival lymphocytes [22]. Thus, a more accurate assessment of rates in CM have been promising [5]. the role of Tregs in CM could be made using CD25 co- However, previous studies related to FoxP3+ Tregs in staining [23]. Only a few retrospective immunohisto- CM have been contradictory. In some studies, high chemical studies have assessed CD25 + FoxP3+ Tregs in amounts of FoxP3+ Tregs have been correlated with CM. One study found CD25 + FoxP3+ Tregs was posi- greater Breslow’s depth or poor survival. For example, tively associated with recurrence in vertical growth Gerber et al. reported that high amounts of FoxP3+ phase melanomas [16], whereas another study found Tregs was associated with reduced OS but there was no CD25 + FoxP3+ Treg counts in tumor-stroma boundary correlation with Breslow’s depth [15]. Miracco et al. were higher in atypical nevi and radial growth phase found that a high percentage of FoxP3 + CD25 + Tregs melanomas, compared with vertical growth phase mela- correlated with recurrence in vertical growth phase mel- nomas and melanoma metastases [24]. anoma [16]. While in other studies, a correlation be- It is worth noting that FoxP3+ Tregs consist of distinct tween FoxP3+ Tregs and tumor stage or prognosis in tissue-specific subsets that have diverse phenotypes and CM has not been found [17–19]. Surprisingly, one study functions, and presumably they are differentiated and
Salmi et al. BMC Cancer      (2021) 21:641                                                                                             Page 10 of 13

 Fig. 5 The coverage and intensity of IDO+ tumor cells and their association with survival. IDO+ tumor cell coverage (a) was analysed from all
 samples using 5-level scoring system from 0 to 4. Statistically significant differences between the stages are shown with brackets (Kruskal–
 Wallistest). *P < 0.05, **P < 0.01, ***P < 0.001. IDO expression intensity (b) was also analysed from malignant tumors that contained more than 1%
 IDO+ tumor cells of all melanoma cells. IDO expression was classified as weak, moderate or strong. Representative stainings for weak, moderate
 and strong IDO expression in melanoma cells are represented in e-g, respectively. In survival analyses (c, d) samples were divided into two
 groups, IDO-negative and IDO-positive tumors, representing tumors that contained less than 1% or more than 1% IDO+ tumor cells of all
 melanoma cells. IDO-positive tumors was associated with poor recurrence-free survival (RFS) in the group of all samples (pT1, pT4, LNM) (c) and
 in the group of primary melanomas only (d) (P-values 0.019 and 0.036, respectively)

activated by tissue-specific cues, and regulated by vari-                    tumor growth in other cancer types, such as breast
ous transcription factors [25]. Thus, it is possible that                    cancer [29]. In addition, Treg diversity may also partially
different tumors with specific TMEs modify the pheno-                        explain why Tregs have a controversial role in some
type and function of tumor-infiltrating Tregs. This                          other malignancies, including gastric cancer [30], and it
would also at least partly explain why FoxP3+ Tregs                          may also contribute to the discrepancies between immu-
seem to promote tumor-progression in some cancers,                           nohistochemical studies on the role of FoxP3+ Tregs in
such as colorectal cancer [26–28], while inhibiting                          CM.
Salmi et al. BMC Cancer        (2021) 21:641                                                                                                  Page 11 of 13

Table 3 Associations of IDO-expressing melanoma cell coverage and intensity with clinicopathological parameters
Variables                            IDO expression in                                                IDO intensity in
                                     melanoma cells                                                   melanoma cells
                                     IDO-negative               IDO-positive          p-value         Weak n (%)               Moderate or          p-value
                                     tumors n (%)               tumors n (%)                                                   strong n (%)
Growth pattern                                                                        0.050                                                         1.000
  Nodular                            11 (52)                    10 (48)                               5 (50)                   5 (50)
  Other                              17 (81)                    4 (19)                                2 (50)                   2 (50)
Presence of mitoses                                                                   0.047                                                         0.299
  Yes                                18 (58)                    13 (42)                               6 (46)                   7 (54)
  No                                 10 (91)                    1 (9)                                 1 (100)                  0 (0)
Lymph node capsule rupture                                                            0.429                                                         0.014
  Yes                                5 (56)                     4 (44)                                0 (0)                    4 (100)
  No                                 5 (39)                     8 (62)                                6 (75)                   2 (25)
Overall recurrence                                                                    0.014                                                         0.352
  Yes                                16 (44)                    20 (56)                               11 (55)                  9 (45)
  No                                 19 (76)                    6 (24)                                2 (33)                   4 (67)
Locoregional recurrence                                                               0.009                                                         0.785
  Yes                                12 (40)                    18 (60)                               9 (50)                   9 (50)
  No                                 24 (73)                    9 (27)                                4 (44)                   5 (56)
Distal recurrence                                                                     0.040                                                         0.472
  Yes                                16 (46)                    19 (54)                               10 (53)                  9 (47)
  No                                 20 (71)                    8 (29)                                3 (38)                   5 (63)
Samples were divided into two groups, IDO-negative and IDO-positive tumors, representing tumors that contained less than 1% or more than 1% of IDO+ tumor
cells of all melanoma cells. IDO expression intensity of melanoma cells in IDO-positive tumors was also evaluated, and samples were divided into two groups
(weak and moderate or strong expression intensity) for analysis

  In the present study, IDO expression in tumor cells                           and pT4 melanomas were included in this study, as
was positively associated with high amounts of FoxP3+                           these tumors have clearly distinct prognosis. Thus, we
Tregs. The same result was obtained in another study,                           did not study melanomas > 1 mm or < 4 mm in our
where the study material consisted of primary melano-                           study. In addition, the tissue samples stained for FoxP3
mas, LNMs and distal metastases of CM [31]. Similarly,                          and IDO were not taken from serial sections; however,
Brody et al. reported that upregulation of IDO in tumor                         this factor is not seen to notably affect the results.
cells of LNMs was associated with an increased number                              In summary, our results indicate that IDO expression
of Tregs in CM, as well as with shorter survival [32].                          is intimately involved in creating a TME conducive to
However, the correlation between IDO+ stromal im-                               tumor growth and disease progression in CM. Further-
mune cell and FoxP3+ Treg counts was surprisingly                               more, we show that FoxP3+ Tregs appear to contribute
weak. To our knowledge, no study has assessed or re-                            to the immunosuppressive TME in CM, but their role
ported a correlation between Foxp3+ Tregs and IDO+                              may not be that critical to melanoma progression. Add-
stromal immune cells in human CM. Thus, we can only                             itional research is still needed to assess the role of Tregs
speculate that the activation and stabilization of Tregs                        in the context of different TMEs, and to clarify the inter-
may not be the primary function of IDO+ stromal im-                             actions between IDO expressing tumor cells versus
mune cells in CM. Furthermore, IDO is a counter-                                IDO+ stromal immune cells with Tregs in CM.
regulatory molecule, whereby its expression is induced
by inflammation or T cell activation [33]. Thus, the asso-                      Conclusions
ciation of IDO+ melanoma cells with high amounts of                             Our study supports the existing perception that IDO
FoxP3+ Tregs and TAMs may not refer to the direct im-                           plays a pro-tumoral role in CM. We found that the
pact of IDO on Tregs and TAMs, but to a high overall                            number of IDO+ stromal immune cells is higher in ma-
immunological activity and strongly induced immune                              lignant melanomas, compared with benign melanocytic
suppression in the tumor site.                                                  lesions, and that higher amounts of IDO+ melanoma
  There are some limitations that should be taken into                          cells correlate with poor prognostic factors and poor
account when interpreting the present results. Only pT1                         RFS in CM. We also studied the association between
Salmi et al. BMC Cancer (2021) 21:641 Page 12 of 13
IDO and FoxP3+ Tregs, which has not been previously Consent for publication
addressed substantially in CM, and we found a positive Not applicable.
correlation between IDO+ melanoma cells and FoxP3+
Tregs. Despite our finding that FoxP3+ Treg numbers Competing interests
The authors declare that they have no competing interests.
were higher in malignant melanomas, compared with
benign melanocytic lesions, we did not find a correlation Author details
1
between IDO+ stromal immune cells and FoxP3+ Tregs. Institute of Biomedicine, University of Eastern Finland, P.O. Box 1627 70211,
Kuopio campus, Kuopio, Finland. 2Institute of Clinical Medicine/ Clinical
This latter result may indicate complex interactions be- Pathology, University of Eastern Finland, 70029 Kuopio, Finland. 3Department
tween IDO and Tregs in CM, which demands further of Clinical Pathology, Kuopio University Hospital, 70029 Kuopio, Finland.
4
studies. Department of Dermatology, Kuopio University Hospital and University of
Eastern Finland, 70029 Kuopio, Finland.
Abbreviations
CM: Cutaneous Melanoma; DC: Dendritic cell; DSS: Disease-specific survival; Received: 23 June 2020 Accepted: 20 May 2021
FoxP3: Forkhead box P3-transcription factor; IDO: Indoleamine-2,3-
dioxygenase; LNM: Lymph node metastasis; MDSC: Myeloid-derived
suppressor cell; NK: Natural killer cell; OS: Overall survival; PBS: Phosphate
References
buffered saline; RFS: Recurrence-free survival; TAM: Tumor associated
1. Dimitriou F, Krattinger R, Ramelyte E, Barysch MJ, Micaletto S, Dummer R,
macrophage; TME: Tumor microenvironment; Treg: Regulatory T cell
et al. The world of melanoma: epidemiologic, genetic, and anatomic
differences of melanoma across the globe. Curr Oncol Rep. 2018;20(11):87.
Supplementary Information https://doi.org/10.1007/s11912-018-0732-8.
The online version contains supplementary material available at https://doi. 2. Passarelli A, Mannavola F, Stucci LS, Tucci M, Silvestris F. Immune system
org/10.1186/s12885-021-08385-4. and melanoma biology: a balance between immunosurveillance and
immune escape. Oncotarget. 2017;8(62):106132–42. https://doi.org/10.1
8632/oncotarget.22190.
Additional file 1: Figure 1. Simplified flow chart of the computer 3. Fourcade J, Zarour HM. Strategies to reverse melanoma-induced T-cell
vision algorithm used for automated image analysis. Figure 2. Melanin dysfunction. Clin Dermatol. 2013;31(3):251–6. https://doi.org/10.1016/j.
rejection filter Input (left) and output (right). Figure 3. Cell detection clindermatol.2012.08.010.
results. Input image (left), visualisation of algorithm output (middle) and 4. Takeuchi Y, Nishikawa H. Roles of regulatory T cells in cancer immunity. Int
output visualisation overlaid on top of input image (right). Immunol. 2016;28(8):401–9. https://doi.org/10.1093/intimm/dxw025.
5. Brochez L, Chevolet I, Kruse V. The rationale of indoleamine 2,3-dioxygenase
inhibition for cancer therapy. Eur J Cancer. 2017;76:167–82. https://doi.org/1
Acknowledgements
0.1016/j.ejca.2017.01.011.
The authors greatly acknowledge Mrs. Eija Rahunen and Mrs. Anne Koivisto
6. Hornyák L, Dobos N, Koncz G, Karányi Z, Páll D, Szabó Z, et al. The role
for excellent technical assistance, and biostatistician, M.Sc. Tuomas Selander
of Indoleamine-2,3-dioxygenase in Cancer development, diagnostics,
for statistical assistance. This work was carried out with the support of UEF
and therapy. Front Immunol. 2018;9:151. https://doi.org/10.3389/fimmu.2
Cell and Tissue Imaging Unit, University of Eastern Finland, Finland.
018.00151.
7. Löb S, Königsrainer A, Zieker D, Brücher BLDM, Rammensee H, et al. IDO1
Authors’ contributions and IDO2 are expressed in human tumors: levo- but not dextro-1-methyl
S.S. analysed the FoxP3 and IDO stainings, participated in imaging of tryptophan inhibits tryptophan catabolism. Cancer Immunol Immunother.
confocal stainings, performed the statistical analyses and wrote the 2009;58:153–7.
manuscript. A.L. coded the automatic digital image analysis software for 8. Fallarino F, Grohmann U. Using an ancient tool for igniting and propagating
FoxP3 stainings, analysed the FoxP3 stainings and participated in conducting immune tolerance: IDO as an inducer and amplifier of regulatory T cell
the statistical analyses and writing the manuscript. H.S. participated in functions. Curr Med Chem. 2011;18(15):2215–21. https://doi.org/10.2174/092
designing the study protocol and revised and commented on manuscript. 986711795656027.
B.H-G. analysed the IDO stainings. R.S. provided the study material, analysed 9. Siiskonen H, Poukka M, Bykachev A, Tyynela-Korhonen K, Sironen R,
the standard histopathological parameters and commented on manuscript. Pasonen-Seppanen S, et al. Low numbers of tryptase+ and chymase+ mast
N.A. analysed and imaged the confocal stainings. M.V. collected the cells associated with reduced survival and advanced tumor stage in
clinicopathological data. S.P-S. designed the study protocol, participated in melanoma. Melanoma Res. 2015;25(6):479–85. https://doi.org/10.1097/CMR.
IDO analyses and revised and commented on manuscript. All authors read 0000000000000192.
and approved the final manuscript. 10. Tiainen S, Tumelius R, Rilla K, Hamalainen K, Tammi M, Tammi R, et al. High
numbers of macrophages, especially M2-like (CD163-positive), correlate with
Funding hyaluronan accumulation and poor outcome in breast cancer.
Financial support for this work was provided by the Sigrid Juselius Histopathology. 2015;66(6):873–83. https://doi.org/10.1111/his.12607.
Foundation (S.P.-S.), Academy of Finland (S.P.-S.), The Paavo Koistinen 11. Simionescu C, Mărgăritescu C, Stepan A, Pirici D, Ciurea R, Cernea N. Tumor
Foundation (S.S.), Emil Aaltonen Foundation (S.S.) and North-Savo Cultural angiogenesis, macrophages and mast cell microdensities in endometrioid
Foundation (S.S.). The funders had no role in the study design. endometrial carcinoma. Oncol Lett. 2013;6(2):415–20. https://doi.org/10.3
892/ol.2013.1412.
Availability of data and materials 12. Gajewski TF. Failure at the effector phase: immune barriers at the level of
The datasets supporting the conclusions of this article are available on the melanoma tumor microenvironment. Clin Cancer Res. 2007;13(18):5256–
request from the corresponding author (satu.salmi@uef.fi). 61. https://doi.org/10.1158/1078-0432.CCR-07-0892.
13. Rubel F, Kern JS, Technau-Hafsi K, Uhrich S, Thoma K, Häcker G, et al.
Declarations Indoleamine 2,3-dioxygenase expression in primary cutaneous melanoma
correlates with Breslow thickness and is of significant prognostic value for
Ethics approval and consent to participate progression-free survival. J Invest Dermatol. 2018;138(3):679–87. https://doi.
This study was approved by the research ethics committee of the Northern org/10.1016/j.jid.2017.09.036.
Savo Hospital District and by the Finnish National Supervisory Authority for 14. Pelak MJ, Śnietura M, Lange D, Nikiel B, Pecka KM. The prognostic
Welfare and Health (VALVIRA, 6187/05.01.00.06/2010). Informed consent was significance of indoleamine-2,3-dioxygenase and the receptors for
not required since this is a retrospective registered study. transforming growth factor β and interferon γ in metastatic lymph nodes inSalmi et al. BMC Cancer (2021) 21:641 Page 13 of 13
malignant melanoma. Pol J Pathol. 2015;66(4):376–82. https://doi.org/10. Publisher’s Note
5114/pjp.2015.57249. Springer Nature remains neutral with regard to jurisdictional claims in
15. Gerber AL, Munst A, Schlapbach C, Shafighi M, Kiermeir D, Husler R, et al. High published maps and institutional affiliations.
expression of FOXP3 in primary melanoma is associated with tumour
progression. Br J Dermatol. 2014;170(1):103–9. https://doi.org/10.1111/bjd.12641.
16. Miracco C, Mourmouras V, Biagioli M, Rubegni P, Mannucci S, Monciatti I,
et al. Utility of tumour-infiltrating CD25+FOXP3+ regulatory T cell evaluation
in predicting local recurrence in vertical growth phase cutaneous
melanoma. Oncol Rep. 2007;18(5):1115–22.
17. Melsted WN, Johansen LL, Lock-Andersen J, Behrendt N, Eriksen JO, Bzorek
M, et al. HLA class Ia and Ib molecules and FOXP3+ TILs in relation to the
prognosis of malignant melanoma patients. Clin Immunol. 2017;183:191–7.
https://doi.org/10.1016/j.clim.2017.09.004.
18. Sebestyén T, Mohos A, Liszkay G, Somlai B, Gaudi I, Ladányi A. Correlation with
lymphocyte infiltration, but lack of prognostic significance of MECA-79-positive
high endothelial venules in primary malignant melanoma. Melanoma Res.
2018;28(4):304–10. https://doi.org/10.1097/CMR.0000000000000457.
19. Ladanyi A, Mohos A, Somlai B, Liszkay G, Gilde K, Fejos Z, et al. FOXP3+ cell
density in primary tumor has no prognostic impact in patients with
cutaneous malignant melanoma. Pathol Oncol Res. 2010;16(3):303–9.
https://doi.org/10.1007/s12253-010-9254-x.
20. Ladoire S, Senovilla L, Enot D, Ghiringhelli F, Poirier-Colame V, Chaba K,
et al. Biomarkers of immunogenic stress in metastases from melanoma
patients: correlations with the immune infiltrate. Oncoimmunology. 2016;
5(6):e1160193. https://doi.org/10.1080/2162402X.2016.1160193.
21. Tjin EP, Krebbers G, Meijlink KJ, van de Kasteele W, Rosenberg EH, Sanders J,
et al. Immune-escape markers in relation to clinical outcome of advanced
melanoma patients following immunotherapy. Cancer Immunol Res. 2014;
2(6):538–46. https://doi.org/10.1158/2326-6066.CIR-13-0097.
22. Devaud C, Darcy PK, Kershaw MH. Foxp3 expression in T regulatory cells
and other cell lineages. Cancer Immunol Immunother. 2014;63(9):869–76.
https://doi.org/10.1007/s00262-014-1581-4.
23. Liu X, Wang X, Ding J, Gao Y, Zhao Y, Zhao R, et al. FOXP3 and CD25
double staining antibody cocktails identify regulatory T cells in different
types of tumor tissues using tissue microarrays. Ann Diagn Pathol. 2019;38:
67–70. https://doi.org/10.1016/j.anndiagpath.2018.11.005.
24. Mourmouras V, Fimiani M, Rubegni P, Epistolato MC, Malagnino V, Cardone
C, et al. Evaluation of tumour-infiltrating CD4+CD25+FOXP3+ regulatory T
cells in human cutaneous benign and atypical naevi, melanomas and
melanoma metastases. Br J Dermatol. 2007;157(3):531–9. https://doi.org/1
0.1111/j.1365-2133.2007.08057.x.
25. Koizumi S, Ishikawa H. Transcriptional regulation of differentiation and
functions of effector T regulatory cells. Cells. 2019;8(8). https://doi.org/10.33
90/cells8080939.
26. Salama P, Phillips M, Grieu F, Morris M, Zeps N, Joseph D, et al. Tumor-infiltrating
FOXP3+ T regulatory cells show strong prognostic significance in colorectal
cancer. J Clin Oncol. 2009;27(2):186–92. https://doi.org/10.1200/JCO.2008.18.7229.
27. Sun X, Feng Z, Wang Y, Qu Y, Gai Y. Expression of Foxp3 and its prognostic
significance in colorectal cancer. Int J Immunopathol Pharmacol. 2017;30(2):
201–6. https://doi.org/10.1177/0394632017710415.
28. Kuwahara T, Hazama S, Suzuki N, Yoshida S, Tomochika S, Nakagami Y, et al.
Intratumoural-infiltrating CD4 + and FOXP3 + T cells as strong positive
predictive markers for the prognosis of resectable colorectal cancer. Br J
Cancer. 2019;121(8):659–65. https://doi.org/10.1038/s41416-019-0559-6.
29. Shou J, Zhang Z, Lai Y, Chen Z, Huang J. Worse outcome in breast cancer with
higher tumor-infiltrating FOXP3+ Tregs: a systematic review and meta-analysis.
BMC Cancer. 2016;16(1):687. https://doi.org/10.1186/s12885-016-2732-0.
30. Liu X, Zhang Z, Zhao G. Recent advances in the study of regulatory T cells
in gastric cancer. Int Immunopharmacol. 2019;73:560–7. https://doi.org/10.1
016/j.intimp.2019.05.009.
31. Chevolet I, Speeckaert R, Haspeslagh M, Neyns B, Krüse V, Schreuer M, et al.
Peritumoral indoleamine 2,3-dioxygenase expression in melanoma: an early
marker of resistance to immune control? Br J Dermatol. 2014;171(5):987–95.
https://doi.org/10.1111/bjd.13100.
32. Brody JR, Costantino CL, Berger AC, Sato T, Lisanti MP, Yeo CJ, et al.
Expression of indoleamine 2,3-dioxygenase in metastatic malignant
melanoma recruits regulatory T cells to avoid immune detection and affects
survival. Cell Cycle. 2009;8(12):1930–4. https://doi.org/10.4161/cc.8.12.8745.
33. Munn DH, Mellor AL. IDO in the tumor microenvironment: inflammation,
counter-regulation, and tolerance. Trends Immunol. 2016;37(3):193–207.
https://doi.org/10.1016/j.it.2016.01.002.You can also read