Impact of Morphological Characteristics of Green Roofs on Pedestrian Cooling in Subtropical Climates - MDPI
←
→
Page content transcription
If your browser does not render page correctly, please read the page content below
Article

Impact of Morphological Characteristics of Green
Roofs on Pedestrian Cooling in Subtropical Climates
Gaochuan Zhang 1, Bao-Jie He 2,*, Zongzhou Zhu 3 and Bart Julien Dewancker 1
 1 Faculty of Environmental Engineering, the University of Kitakyushu, Kitakyushu 808‐0135, Japan;
   zjhz_zgc@sina.com (G.Z.); bart@kitakyu‐u.ac.jp (B.J.D.)
 2 Faculty of Built Environment, University of New South Wales, Sydney 2052, Australia

 3 School of Human Settlements and Civil Engineering, Xi’an Jiaotong University, Xi’an 710049, China;

   zhuzongzhou@stu.xjtu.edu.cn
 * Correspondence: baojie.he@unsw.edu.au; Tel.: +61‐2‐9285‐5783

 Received: 3 December 2018; Accepted: 4 January 2019; Published: 9 January 2019

 Abstract: Growing and densifying cities set a challenge for preserving and enhancing green spaces
 to cool urban spaces. Green roofs, involving the planting of vegetation on rooftops, are regarded as
 an alternative approach to enhancing urban greenery and urban cooling. For better cooling
 performances, it is essential to reasonably configure green roofs, especially in real and complex
 neighborhoods. Therefore, the aim of this paper is to investigate the impact of morphological
 characteristics of green roofs on pedestrian cooling in real and complex neighborhoods. In specific,
 based on an ENVI‐met model, we studied the effect of greening layout, coverage ratio, vegetation
 height, and building height on pedestrian air temperature reduction in the tropical city of Hangzhou,
 China. Results indicate green roofs could generate moderate effects on pedestrian air temperature
 reduction (around 0.10–0.30 °C), while achieving a cooling performance of 0.82 °C. Green roofs in
 upwind zones were able to generate the most favorable cooling performance, while green roofs in
 downwind zones made slight differences to pedestrian thermal environments. Green roofs with a
 low coverage ratio were not useful for lowering pedestrian temperature, and a greening coverage
 ratio of 25–75% in upwind zones was cost‐effective in real neighborhoods. Locations that were
 horizontally close to green roofs enjoyed better cooling performances. Increasing vegetation height
 could strengthen cooling effects of green roofs, while an increase in building height weakened the
 cooling performance. Nevertheless, higher building height could enhance pedestrian cooling
 performances because of building shading effects. In addition, because of wind effects and building
 shading, building height limits for the cooling performance of green roofs could be higher than 60 m.

 Keywords: urban heat; pedestrian cooling performance; real neighborhood; extensive green roof;
 intensive green roof; morphological characteristic; green roof layout; greening coverage ratio;
 vegetation height; building height

1. Introduction
     With ongoing urbanization, worldwide numerous cities, especially megacities, have become
congested and overpopulated concrete jungles. Urban problems such as temperature increase,
surface flooding, and airborne pollution occur more frequently as a result, thereby influencing the
urban ecosystem and living environments [1–4]. The temperature increase in cities because of the
increase in thermal mass and anthropogenic heat, lowered evapotranspiration, and weakened
ventilation is a severe and common problem [5–7], posing severe challenges in various aspects such
as energy consumption, thermal comfort, and citizens’ health conditions [8–10]. Nevertheless, the

Int. J. Environ. Res. Public Health 2019, 16, 179; doi:10.3390/ijerph16020179     www.mdpi.com/journal/ijerph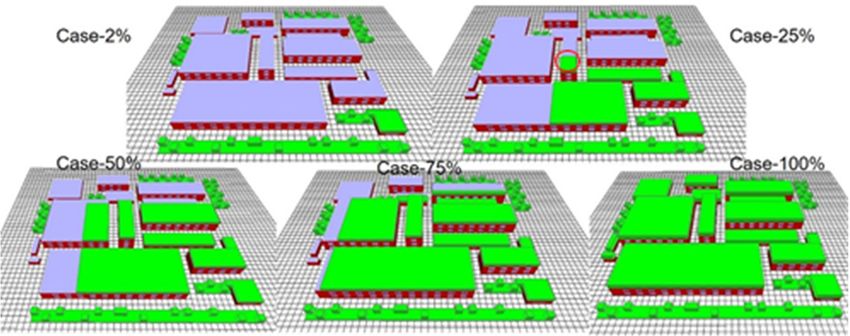
Int. J. Environ. Res. Public Health 2019, 16, 179                                                          2 of 20

increase in intraurban temperature and thermal stress will be further aggravated as urbanization
continues.
     Cool material, urban greenery, water bodies, and urban design that can weaken heat source
strength and promote excess urban heat dissipation are primary strategies and techniques for urban
cooling [11–13]. Among them, green roofs, involving the planting of vegetation on building rooftops,
is thought as an effective approach due to evapotranspiration and shading effects [14–16]. Moreover,
green roofs, created through gardens or forests replacing the dark and exposed concrete surfaces, are
conducive to energy and carbon reduction through increasing mass and thermal resistance value [17–19].
Figure 1 exhibits the cooling mechanism of green roof, where solar heat gain can be reduced by leaves,
followed by a conversion of absorbed solar heat to latent heat by evapotranspiration and a reduction
of absorbed radiation, resulting in lower surface temperatures and less emitted longwave radiation,
and as such, reduced air temperatures [16,18].

      Figure 1. A schematic structure of an extensive green roof and an intensive green roof, and the cooling
      mechanism in the daytime.

      To better utilize green roof for urban cooling, various studies have been carried out to examine
factors that can influence the cooling potential of green roof [20–23]. It is shown that the cooling
performance varies with climates and geographic conditions. In hot–humid climates (e.g., Hong
Kong), the cooling performance underperformed compared with hot–dry climates (e.g., Cairo).
Likewise, green roofs in warm‐humid climates (e.g., Tokyo) and temperate climates (e.g., Paris) also
showed weakened cooling efficiencies [24]. This is because the greenery transpiration is a complex
process in relation to various factors within the planetary boundary layer such as solar intensity,
wind speed, and soil temperature [24,25]. For instance, in semiarid climates, green roofs could reduce
the diurnal sensible heat flux by 150 W/m2 and lower the planetary boundary layer height by 700 m [17].
Nevertheless, in temperate continental climate of Chicago, the inclusion of green roofs could reduce
surface temperature, but it also reduced wind speed and atmosphere dynamics [18]. Moreover, in
subtropical oceanic climate of the Baltimore–Washington metropolitan area, cooling performance of
green roof varied with soil moisture, and the cooling performance was negligible when soil moisture
was close to its wilting point [19].
      Nevertheless, in the same climate, cooling performances of green roof vary with roof structures.
Adapting to building types (e.g., single family residential and commercial buildings) with weight,
maintenance, and irrigation concerns, green roofs can be divided into extensive green roofs (EGFs)
and intensive green roofs (IGFs), as shown in Figure 1. Overall, the IGF is characterized by better
cooling performances than the EGF [24]. A study conducted in Hong Kong indicated that IGFs could
reduce pedestrian air temperature up to 0.5–1.7 °C, compared with the 0.4–0.7 °C reduced by EGFs
[22]. In the same context, another study idealizing the roof height of 20 m also suggested that IGFs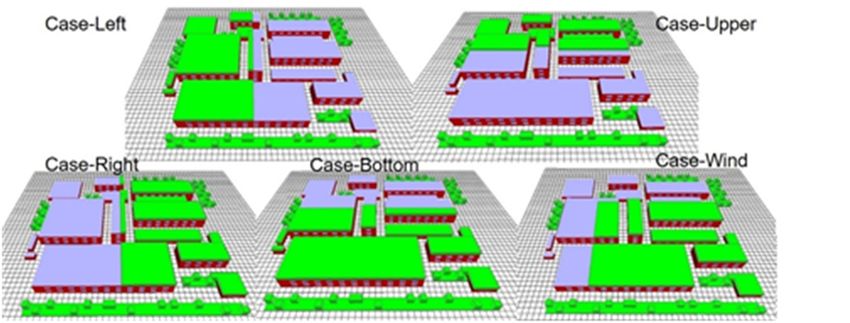
Int. J. Environ. Res. Public Health 2019, 16, 179                                                 3 of 20

had higher cooling efficiencies than EGFs, with pedestrian‐level air temperature reductions of 0.6 °C
and 0.2 °C, respectively [21]. In addition, various studies on green roof have evidenced that cooling
performance could be enhanced with the increase of green coverage ratio [9,21,24].
      Apart from green roof structures, building characteristics and configurations can also influence
cooling effects of green roofs. Overall, the cooling performance decreases along building height, and
the cooling effects on pedestrian air temperature are negligible when the building height exceeds 60 m
[24]. Meanwhile, the increase of urban density restrains the pedestrian cooling performances, and
green roofs play an insignificant role in medium‐ and high‐density neighborhoods [21,24,26]. It is
also evidenced that building layout and associated green roof arrangement can affect the cooling
performance of green roof [27,28]. For instance, among idealized enclosing‐, scattered‐, and array‐
shaped neighborhoods, green roofs with enclosing layout had the best cooling performance, followed
by the array layout, and the scattered layout [28]. Along prevailing wind, arranging green roofs in
upwind zones could reduce the temperature of the whole neighborhood [28].
      Overall, above‐mentioned studies have suggested that cooling performance of green roofs
depends on both building morphology and green roof structures [29]. However, most studies on
comparatively investigating cooling performances of green roof are mainly conducted in idealized
neighborhoods. In reality, building morphology is quite complex rather than idealized, which affects
the microclimate significantly [30,31]. It is essential to further investigate the cooling performance of
green roofs in real neighborhoods. Therefore, this paper aims to investigate the impact of
morphological characteristics of green roof on pedestrian cooling in real neighborhoods. In specific,
this study is conducted in the summer of a subtropical city, Hangzhou (China), for the following
objectives (1) to identify relationships between greening layout and corresponding pedestrian cooling
performances, (2) to explore the appropriate coverage ratio of green roof in real neighborhoods, (3)
to explore the regulation of vegetation height to decrease pedestrian air temperature, and (4) to
examine the impact of building height on green roof’s cooling performance in real neighborhoods.
      The remainder of this paper is structured as follows. Section 2 introduces the basic information
of the study area and Section 3 describes the field measurement, and settings and calibration of the
ENVI‐met model. Section 4 analyzes and discusses the impact of greening layout, coverage ratio,
vegetation height, and building height on the cooling performance of green roofs, and Section 5
concludes this paper. Overall, this study adds the knowledge of how building morphology and green
roof structure influence microclimate simultaneously. The comparative and scientific assessments of
green roof cooling performance in real neighborhoods can practically instruct urban planners and
policy‐makers to choose effective cooling strategies and techniques.

2. Study Area
     This study was conducted in the context of Hangzhou, the capital city of Zhejiang Province,
China (Figure 2). Hangzhou is the center of the Hangzhou metropolitan area in the Yangtze River
Delta. The city has a population of more than nine million, covering an area of 16,596 km2.

                           Figure 2. Location of Hangzhou city and the fixed weather station.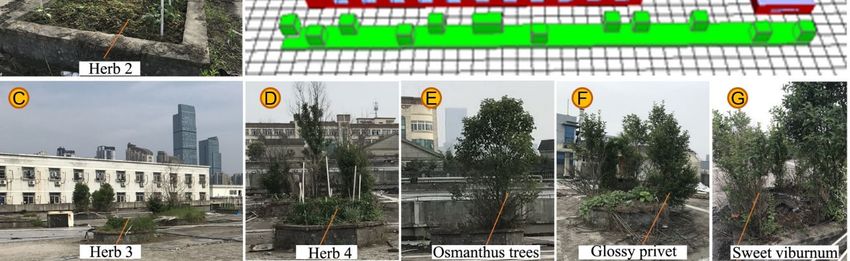
Int. J. Environ. Res. Public Health 2019, 16, 179 4 of 20
In the past years, Hangzhou has witnessed a rapid urbanization trend. Its urbanization ratio
reached 75.3% by 2016 [32,33]. In recent years, Hangzhou has been undergoing the problem of
temperature increase. According to the long‐term meteorological data collected at the fixed weather
station (Figure 3a, Xiaoshan International Airport, with an elevation of 43 m), its average temperature
has increased more than 1 °C in the past 40 years.
Located at 30°15′39″ N and 120°15′26″ E, Hangzhou is characterized by the subtropical climate.
Hangzhou has four distinctive seasons every year. Apart from the hot temperature, its summer (June,
July and August) is quite humid as the southeast wind can bring a large amount of vapor, and thereby
rich precipitation, from the adjacent East China Sea. In particular, the year of 2017 was the hottest
year in the past 40 years, as shown in Figure 3a. From Figure 3b, it is observed that July was the
hottest month, where the average daily temperature was more than 32 °C. Moreover, the daily
minimum and maximum air temperatures were 27 °C and 36 °C, respectively. Overall, the regional
climatic conditions make the summer outdoor spaces extremely unfavorable.
(a) (b)
Figure 3. (a) Meteorological condition of Hangzhou city (1978–2017). (b) Weather condition of
Hangzhou in the year of 2017. (Note: T avg: average air temperature, T max: average maximum air
temperature, T min: average minimum air temperature).
3. Data and Methodology
This study draws upon field measurements and numerical simulation (based on the
computational tool of ENVI‐met) to perform the comparative analysis of the impact of green roof
morphological characteristics on neighborhood cooling. Figure 4 presents the framework of this
study. The field measurements were applied to measure the pedestrian microclimatic conditions of
the case study area that was 6 km away from the fixed weather station (Figure 2). These field data
collected were utilized to calibrate and validate the numerical model established in the ENVI‐met
software [34], based on which the microclimates under different scenarios were predicted through
changing parameters.
3.1. Field Measurements
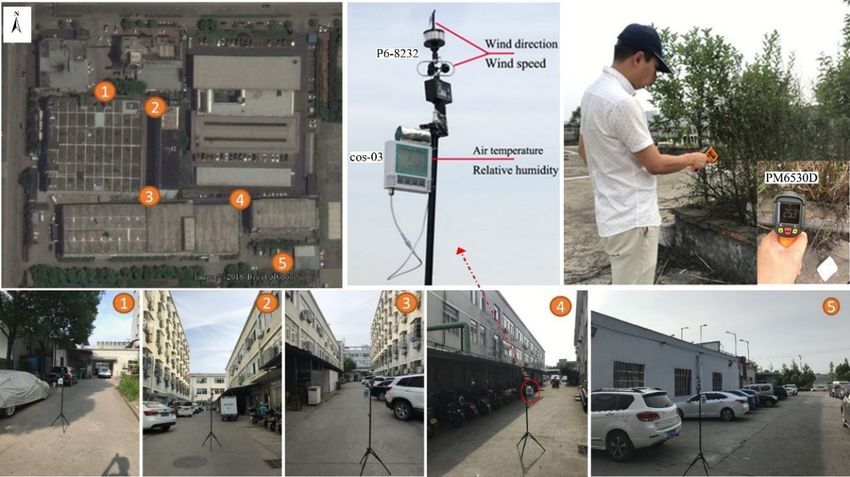
Field measurements were carried out around a clothing industrial area consisting of several
buildings, as shown in Figure 5. Building heights range between 3 m and 15 m and the average height
of buildings is about 10 m. The case study area is seriously insufficient in greenery. There is one
willow, four camphor trees and small‐scale lawn at the entrance of the factory and the rest land is
primarily occupied by traffic land. On the rooftop of these buildings, some scattered pocket green
can be observed on cement roofs which have strong reflective and thermal storage capacity.
The study area is used for industrial purpose, so that it is generally operated in the daytime. It
is practically meaningful to concentrate on the diurnal microclimates and pedestrian cooling
performances of green roofs. Specifically, field measurements were conducted between 8:00 and 20:00
h local time on 29 June 2018. During this period, all buildings were in normal operation. Specifically,
we conducted microclimate (including air temperature, relative humidity, wind speed, and wind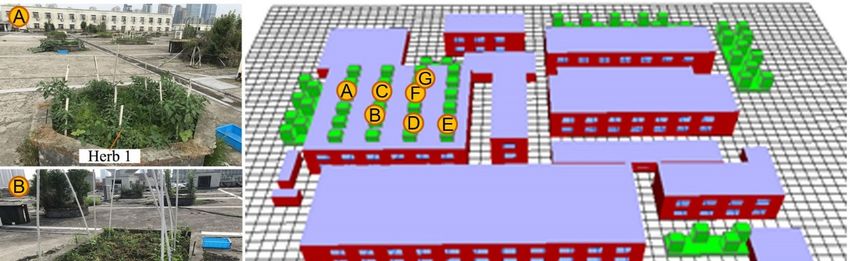
Int. J. Environ. Res. Public Health 2019, 16, 179                                                      5 of 20

direction) measurements at five points (in the middle of the road), as presented in Figure 5. The
spatial distribution followed the direction of summertime prevailing wind, in order to examine the
possible influence of wind on air temperature. All the equipment (as shown in Table 1) was set at the
height of 1.4 m above the ground through tripods. Meanwhile, the temperature and relative humidity
sensors were covered by aluminum alloy sleeves wrapped in aluminum foil to exclude solar radiation
[35], as shown in Figure 5. All the data were recorded every five minutes. Meanwhile, soil temperature
was recorded by handheld infrared thermometer (Figure 5).

      Figure 4. A framework for comparative analyzing cooling performance of green roofs under different
      scenarios.

                    Figure 5. On‐site field measurement and the spatial distribution of test points.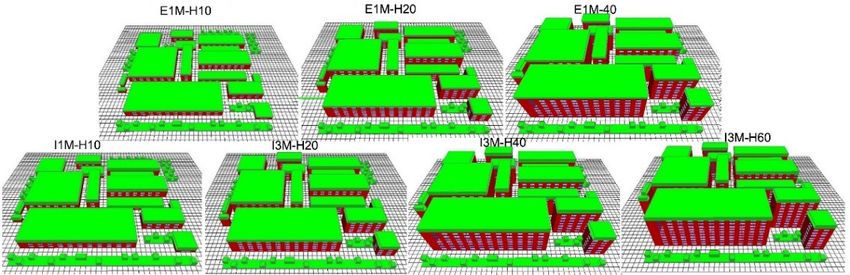
Int. J. Environ. Res. Public Health 2019, 16, 179                                                           6 of 20

         Table 1. Parameters and instruments used during the field measurements. LAI: leaf area index.

           Item          Instrument                 Parameter             Resolution/Range        Frequency
      Temperature           Cos‐03             Air temperature           ±0.1 °C (−20 °C–60 °C)     5 min
       Humidity             Cos‐03            Relative humidity             ±1.5% (0–100%)          5 min
                                                 Wind speed               ±0.9 m/s (0–30 m/s)
          Wind              P6‐8232                                                                30 min
                                               Wind direction                 ±0.5° (0–360°)
           Soil           PM 6530D            Soil temperature           ±0.5 °C (−20 °C–60 °C)      1h
           LAI            LAI‐2000            Leaf area density       2.5 m CEP (50% deviation)      1D
                                     CEP: Circular Error Probable; LAI: leaf area index.

     In addition, we collected the leaf area density (LAD) profiles of the greenery based on leaf area
index (LAI)‐2000 and hemispherical cameras [36,37]. Specifically, vertical and horizontal profiles of
LAD and horizontal canopy structure were measured. The greenery was composed of three‐type
trees (including Osmanthus trees, sweet viburnum, and glossy privet), which flourished and had a
similar height of 3 m. Several kinds of herb grass for which height was less than 1 m were observed
on site, as shown in Figure 6. The composition of trees and grasses made a good reference for IGFs and
EGFs.

                         Figure 6. Photos of rooftop vegetation and the initial ENVI‐met model.

3.2. Settings and the Calibration of ENVI-Met Model
     ENVI‐met software (version 4.3.1) was adopted to estimate the microclimates in the case study
area under different scenarios. We chose to simulate a total amount of 30 h from the 00:00 to 06:00 h
of the next morning, in which the first six hours were used to achieve microclimate stabilization. In
the numerical model, the distribution of grids in the domain model area (270 m × 240 m × 60 m) was
5 m and 2 m in horizontal (Δx and Δy) and vertical (Δz) directions, respectively. Measured buildings
were coated by concrete roof and red brick wall with several windows. Five nested grids were
adopted to discretize the numerical model. The initial micro‐meteorological parameters, simulation
controlling parameters, and the definitions of the underlying surface and thermal properties of
buildings were set to define the initial boundary conditions, as shown in Table 2.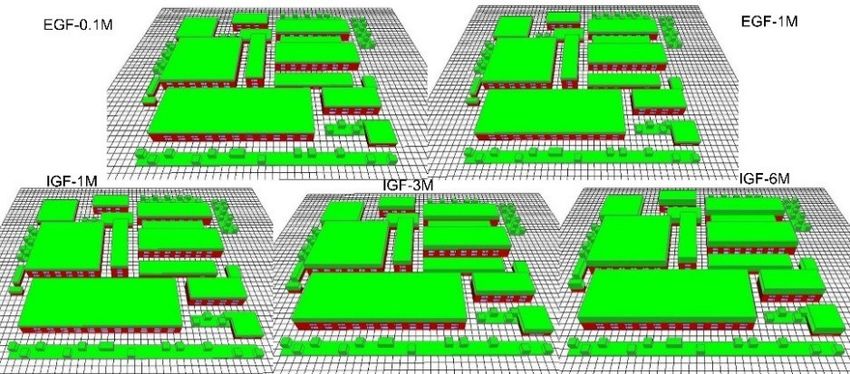
Int. J. Environ. Res. Public Health 2019, 16, 179                                                            7 of 20

                          Table 2. Settings of boundary condition in verified ENVI‐met model.

                  Item                                 Parameter                                Value
           Meteorological                                 Solar radiation                    0.5; 0.6; 0.8
            parameters                                Initial wind direction                   45°(SE)
                                                       Wind speed at 10 m                       2 m/s
                                                     Initial air temperature                   22.0 ℃
                                                        Relative humidity                        71%
                                                Air moisture content (2500.0 m)               6.5 g·kg−1
                                                        Roughness length                        0.1 m
                                                           LAD of IGFs                       1.5 m2·m−3
                  Roof
                                                           LAD of EGFs                       1.0 m2·m−3
                                                 Average albedo of green/roof                  0.2/0.3
                  Soil                 Initial surface temperature/humidity (0–20 cm)       25.0 °C/50%
                                  Initial temperature/humidity in middle depth (0–20 cm)    26.0 °C/60%
                                    Initial temperature/humidity in deep depth (>50 cm)     26.0 °C/60%
                   LAD: leaf area density; IGFs: intensive green roofs; EGFs: extensive green roofs.

     The meteorological parameters such as wind speed, air temperature and relative humidity, were
mainly obtained from field measurements. Model roughness length z0 followed the ENVI‐met
default values and air moisture content at 2500.0 m was set as 6.5 g/kg. The ENVI‐met plant model
was divided into 10 equal layers according to vegetation type, so as to facilitate users to define LAD
of each layer, thereby accurately describing different canopy shapes and LAD distribution. The
setting of plant height in the study area was based on the field survey data, with 1.5 m2/m3 and 1.0
m2/m3 for IGFs and EGFs, respectively [38,39]. The parameters of thermal properties of buildings
were based on the “Design standard for energy efficiency of residential buildings in hot summer and
cold winter zone” in China [40].
     In ENVI‐met software, the suggested solar radiation ratio (SRR) is 1.0, representing an ideal
weather condition with no clouds. However, in realistic environment, cloud that influences the SRR
value can be roughly observed. To calibrate the numerical model, therefore, we conducted the
sensitivity analysis of various SRR values, including 0.5, 0.6, and 0.7, to the average air temperatures
of the five test points in Figure 5. As presented in Figure 7a, the numerical model approached the
measured thermal environment much more when the SRR was 0.6. In the scenario of SRR = 0.6, the
simulated air temperatures of five test points (8:00–20:00) were compared with the measured air
temperatures, as shown in Figure 7b. There was a strong correlation between the measured and
simulated air temperatures (R2 = 0.8921), meaning the numerical model was in a good agreement with
the actual environment [22,24,41,42].

3.3. Accuracy and Uncertainty of the Numerical Model
     Except for SRR, which has been mentioned in Section 2.2, there are some limitations on the
setting of surface roughness length and short time scale. The time allowed in ENVI‐met model is only
between 24 and 48 h, which makes it difficult to obtain the long‐term and representative microclimate
variation patterns. At the same time, for the wind speed and direction, ENVI‐met model adopts less
complex input parameters than typical computational fluid dynamics models to mimic real wind
fields [43,44]. It was assumed that approaching wind speed and direction remained constant in a
whole day in the ENVI‐met model. Nevertheless, the approaching wind keeps changing all the time,
thereby leading to the deviation of expected air temperatures. Meanwhile, increasing anthropogenic
heat emissions from buildings (for example from air‐conditioners) discharged into the street canyons
can also elevate outdoor temperatures, which is not reflected in the ENVI‐met model. At present,
moreover, the ENVI‐met model cannot define the substrate layer of the green roof, so the thermal
effect of soil is ignored. Particularly, the process whereby the wind blows over the soil, taking away
near‐surface heat, has been neglected [45,46].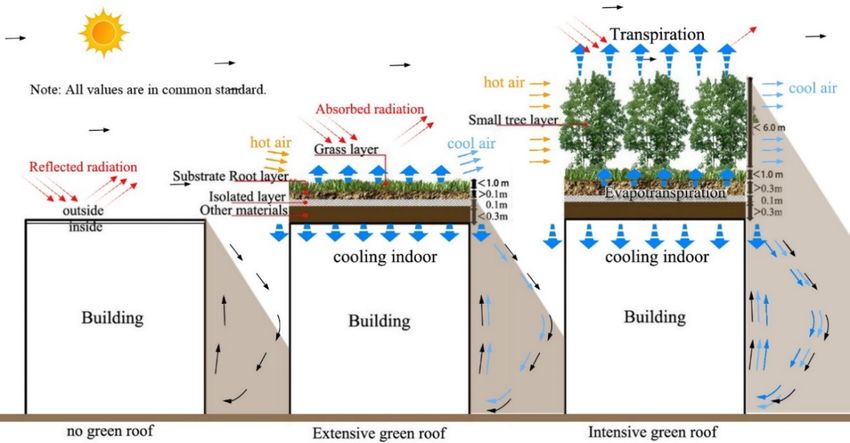
Int. J. Environ. Res. Public Health 2019, 16, 179                                                     8 of 20

                                 (a)                                          (b)

      Figure 7. Calibration of ENVI‐met model. (a) Comparison of measured average air temperature of
      five points with numerical results in different scenarios of solar radiation, and (b) Correlations
      between measured and simulated air temperatures of five points (from 08:00 to 20:00 h).

3.4. Base Model and Data
     After the calibration of computational model, we performed various simulations with the
variations of greening layout, coverage ratio, vegetation height and building height, based on the
weather conditions of 7 July 2017. The air temperature ranged from 28 °C to 36 °C, close to the
temperature of the hottest month as described in Section 2.1. Herein we simulated roughly light wind
conditions, with the wind speed of 2 m/s and summer prevailing wind direction (southeast) [47,48].
To compare the cooling performance of green roof, we established a base model without any greenery
on the rooftop, as shown in Figure 8. Overall, studied the pedestrian thermal environment (1.4 m) at
15:00 h (the hottest time in a day) in different scenarios. For example, Figure 8b presents the
pedestrian thermal environment of the base case at 15:00 h. Moreover, we investigated the daily
average pedestrian temperatures (07:00 to 06:00 h of the next day) at five test points and variations of
average pedestrian temperature of five test points. Based on the base case, the cooling performances
of different morphological characteristics of green roof can be derived. To obtain the accurate daily
temperature from 07:00 to 06:00 h of the next day, the simulation was run six hours in advance. Due
to the limited EGF cooling effects, in Sections 4.1 and 4.2 only IGFs were adopted.

                                (a)                                             (b)

      Figure 8. Base case diagram in ENVI‐met software: (a) Physical model and (b) pedestrian thermal
      environment at 15:00 h.
Int. J. Environ. Res. Public Health 2019, 16, 179                                                       9 of 20

4. Results and Discussion

4.1. Effect of Green Roof Layout on Pedestrain Cooling Performance
      This section focuses on the cooling performance of five IGF layouts, where the greenery ratio of
each scenario is 50%. As shown in Figure 9a, the IGF layouts were divided into five types: Case‐Left,
Case‐Upper, Case‐Right, Case‐Bottom, and Case‐Wind. In the Case‐Wind type, the green roof was
set in the upwind zones in order to examine the combining effects of prevailing wind and green roof.
On the basis of the base case in Section 3.3, the cooling performance of each scenario (at 15:00 h) was
obtained and is shown in in Figure 9b. Overall, the maximum cooling performance of IGF could reach
up to 0.26 °C. The Case‐Wind type witnessed the best spread cooling effects in the local area, while
the Case‐Left type exhibited the weakest cooling capability to the local area because the green roof
was in the downwind zones. Comparatively, the Case‐Right and Case‐Bottom types had better
cooling performances than the Case‐Upper type. This indicates the green layout at the upwind side
would effectively reduce the air temperature of the entire area. This result is in a good agreement
with the existing conclusions that under the wind effects, green roof with orthogonal arrangement
can achieve significant cooling effects in downwind area [28,49].

                                                      (a)

                                                      (b)

      Figure 9. Comparison of the impact of greening layout on green roof cooling performance (a) Physical
      models, and (b) pedestrian air temperature reduction at 15:00 h.

    Figure 10 further presents the variations of daily average cooling performance with greening
layout. The cooling performance varied dramatically with point location. In particular, the cooling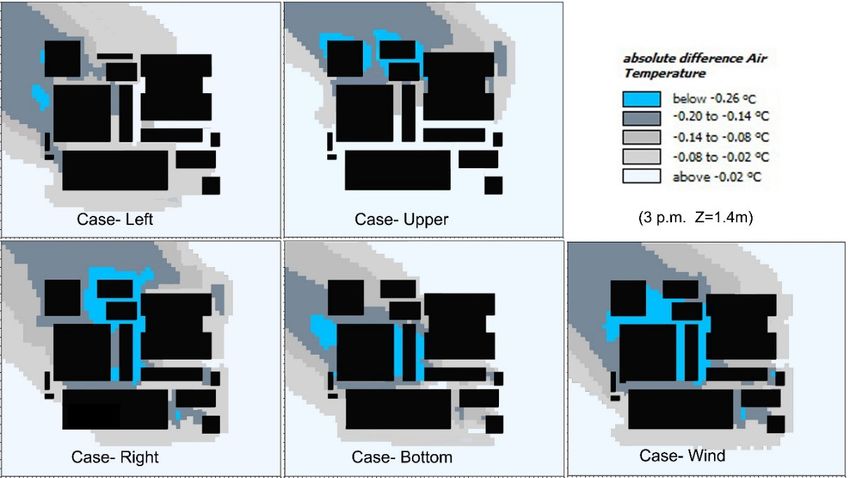
Int. J. Environ. Res. Public Health 2019, 16, 179                                                           10 of 20

performance were good at point‐1, point‐2, and point‐3, as shown in Figure 10a. Moreover, Case‐
Wind and Case Bottom types exhibited the best cooling effects at five test points, as shown in Figure
10a. At point‐1, the cooling performance of green roof followed the order of Case‐Wind > Case‐Upper
> Case‐Left > Case‐Bottom > Case‐Right. This is because point‐1 was in the downwind zones in all
scenarios and roof greenery could exert cooling effects on it. At point‐2, the green roof in Case‐Wind,
Case‐Bottom, and Case‐Right types exhibited their maximum cooling effects, while the green roof in
Case‐Up and Case‐Left types made slight differences because of the upwind location of point‐2.
Greenery layout exerted the similar impacts on point‐3, but the cooling performances were weaker
than that on point‐2. In addition, the cooling effects of green roof on point‐4 and point‐5 were quite
weak, no more than 0.1 °C. These indicate that both upwind green roof location and its distance from
test points (in downwind areas) are important factors determining the pedestrian air temperature
reduction. In other words, downwind areas are much cooler and the location closer to green roof is
much cooler.
     Moreover, the average air temperature of five test points in all day were calculated to indicate
the variations of cooling performances of five scenarios (Figure 10b). Overall, the diurnal fluctuation
of cooling performance was more intense than nocturnal one because the great fluctuation of daytime
temperature with solar radiation. The temperature reduction resulted from green roof was stable
after 17:00 h, indicating green roof could exhibit a long‐time cooling performance in the evening. In
the daytime, cooling performance decreased rapidly from the morning time to 14:00 h, at which time
cooling performance was negligible. This might be because leaf stomata close at high temperatures,
and thereby evapotranspiration stops [1,50]. Likewise, Case‐Wind was the most prominent scenario
in decreasing pedestrian air temperature, followed by Case‐Bottom, Case‐Right, Case‐Left, and Case‐
Upper. Therefore, strategically installing green roof in upwind zones rather than random greening
layouts is more efficient for neighborhood cooling.

                                 (a)                                                  (b)

      Figure 10. Average air temperature reduction in different green roof layout scenarios. (a) Daily
      average air temperatures at five test points, and (b) daily variations of average air temperature of five
      test points from 07:00 to 06:00 h of the next day.

4.2. Effect of Coverage Ratio of Green Roof on Pedestrain Cooling Performance
     To further facilitate the application of green roofs, we examined the influence of greening
coverage ratio on green roof cooling performances. In particular, five types of IGFs, with the greening
coverage ratios of 2%, 25%, 50%, 75%, and 100%, were built, as shown in Figure 11a. Figure 11b
presents the cooling performance of each scenario (at 15:00), where cooling performance in Case‐2%
is negligible and the cooling performance in Case‐25% was only about 0.1 °C. With the further
increase in greening coverage ratio, the cooling performance was improved and expanded to
downward areas simultaneously. For Case‐100%, the central area of the neighborhood was cooled
up to 0.5 °C. This indicates green roof can form a cool source, like a “cool island”, to isolate the outside
Int. J. Environ. Res. Public Health 2019, 16, 179 11 of 20
heats when the greening area is large enough [22]. In our study, the cooling effects of green roof were
not significant as other studies in which cooling performance exceeded 1 °C, which might be due to
the larger coverage areas in other studies [51–53].
(a)
(b)
Figure 11. Comparison of the impact of greening coverage ratio on green roof cooling performance
(a) Physical models, and (b) pedestrian air temperature reduction at 15:00 h.
Likewise, the cooling performances of different types of green roof at five test points were
examined, as shown in Figure 12. In Figure 12a, a higher greening coverage ratio corresponded to a
better cooling performance. Meanwhile, the green roof in all scenarios showed the best cooling
performance at the point‐1, followed by point‐2, point‐3, point‐4 and point‐5. Cooling performance
of Case‐100% at point‐1 exceeded 0.6 °C, while the cooling performances of all green roofs, including
Case‐100%, at point‐5 were less than 0.1 °C consistently. In particular, when the greening coverage
ratio was 25%, we can observe that temperature reduction at point‐3 was higher than that at other
points. This might be because of its shortest horizontal distance from the rooftop greenery (circled
zones in Figure 11a).
As shown in Figure 12b, the greening only on one building (Case‐2%) was not capable of
decreasing surrounding air temperature. With the greening coverage ratio increasing to 25% from
2%, the cooling performance increased. However, the cooling performance of green roof was also
limited when greening coverage ratio increased to a certain value. It is indicated that cooling
performance of green roof in Case‐75% was close to that in Case‐100%. There was still an increase in
green roof cooling performance with greening coverage ration increasing from 50% to 75%.Int. J. Environ. Res. Public Health 2019, 16, 179 12 of 20
Therefore, the threshold value of 75% for greening coverage ratio in this study is higher than the
suggested value of 50% in Mumbai, India [54], on account of constant greening ratio on the ground.
Therefore, in practice, the greenery coverage ratio can be set between 25% and 75% for the aspect of
cost‐efficiency.
(a) (b)
Figure 12. Average air temperature reduction in different greening coverage ratio scenarios. (a) Daily
average air temperatures at five test points, and (b) daily variations of average air temperature of five
test points from 07:00 to 06:00 h of the next day.
4.3. Effect of Vegetation Height of Green Roof on Pedestrain Cooling Performance
Figure 13a presents the physical model and pedestrian cooling performance at 15:00 h of green
roofs with different vegetation heights. There were five types of green roof: EGFs with 0.1 m height
grass (EGF‐0.1M), EGFs with 1 m height grass (EGF‐1M), and IGFs with 1 m, 3 m, and 6 m height
trees (IGF‐1M, IGF‐3M and IGF 6M). The coverage ratios of all roofs were 100%.
From Figure 13b, it is observed that EGF‐0.1M, EGF‐1M, IGF‐1M, IGF‐3M, and IGF‐6M could
yield maximum cooling performances up to 0.10, 0.16, 0.24, 0.53, and 0.61 °C respectively, and the
surrounding environment would be visibly improved with the increase in vertical greening height.
The increase of greening height can not only provide more shade but also enhance the transpiration
by foliage, so that heightening vertical greening is also an effective approach to decreasing the local
temperature.
According to Figure 14a, the cooling performances of green roof at five points showed a constant
increase with the increasing vertical greening height. The most significant cooling performance of 0.8 °C
could be observed at point‐1 when the greening height was 6 m. For the EGFs in this study, however,
their cooling performances at point‐4 and point‐5 were negligible, with a temperature reduction of
less than 0.1 °C. Comparing EGF‐1M and IGF‐1M, the cooling performances of IGF‐1M were better
than EGF‐1M at five points, indicating that different types of green roof generated notably diverse
cooling impacts on pedestrian‐level temperature [22].
Figure 14b presents the variations of average temperature reduction of five test points in a day.
Apart from the morning time, all types of green roofs witnessed their best cooling performances at 17:00.
This is in the agreement with the phenomenon that a higher leaf area index, a denser and more
complex vegetation structure of IGF can weaken more heat strength because of foliage solar shading
and passive cooling by evapotranspiration [16,55–57]. For this reason, enhancing cooling air
production via evapotranspiration and increasing more shade to prevent direct solar exposure are
conducive to alleviate local heat stress. Comparing the cooling performance of different types of
green roofs, IGFs exhibited better cooling performance than EGFs, while only a slight increase could
be observed from IGF‐1m to IGF‐1M when considering the average temperature reduction of five test
points. However, from IGF‐1M to IGF‐3M and then IGF‐6M, a significant increase in cooling
performance could be observed. Cooling performance of IGF‐6M was about 0.2 °C higher than thatInt. J. Environ. Res. Public Health 2019, 16, 179 13 of 20
of IGF‐3M, which was about 0.2 °C higher than that of IGF‐1M, as well. Therefore, for better cooling
performance, adopting IGFs with higher heights is suggested.
(a)
(b)
Figure 13. Comparison of the impact of vertical greening height on green roof cooling performance
(a) Physical models, and (b) pedestrian air temperature reduction at 15:00 h.
(a) (b)
Figure 14. Average air temperature reduction in different vegetation height scenarios. (a) Daily
average air temperatures at five test points, and (b) daily variations of average air temperature of five
test points from 07:00 to 06:00 hof the next day.Int. J. Environ. Res. Public Health 2019, 16, 179 14 of 20
4.4. Effect of Building Height on Green Roof Cooling Performance
This section examines the impact of building height on the green roof’s cooling performance.
Because of the variation of building height, the dimension of computation domain was altered to 200
m, but the vertical grid (Δz) remained at 2 m. The base case had the average building height of 10 m
and covered no vegetation. Afterwards, the same EGFs on three different height building groups
were used: E1M‐H10 (buildings with average height of 10 m and covered with 1 m grass), E1M‐H20
(buildings with average height of 20 m and covered with 1 m grass), and E1M‐H30 (buildings with
average height of 30 m and covered with 1 m grass). At the same time, same IGFs on four different
height building groups were used: I3M‐H10 (buildings with average height of 10 m and covered with
3‐m trees), I3M‐H20 (buildings with average height of 20 m and covered with 3‐m trees), I3M‐H40
(buildings with average height of 40 m and covered with 3‐m trees), and I3M‐H60 (buildings with
average height of 60 m and covered with 3‐m trees), as shown in Figure 15a.
As shown in Figure 15b, cooling performances of green roofs gradually faded away as the
increase of building height. This is consistent with the conclusions that as the increase in vertical
distance from green roof to the ground, the influence of green roof on pedestrian‐level thermal
environment decreases [58]. It is worth noting with the increase of building height, EGFs showed
larger influencing areas in the downwind zones (e.g., the grey zones in E1M‐H10 and E1M‐H20),
which might be in relation to the shading effects of higher buildings. Same trend could be found in
IGF scenarios. Due to stronger evapotranspiration and shading effects of IGFs, the cooling areas were
larger than that of EGFs. Nevertheless, this trend will be invalid due to the increase of building height,
considering the fact that green roofs exert negligible effects on pedestrian air temperature when
building height exceeds 60 m [21]. An existing study has suggested that green roofs are not useful in
high‐rise area for cooling pedestrian air temperature [21]. However, this conclusion may not be valid,
as wind can enhance green roof cooling performance in downwind areas. This has also been
evidenced in previous studies via remote sensing technology [51,52].
(a)
(b)
Figure 15. Comparison of the impact of building height on green roof cooling performance (a)
Physical models, and (b) pedestrian air temperature reduction at 15:00 h.Int. J. Environ. Res. Public Health 2019, 16, 179 15 of 20
As shown in Figure 16a, the cooling effects of green roof decreased with the increase of building
height. At point‐1, the cooling effects were gradually weakened by increasing building height, and
there were slight differences among the cooling performances of I3M‐H10, I3M‐H20, and I3M‐H40.
However, at point‐2 and point‐3, I3M‐H10, I3M‐H20, and I3M‐H40 showed an increasing cooling
performance difference. At other points, the cooling performances of green roofs were negligible.
Moreover, cooling performances of different green roofs decreased gradually from point‐1 to point‐
5. In particular, the cooling performance of I3M‐H10 at point‐1 reached 0.6 °C, while it decreased to
negligible (less than 0.1 °C) at point‐5. For I3M‐H60, it could exert cooling effects on point‐1 and
point‐2, with the values of 0.4 °C and 0.2 °C, respectively, while at point‐3, point‐4, and point‐5, the
cooling performances were negligible.
Figure 16b also shows green roofs with higher building height had weaker cooling effects on
pedestrian air temperature. In the night time, I3M‐H10 exhibited stable cooling effects around 0.35 °C,
about 0.2 °C higher than that of I3M‐H‐60. Likewise, E1M‐H10 generated the cooling performance of
0.2 °C, followed by that of E1M‐H20 (about 0.1 °C), and E1M‐H40 (about 0.05 °C). At the time of
sunrise and sunset, green roofs achieved their peak cooling performance. However, at 14:00 h, lower
buildings (E1M‐H10 and I3M‐H10) exhibited lower cooling performances, as compared with other
EGFs and IGFs built on higher buildings. This may be because more solar radiation can enter the
bottom of shallow street canyon, while higher buildings can shelter the ground from solar radiation [7].
Therefore, in the daytime, the pedestrian cooling performance of green roofs is affected by both
building shading effects and vegetation shading and evapotranspiration effects.
In addition, in the scenario of I3M‐H60, it is of interest to observe that cooling performances of
green roof at point‐1 and point‐2 could reach 0.42 °C and 0.24 °C, respectively (Figure 16a). This result
is in contrast with the conclusion that green roofs play a negligible role in pedestrian temperature
reduction when building height exceeds 60 m [24]. Likewise, at point‐1 and point‐2, the cooling
performance of green roof could reach 0.2 °C and 0.1 °C in the scenario of E1M‐H40 (Figure 16a). It is
concluded that the height limit of buildings upon which green roof is located varies with target locations,
which is in relation to the wind effects [28,49]. Based on the average temperature of five points at 14:00 h
(Figure 16b), we can further conclude that the building orientation, through influencing the pedestrian‐
level solar exposure, becomes another factor affecting the building height limit, exceeding which green
roofs show no differences in terms of cooling performance [7].
(a) (b)
Figure 16. Average air temperature reduction in different building height scenarios. (a) Daily average
air temperatures at five test points, and (b) daily variations of average air temperature of five test
points from 07:00 to 06:00 h of the next day.Int. J. Environ. Res. Public Health 2019, 16, 179 16 of 20
4.5. Cooling Performances in All Scenarios
Above sections have analyzed the impacts of greening layout, coverage ratio, vegetation height,
and building height on pedestrian cooling performances of green roofs. Table 3 further summarizes
the air temperature reduction at five points under different scenarios. From the temperature
reduction at five points, it is observed overall that green roofs exerted moderate cooling effects on
the environment at the pedestrian level compared with other cooling strategies and techniques of
cool pavements, water bodies, and urban forests. Nevertheless, green roofs could also generate the
most favorable cooling performance of 0.82 °C at the point‐1 in the IGF‐6M scenario. Green roofs
could generally generate cooling performances of 0.10–0.30 °C at point‐1, point‐2, and point‐3, while
the cooling performances were primarily less than 0.10 °C at point‐4 and point‐5. Meanwhile,
temperature reduction generally followed the pattern of point‐1 > point‐2 > point‐3 > point‐4 and
point‐5, except for Case‐Right, Case‐Bottom, Case‐Wind, and Case‐25%. This further shows that
downwind side is generally the most advantageous part to enjoy the cooling performance of green
roofs [28,49]. From the average temperature of five points, it is found that the cooling performances
(T24h) were generally low, at around 0.10–0.30 °C. Nevertheless, Case‐Wind, Case‐100%, IGF‐6M, and
I3M‐H10 were the most favorable scenarios in different categories, with T24h of 0.26, 0.35, 0.46, and
0.35 °C, respectively. For practically enhancing pedestrian cooling performance of green roofs,
therefore, it should combine the conditions of wind, higher coverage, higher vegetation height, and
lower building height.
Table 3. A summary of pedestrian cooling performance of green roof in different scenarios.
Average Temperature of
Daily Average Temperature (°C)
Scenarios Five Points (°C)
1 2 3 4 5 T24h Tmax Tmin
Left 0.29 0.18 0.10 0.07 0.02 0.13 0.29 0.02
Upper 0.32 0.08 0.03 0.02 0.01 0.09 0.32 0.01
Layout Right 0.24 0.27 0.20 0.11 0.02 0.17 0.27 0.02
Bottom 0.27 0.38 0.35 0.11 0.02 0.22 0.38 0.02
Wind 0.37 0.43 0.34 0.11 0.02 0.26 0.43 0.02
Case 2% 0.01 0.01 0.02 0.02 0.01 0.01 0.02 0.01
Case 25% 0.16 0.25 0.29 0.08 0.02 0.16 0.29 0.02
Coverage ratio Case 50% 0.37 0.44 0.31 0.08 0.02 0.24 0.44 0.02
Case 75% 0.57 0.49 0.38 0.13 0.05 0.32 0.57 0.05
Case 100% 0.63 0.51 0.40 0.14 0.06 0.35 0.63 0.06
EGF‐0.1M 0.15 0.13 0.10 0.05 0.03 0.10 0.15 0.03
EGF‐1M 0.25 0.21 0.17 0.06 0.03 0.15 0.25 0.03
Vegetation height IGF‐1M 0.39 0.32 0.25 0.07 0.04 0.21 0.39 0.04
IGF‐3M 0.63 0.51 0.40 0.14 0.06 0.35 0.63 0.06
IGF‐6M 0.82 0.66 0.51 0.21 0.12 0.46 0.82 0.12
E1M‐H10 0.25 0.21 0.17 0.06 0.03 0.15 0.25 0.03
E1M‐H20 0.23 0.17 0.11 0.04 0.02 0.12 0.23 0.02
E1M‐H40 0.19 0.11 0.04 0.02 0.01 0.07 0.19 0.01
Building height I3M‐H10 0.63 0.51 0.40 0.14 0.06 0.35 0.63 0.06
I3M‐H20 0.59 0.42 0.24 0.08 0.05 0.28 0.59 0.05
I3M‐H40 0.54 0.33 0.10 0.05 0.04 0.21 0.54 0.04
I3M‐H60 0.42 0.25 0.05 0.03 0.01 0.15 0.42 0.01Int. J. Environ. Res. Public Health 2019, 16, 179 17 of 20
5. Conclusions
This paper investigated the effect of morphological characteristics (greening layout, greening
coverage ratio, vegetation height, and building height) of green roofs on pedestrian cooling
performances in a real neighborhood in the subtropical city of Hangzhou, based on field
measurement and numerical simulations. Based on the analysis in this study, the following
conclusions can be drawn.
1. Overall, green roofs could generate a moderate cooling performance at the pedestrian level,
while the most favorable cooling performance could reach up to 0.82 °C. To better utilize green
roofs for pedestrian cooling, it is essential to simultaneously control the wind, greening layout,
coverage ratio, vegetation height, and building height.
2. Installing green roofs in upwind zones was favorable for pedestrian‐level cooling, while green
roofs in the downwind zones could only exert limited cooling effects. Overall, the cooling
performance of green roof followed the pattern of Case‐Wind > Case‐Upper > Case‐Left > Case‐
Bottom > Case‐Right.
3. A green roof with a low greening coverage ratio was not useful to improve pedestrian thermal
environment. The cooling performance increased with the increasing coverage ratio, but the
cooling performance reached a threshold when the coverage ratio increased to a certain value.
Nevertheless, a neighborhood with a high coverage ratio could experience a “cool island” in the
central area. In addition, the horizontal distance from green roofs to the target location could
also influence the pedestrian cooling performance, where a short distance corresponded to a
better cooling performance.
4. Vegetation height played a critical role in improving green roof cooling performance. IGFs
exhibited better cooling performances than EGFs, and the increase in vegetation height resulted
in better cooling performances. The cooling effects of IGF‐6M on the whole area could reach 0.5 °C,
and more than 0.3 °C at 14:00 h. However, when greening height was under 1 m, the cooling
effects of green roofs were insignificant.
5. Building height was also an important factor affecting green roof cooling performance. With the
increase of building height, the cooling effects of green roofs generally showed a trend of
decrease. At this time, however, buildings and vegetation had combined effects, where higher
buildings and vegetation could generate stronger cooling effects at the noon time. Moreover,
because of wind effects and building shading, the building height limit for the cooling
performance of green roofs was increased.
Author Contributions: G.Z. and B.‐J.H. analyzed data and wrote this paper. G.Z. and B.J.D. conceived the
research methodology. G.Z. conducted the field measurement and numerical simulation. Z.Z. assisted in the
numerical model establishment. G.Z. and B.J.D. assisted in paper review and editing.
Funding: This research received no external funding.
Acknowledgments: The authors gratefully acknowledge support from the PhD training program of Zhejiang
Industry Polytechnic College and a scholarship from the University of Kitakyushu. Many thanks also go to the
University of New South Wales, Australia, for the Research Training Program (RTP) scholarship. In addition,
Gaochuan Zhang appreciates Chi Fangai’s inspiration in studying for a PhD.
Conflicts of Interest: The authors declare no conflict of interest.
References
1. He, B.‐J.; Zhao, Z.‐Q.; Shen, L.‐D.; Wang, H.‐B.; Li, L.‐G. An approach to examining performances of
cool/hot sources in mitigating/enhancing land surface temperature under different temperature
backgrounds based on Landsat 8 image. Sustain. Cities Soc. 2019, 44, 416–427.
2. Yang, J.; Sun, J.; Ge, Q.; Li, X. Assessing the impacts of urbanization‐associated green space on urban land
surface temperature: A case study of Dalian, China. Urban For. Urban Green. 2017, 22, 1–10.Int. J. Environ. Res. Public Health 2019, 16, 179 18 of 20
3. Yang, K.; Pan, M.; Luo, Y.; Chen, K.; Zhao, Y.; Zhou, X. A time‐series analysis of urbanization‐induced
impervious surface area extent in the Dianchi Lake watershed from 1988–2017. Int. J. Remote Sens. 2018, 1–20.
doi:10.1080/01431161.2018.1516312.
4. Yang, J.; Guan, Y.; Xia, J.C.; Jing, C.; Li, X. Spatiotemporal variation characteristics of green space ecosystem
service value at urban fringes: A case study on Ganjingzi District in Dalian, China. Sci. Total Environ. 2018,
639, 1453–1461.
5. Stewart, I.D.; Oke, T.R. Local climate zones for urban temperature studies. Bull. Am. Meteorol. Soc. 2012, 93,
1879–1900.
6. Shahmohamadi, P.; Che‐Ani, A.; Maulud, K.; Tawil, N.; Abdullah, N. The impact of anthropogenic heat on
formation of urban heat island and energy consumption balance. Urban Stud. Res. 2011, 2011, 497524.
7. Oke, T.R. City size and the urban heat island. Atmos. Environ. 1973, 7, 769–779.
8. Goggins, W.B.; Chan, E.Y.; Ng, E.; Ren, C.; Chen, L. Effect modification of the association between short‐
term meteorological factors and mortality by urban heat islands in Hong Kong. PLoS ONE 2012, 7, e38551.
9. Santamouris, M.; Haddad, S.; Saliari, M.; Vasilakopoulou, K.; Synnefa, A.; Paolini, R.; Ulpiani, G.;
Garshasbi, S.; Fiorito, F. On the energy impact of urban heat island in Sydney: Climate and energy potential
of mitigation technologies. Energy Build. 2018, 166, 154–164.
10. McGeehin, M.A.; Mirabelli, M. The potential impacts of climate variability and change on temperature‐
related morbidity and mortality in the United States. Environ. Health Perspect. 2001, 109 (Suppl. 2), 185.
11. Gago, E.J.; Roldan, J.; Pacheco‐Torres, R.; Ordóñez, J. The city and urban heat islands: A review of strategies
to mitigate adverse effects. Renew. Sustain. Energy Rev. 2013, 25, 749–758.
12. Wang, J.; Meng, Q.; Tan, K.; Zhang, L.; Zhang, Y. Experimental investigation on the influence of evaporative
cooling of permeable pavements on outdoor thermal environment. Build. Environ. 2018, 140, 184–193.
13. He, B.‐J. Potentials of meteorological characteristics and synoptic conditions to mitigate urban heat island
effects. Urban Clim. 2018, 24, 26–33.
14. Tan, C.L.; Wong, N.H.; Tan, P.Y.; Jusuf, S.K.; Chiam, Z.Q. Impact of plant evapotranspiration rate and shrub
albedo on temperature reduction in the tropical outdoor environment. Build. Environ. 2015, 94, 206–217.
15. Susca, T.; Gaffin, S.R.; Dell’Osso, G. Positive effects of vegetation: Urban heat island and green roofs.
Environ. Pollut. 2011, 159, 2119–2126.
16. Cascone, S.; Coma, J.; Gagliano, A.; Pérez, G. The evapotranspiration process in green roofs: A review.
Build. Environ. 2018, 147, 337–355.
17. Song, J.; Wang, Z.H.; Wang, C. The Regional Impact of Urban Heat Mitigation Strategies on Planetary
Boundary‐Layer Dynamics over a Semi‐arid City. J. Geophys. Res. 2018, 123, 6410–6422.
18. Sharma, A.; Conry, P.; Fernando, H.J.S.; Hamlet, A.F.; Hellmann, J.J.; Chen, F. Green and cool roofs to
mitigate urban heat island effects in the Chicago metropolitan area: Evaluation with a regional climate
model. Environ. Res. Lett. 2016, 11, 064004.
19. Li, D.; Bou‐Zeid, E.; Oppenheimer, M. The effectiveness of cool and green roofs as urban heat island
mitigation strategies. Environ. Res. Lett. 2014, 9, 055002.
20. Cox, B.K. The Influence of Ambient Temperature on Green Roof R‐Values. Master’s Thesis, Portland State
University, Oregon, Portland, 2010.
21. Ng, E.; Chen, L.; Wang, Y.; Yuan, C. A study on the cooling effects of greening in a high‐density city: An
experience from Hong Kong. Build. Environ. 2012, 47, 256–271.
22. Peng, L.L.; Jim, C. Green‐roof effects on neighborhood microclimate and human thermal sensation. Energies
2013, 6, 598–618.
23. Abuseif, M.; Gou, Z. A Review of Roofing Methods: Construction Features, Heat Reduction, Payback
Period and Climatic Responsiveness. Energies 2018, 11, 3196.
24. Morakinyo, T.E.; Dahanayake, K.K.C.; Ng, E.; Chow, C.L. Temperature and cooling demand reduction by
green‐roof types in different climates and urban densities: A co‐simulation parametric study. Energy Build.
2017, 145, 226–237.
25. Jim, C.; Peng, L.L. Weather effect on thermal and energy performance of an extensive tropical green roof.
Urban For. Urban Green. 2012, 11, 73–85.
26. Chen, H.; Ooka, R.; Huang, H.; Tsuchiya, T. Study on mitigation measures for outdoor thermal
environment on present urban blocks in Tokyo using coupled simulation. Build. Environ. 2009, 44, 2290–
2299.Int. J. Environ. Res. Public Health 2019, 16, 179 19 of 20
27. Sodoudi, S.; Zhang, H.; Chi, X.; Müller, F.; Li, H. The influence of spatial configuration of green areas on
microclimate and thermal comfort. Urban For. Urban Green. 2018, 34, 85–96.
28. Jin, C.; Bai, X.; Luo, T.; Zou, M. Effects of green roofs’ variations on the regional thermal environment using
measurements and simulations in Chongqing, China. Urban For. Urban Green. 2018, 29, 223–237.
29. Oke, T.R. The micrometeorology of the urban forest. Phil. Trans. R. Soc. 1989, 324, 335–349.
30. Conry, P.; Sharma, S.; Potosnak, M.J.; Leo, L.S.; Bensman, E.; Hellmann, J.J.; Fernando, H.J.S. Chicago’s heat
island and climate change: Bridging the scales via dynamical downscaling. J. Appl. Meteorol. Climatol. 2015,
54, 1430–1448.
31. Yang, J.; Su, J.; Xia, J.; Jin, C.; Li, X.; Ge, Q. The Impact of Spatial Form of Urban Architecture on the Urban
Thermal Environment: A Case Study of the Zhongshan District, Dalian, China. IEEE J. Select. Top. Appl.
Earth Observ. Remote Sens. 2018, 11, 2709–2716.
32. Hangzhou Statistical Bureau. Statistical Yearbook of Hangzhou; China Statistical Press: Beijing, China, 2017.
33. He, B.; Zhu, J. Constructing community gardens? Residents’ attitude and behaviour towards edible
landscapes in emerging urban communities of China. Urban For. Urban Green. 2018, 34, 154–165.
34. Bruse, M.; Fleer, H. Simulating surface–plant–air interactions inside urban environments with a three
dimensional numerical model. Environ. Model. Softw. 1998, 13, 373–384.
35. Qaid, A.; Lamit, H.B.; Ossen, D.R.; Shahminan, R.N.R. Urban heat island and thermal comfort conditions
at micro‐climate scale in a tropical planned city. Energy Build. 2016, 133, 577–595.
36. Jonckheere, I.; Fleck, S.; Nackaerts, K.; Muys, B.; Coppin, P. Methods for leaf area index determination. Part
I: Theories, techniques and instruments. Agric. For. Meteorol. 2004, 121, 19–35.
37. Wu, Z.; Kong, F.; Wang, Y.; Sun, R.; Chen, L. The impact of greenspace on thermal comfort in a residential
quarter of Beijing, China. Int. J. Environ. Res. Public Health 2016, 13, 1217.
38. Xiao‐quan, Z.; Mao‐sheng, Z.; De‐ying, X. Spatial distribution and seasonal changes of needle‐leaf area
density within 17‐year‐old Chinese fir crown. For. Res.-Chin. Acad. For. 1999, 12, 612–619.
39. Hosoi, F.; Omasa, K. Factors contributing to accuracy in the estimation of the woody canopy leaf area
density profile using 3D portable lidar imaging. J. Exp. Bot. 2007, 58, 3463–3473.
40. Ministry of Housing and Urban‐Rural Development (MOHURD). Design Standard for Energy Efficiency of
Residential Buildings in Hot Summer and Cold Winter Zone, in Ministry of Housing and Urban-Rural
Development; China Building Industry Press: Beijing, China, 2012.
41. Zhao, D.; Zhao, X.; Khongnawang, T.; Arshad, M.; Triantafilis, J. A Vis‐NIR spectral library to predict clay
in Australian cotton growing soil. Soil Sci. Soc. Am. J. 2018, 82, 1347–1357
42. Morakinyo, T.E.; Kong, L.; Lau, K.K.‐L.; Yuan, C.; Ng, E. A study on the impact of shadow‐cast and tree
species on in‐canyon and neighborhood’s thermal comfort. Build. Environ. 2017, 115, 1–17.
43. Mou, B.; He, B.‐J.; Zhao, D.‐X.; Chau, K.‐W., Numerical simulation of the effects of building dimensional
variation on wind pressure distribution. Eng. Appl. Comput. Fluid Mech. 2017, 11, 293–309.
44. Mirzaei, P.A.; Haghighat, F. Approaches to study urban heat island–abilities and limitations. Build. Environ.
2010, 45, 2192–2201.
45. Heidarinejad, G.; Esmaili, A. Numerical simulation of the dual effect of green roof thermal performance.
Energy Convers. Manag. 2015, 106, 1418–1425.
46. Alexandri, E.; Jones, P. Temperature decreases in an urban canyon due to green walls and green roofs in
diverse climates. Build. Environ. 2008, 43, 480–493.
47. Krüger, E.; Minella, F.; Rasia, F. Impact of urban geometry on outdoor thermal comfort and air quality from
field measurements in Curitiba, Brazil. Build. Environ. 2011, 46, 621–634.
48. Jin, H.; Liu, Z.; Jin, Y.; Kang, J.; Liu, J. The effects of residential area building layout on outdoor wind
environment at the pedestrian level in severe cold regions of China. Sustainability 2017, 9, 2310.
49. Berardi, U. The outdoor microclimate benefits and energy saving resulting from green roofs retrofits.
Energy Build. 2016, 121, 217–229.
50. Moore, R.; Clark, W.D.; Vodopich, D.S. Botany; McGraw‐Hill Companies: New York, NY, USA, 2003.
51. Herrera‐Gomez, S.S.; Quevedo‐Nolasco, A.; Pérez‐Urrestarazu, L. The role of green roofs in climate change
mitigation. A case study in Seville (Spain). Build. Environ. 2017, 123, 575–584.
52. Smith, K.R.; Roebber, P.J. Green roof mitigation potential for a proxy future climate scenario in Chicago,
Illinois. J. Appl. Meteorol. Climatol. 2011, 50, 507–522.
53. Ambrosini, D.; Galli, G.; Mancini, B.; Nardi, I.; Sfarra, S. Evaluating mitigation effects of urban heat islands
in a historical small center with the ENVI‐Met® climate model. Sustainability 2014, 6, 7013–7029.Int. J. Environ. Res. Public Health 2019, 16, 179 20 of 20
54. Dwivedi, A.; Mohan, B.K. Impact of green roof on micro climate to reduce Urban Heat Island. Remote Sens.
Appl. 2018, 10, 56–69.
55. Del Barrio, E.P. Analysis of the green roofs cooling potential in buildings. Energy Build. 1998, 27, 179–193.
56. Wong, N.H.; Cheong, D.K.W.; Yan, H.; Soh, J.; Ong, C.L.; Sia, A. The effects of rooftop garden on energy
consumption of a commercial building in Singapore. Energy Build. 2003, 35, 353–364.
57. Onmura, S.; Matsumoto, M.; Hokoi, S. Study on evaporative cooling effect of roof lawn gardens. Energy
Build. 2001, 33, 653–666.
58. Berardi, U.; GhaffarianHoseini, A.; GhaffarianHoseini, A. State‐of‐the‐art analysis of the environmental
benefits of green roofs. Appl. Energy 2014, 115, 411–428.
© 2019 by the authors. Licensee MDPI, Basel, Switzerland. This article is an open access
article distributed under the terms and conditions of the Creative Commons Attribution
(CC BY) license (http://creativecommons.org/licenses/by/4.0/).You can also read