INTRODUCTION AND OVERVIEW FOR PROFESSIONAL ADVISER USE ONLY - NOT FOR USE WITH CLIENTS- FTSE 100 FDEW - Tempo Structured Products
←
→
Page content transcription
If your browser does not render page correctly, please read the page content below
PART OF THE ALPHA REAL CAPITAL FAMILY OF COMPANIES

                 - FTSE 100 FDEW -
       INTRODUCTION AND OVERVIEW
-------------------------------------------------------------
FOR PROFESSIONAL ADVISER USE ONLY
        - NOT FOR USE WITH CLIENTS -

            © COPYRIGHT 2021 TEMPO STRUCTURED PRODUCTS
Introducing the Alpha Real Capital family of companies (‘Alpha’) …
 -----------------------   Headquartered in London, Alpha Real Capital was founded in 2005 as an international,
                           co-investing, investment management and wealth management solutions business:
KEY ALPHA
STATISTICS:                - Alpha Real Capital sits at the heart of the Alpha Real Capital family of companies (‘Alpha’),
(as at 31 Mar 2020)          which benefit from common ultimate beneficial ownership
-----------------------    A 130+ professional team operates across the UK, Europe and Asia, focusing on 4 core
                           areas: i) real estate investment management; ii) long income and index-linked income; iii)
                           infrastructure, social impact and renewable energy; and iv) wealth management solutions

£4.0bn                     The ‘Alpha way’ is to identify specialist teams with expertise in areas of strategic focus
                           and interest and to support these teams to deliver best-in-class investor solutions:
AUM
                           - Alpha teams benefit from centralised resources, including: financial; operational; compliance;
                             research; marketing; business development and capital-raising
130+                         … and from Alpha’s fundamental interest to ‘do the right things’
Professional team
                           The ‘Alpha DNA’ is evident across the Alpha range of funds, products and services:

4                          - Alpha aims to offer attractive risk / return profile investments for investors, with exemplary
                             support and service for business partners, professional advisers and investors
Core areas
                           Alpha engages with institutional investors, professional investors (including family
                           offices, UHNW and HNW private investors) and professionally advised retail investors:

-----------------------    - on the retail side, Alpha operates through TIME Investments and Tempo Structured Products

                                               © COPYRIGHT 2020 TEMPO STRUCTURED PRODUCTS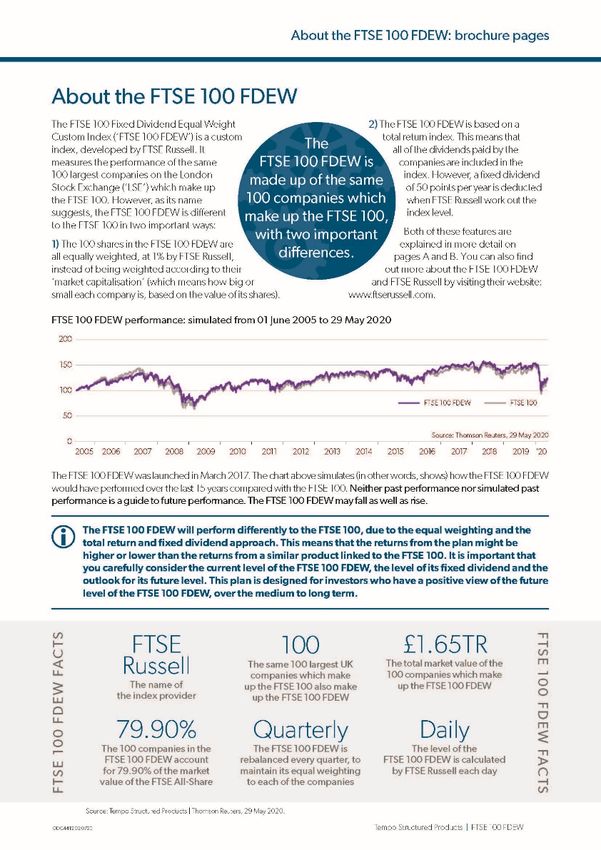
Contents …
A brief introduction to and overview of smart beta:
- alternatives and complements to both passive and active fund management
- founded upon academic research and evidence: designed to meet specific investor interests
- recognising rules, factor exposures and potential issues embedded implicitly in market capitalisation weighting
- highlighting the difference between incontrovertible market benchmarks and optimal passive investments
- the rise and rise of interest in and use of smart beta: global and exponential
- the main smart beta rules / factors which have emerged
- equal weighting: the straightforward attributes and potential merits | what the index providers say
- where structured products come in: implementation challenges of equal weighting for mutual funds and ETFs
The FTSE 100 FDEW:
- a FTSE Russell index: developed to provide the potential for improved structured product terms
- understanding the ‘EW’ (equal weight) and ‘FD’ (fixed dividend): which operate in tandem
- plain English investor-facing information and professional adviser collateral input and materials
- comprehensive and granular performance analysis: including comparison to the FTSE 100
- understanding the features, rules, factor exposures: including potential issues / performance risks
- use within diversified and balanced portfolios
- access and visibility
© COPYRIGHT 2021 TEMPO STRUCTURED PRODUCTS 1
Smart beta: a rules-based, factor-driven ‘third way’ …
Smart beta refers to indexes which have a rules-based, factor-driven methodology, as alternatives and
complements (a key point of balance) to indexes based on market capitalisation methodology:
- noting that while market capitalisation weighted indexes simply reflect the market as a whole, as a benchmark,
market capitalisation weighting effectively embeds some implicit rules / factor exposures for passive investors
- smart beta (sometimes referred to as ‘enhanced passive’, ‘alternative beta’ or ‘factor investing’) blurs the binary
lines between market capitalisation weighted passive and actively managed mutual funds, offering a ‘third way’
© COPYRIGHT 2021 TEMPO STRUCTURED PRODUCTS 2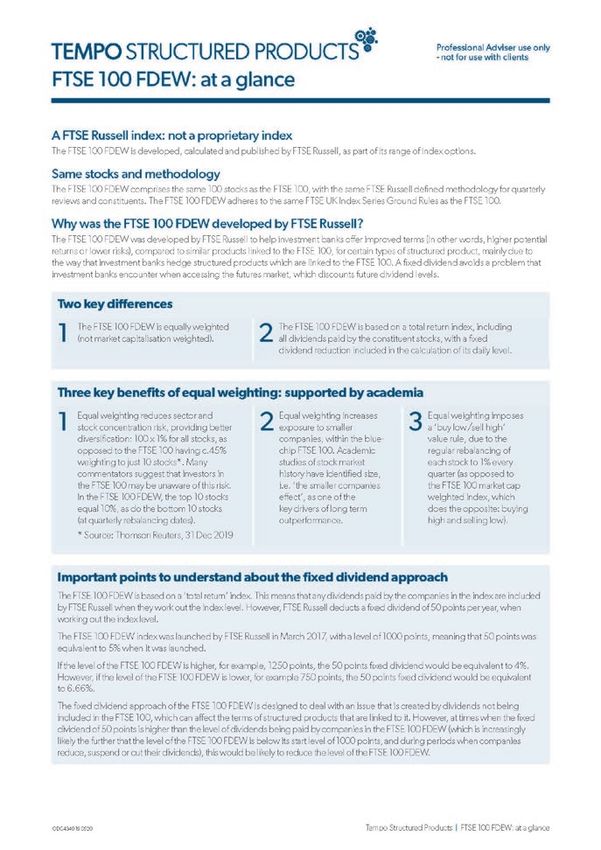
Founded upon academic research and evidence …
The ascent of passive investing is founded upon (or linked to*) academic research and evidence, the
principles of which extend to smart beta:
1. Modern Portfolio Theory (‘MPT’): Markowitz (1952):
- diversify portfolios across equities, bonds, commodities (‘the only free lunch is diversification’)
2. Capital Asset Pricing Model (‘CAPM’): Treynor (1961/62), Sharpe (1964), Lintner (1965), Mossin (1966):
- two types of risk: specific risk (company specific) / market risk (market specific)
3. Efficient Market Hypothesis (‘EMH’): Fama (1970):
- markets are efficient
- everything is in the price: all potential influences
- the only thing that can move prices is unknown information
- consistently beating markets is impossible
… *note the timeline: the EMH is often part of the rationale supporting the case for passive investing, but the
creation / inception of market capitalisation indexes pre-dates the academic studies re EMH
© COPYRIGHT 2021 TEMPO STRUCTURED PRODUCTS 3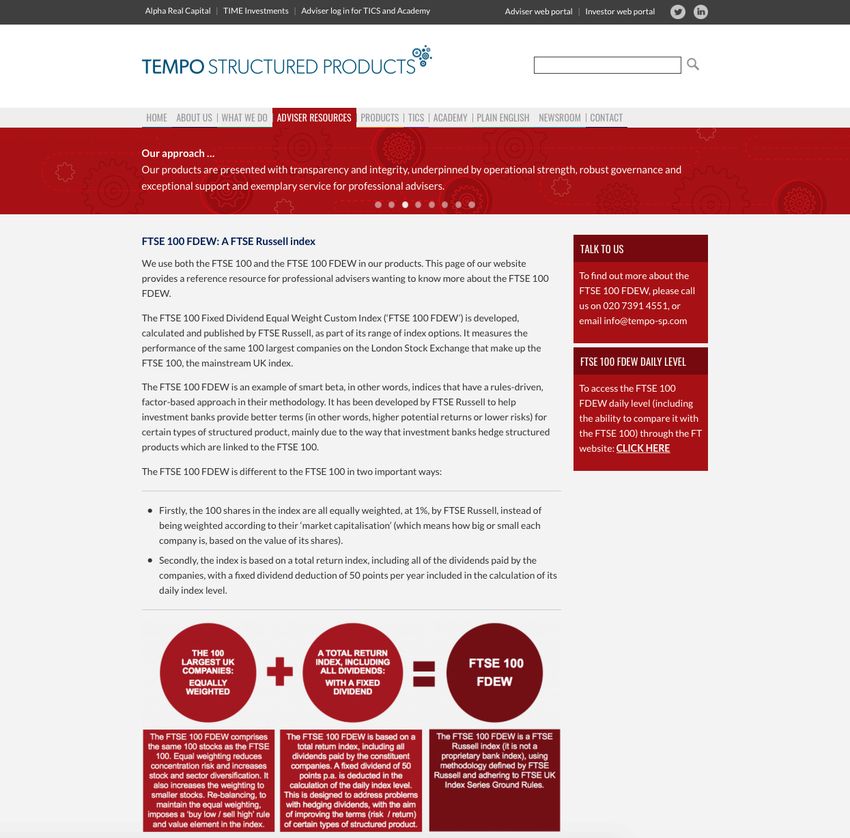
Smart beta: meeting investor perspectives and interests …
Smart beta is founded on advancing academic research and understanding of stock markets and
modern index construction capabilities, with an aim of meeting a number of investor interests:
1. From a passive / ‘beta’ perspective:
- there is increasing acceptance of the academic research and evidence behind passive investing, the
principles of which also extend to smart beta investing
- there is increasing understanding that market capitalisation index methodology effectively / implicitly embeds
some features / rules / factors which can be seen as potential issues for passive investors:
… and that indexation / passive investing doesn’t start and stop with just market capitalisation weighting
2. From an active / ‘alpha’ perspective:
- there is increasing recognition that ‘factors’ (as opposed to fund manager skill) can drive active fund
management ‘alpha’
- there is increasing understanding that some of these factors can be isolated, replicated and accessed more
efficiently, effectively and reliably through passive smart beta indexes
3. From a cost perspective:
- there is increasing focus on cost: particularly in a potentially low returns investment environment
© COPYRIGHT 2021 TEMPO STRUCTURED PRODUCTS 4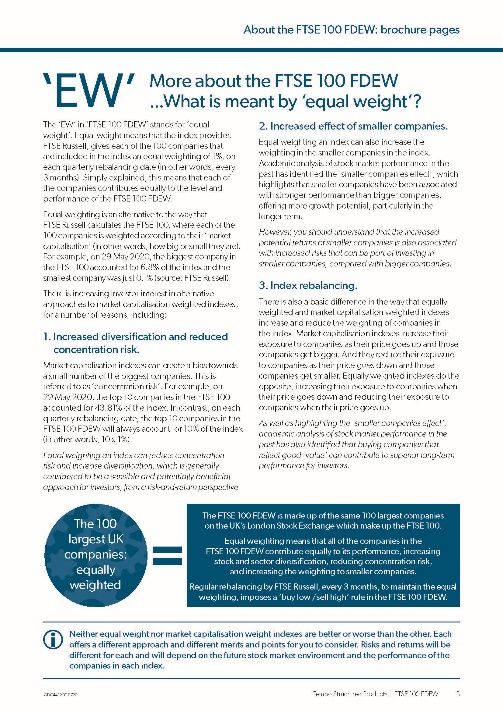
Rules / factors / issues implicit in market capitalisation weighting …
Market capitalisation weighted indexes reflect the market as a whole, as ‘market benchmarks’: the merits
of which are widely recognised, evidenced and accepted:
- however, it is important to recognise that market capitalisation weighted indexes implicitly embed some features
/ rules / factor exposures - and potential issues - as ‘passive investments’, which investors need to consider:
1. Market capitalisation weighted indexes can lead to concentration risk, at a stock and sector level:
- for example, in the FTSE 100, the top company may typically account for as much as c.5-10%, the top 5
companies for c.20-30% and the top 10 companies for c.35-50% of the index
- academia evidences the importance of diversification: and grandma (aka common sense) also always
suggested that it simply isn’t a good idea to have too many of your eggs in one basket
2. Market capitalisation weighted indexes can ‘underweight’ the smaller companies:
- for example, in the FTSE 100, while all the companies are considered large, the bottom company may account
for as little as c.0.1% and the bottom 10 companies for just c.2.5 - 3.5% of the index:
… notably, more than 70 companies are typically weighted at less than 1% in the FTSE 100
- academia identifies the ‘small companies effect’: historically, small companies have outperformed medium and
large companies, over the long term (in smart beta terminology, this is considered the ‘size’ factor)
3. Market capitalisation weighted indexes embed a ‘buy high / sell low’, ‘momentum’ approach, as a rule:
- market capitalisation weighted indexes increase the weighting in companies as their share prices increase and
decrease the weighting in companies as their share prices decrease (i.e. an element of the ‘momentum’ factor)
- some investors may consider this approach / rule to be at odds with a fundamental aim of ‘buying low / selling
high’ when investing in the stock market (i.e. an element of the ‘value’ factor)
* Source: Thomson Reuters 31 Dec 20. © COPYRIGHT 2021 TEMPO STRUCTURED PRODUCTS 5
Market capitalisation reflects the market as a whole and its beta …
Despite highlighting the rules / factor exposures and potential issues embedded implicitly in market
capitalisation weighted indexes, market capitalisation weighted indexes rationally and incontrovertibly
represent the market as a whole, as ‘market benchmarks’ and the ‘beta’ of the market:
- any decision to invest any other way is a ‘tilt’ away from the natural construction and beta of the market as a
whole: hence smart beta phraseology: e.g., ‘alternative beta’, ‘strategic beta’, ‘factor investing’, ‘factor tilts’, etc.
Further, despite highlighting the rules / factor exposures and potential issues which are embedded
implicitly in market capitalisation weighted indexes for investors, it should also be recognised that:
- concentration, as opposed to diversification, may benefit index performance, if the performance of the
companies which an index is concentrated in are driving the market’s performance (a good example of this can
be seen in the US S&P 500 in 2020, which was largely driven by the ‘FAANG’ stocks)
- a focus on larger capitalisation companies and less exposure to smaller capitalisation companies in an index
may benefit performance, risk / volatility, liquidity, costs, etc.
- and ‘buying high / selling low’, as an element of the ‘momentum’ rule may help drive index performance
However, while market capitalisation weighted indexes rationally and incontrovertibly represent the
market as a whole as market benchmarks, it does not automatically or necessarily follow that market
capitalisation weighted indexes are also the optimal - or only - way to invest passively in the market:
- stock market indexes and passive investing did not start and certainly do not stop with market capitalisation
weighted indexes
- it’s interesting to think about and understand when and why stock market indexes were conceived and why
market capitalisation weighting became the market benchmarks: and to consider these points …
© COPYRIGHT 2021 TEMPO STRUCTURED PRODUCTS 6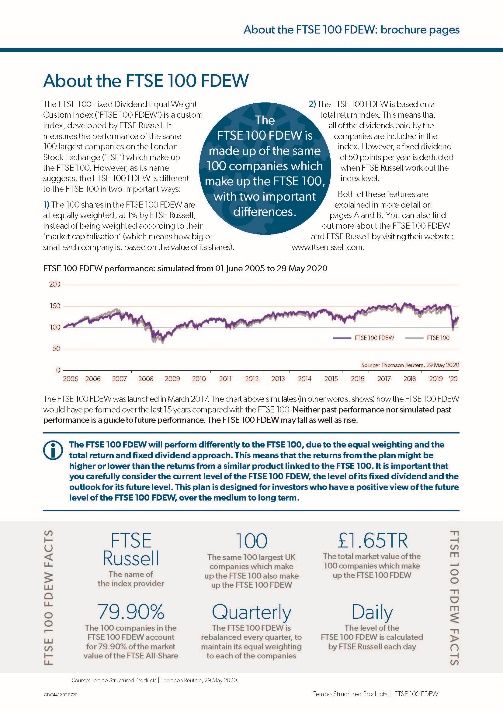
The history of market indexes and market capitalistion weighting …
To understand when and why market capitalisation weighting became market benchmarks - and also the
default index methodology for passive investors - it is helpful to look at the history of indexes:
1. Charles Dow, the editor of the Wall Street Journal, devised and first calculated the price weighted Dow
Jones Industrial Average (‘DJIA’) in 1896:
- keeping things simple a century ago, Dow simply took a basket of large US stocks and weighted them by price
- the problem with this methodology was (and still is) that a stock priced at $50 is weighted at twice that of a
stock priced at $25 … regardless of any fundamentals (such as market capitalisation) or investment merit
2. Standard & Poor’s conceived the S&P 500 in 1923, but its market capitalisation weighted approach took
form in 1957 (note that timeline anomaly: pre academic studies into and consideration of EMH):
- the aim was also simple, to reflect the market as whole and the experience of investors in the market as a
collective: the index evolved was market capitalisation weighted, based on the straightforward and perfectly
rational calculation of the number of shares in issue for each company in the index multiplied by their price
- similar to the DJIA, this methodology results in a stock with a market cap of $50bln being weighted at twice that
of a stock with a market capitalisation of $25bln … regardless of any other fundamentals or investment merit
3. In the UK, the FT 30 (originally known as the FN30) was established in 1935, on an equally weighted
basis, while the market capitalisation FTSE All-Share dates back to 1962 and the FTSE 100 to 1984
4. MSCI (formerly Morgan Stanley Capital International) introduced the MSCI World index in 1969, as a
market capitalisation weighted index for global stocks (c.1,600 large and mid cap, across 23 countries)
© COPYRIGHT 2021 TEMPO STRUCTURED PRODUCTS 7Is market capitalisation weighting the optimal passive investment …
Market capitalisation weighted indexes were conceived as ways to publish information for the market as
a whole: providing a representation of the returns of shareholders in the market, as a whole:
- all free float shares of companies in an index, multiplied by their price = the value of the market
- market capitalisation weighted indexes rationally and incontrovertibly represent the market as benchmarks
However, market capitalisation weighted indexes were never conceived or designed as ways to invest in
the market or expected to become passive investment strategies for investors to seek to replicate:
- arguably, despite their merits, market capitalisation weighted indexes became the default index methodology
for passive investors as an accident of history: they came first / existed and there were no alternatives / choices
- the fact is that market capitalisation weighted indexes were conceived before advanced academic studies of
stock markets / investing (e.g., EMH) and before advanced / modern index construction capabilities
Advancing academic research and understanding regarding investing in markets and modern index
construction capabilities mean that there are now various alternatives and complements to market
capitalisation indexes as ways to invest passively in the market, in diversified and balanced portfolios:
- it’s interesting to consider what might have happened back in the 1950s - 1970s had there been the academic
research and understanding of the stock market, different ways to invest in it and better index capabilities:
… conceivably, what might have happened in the past, is what is happening now …
- it’s also interesting to imagine how market capitalisation weighted index methodology might be presented and
regarded if it was presented as a smart beta proposition …
© COPYRIGHT 2021 TEMPO STRUCTURED PRODUCTS 8Imagine the pitch for market capitalisation weighting …
It’s interesting and thought provoking to imagine how market capitalisation weighted index methodology
might be presented and regarded if it was presented as a smart beta proposition:
- imagine that you are a professional adviser / investor happily using an equal weight version of the FTSE 100
- FTSE Russell contact you, explaining that they are launching a market capitalisation weighted FTSE 100
- they provide you with detailed input and discuss the academic evidence, highlighting that implementing market
capitalisation weighting as a rules-based index methodology, as an alternative to equal weighting, will result in:
… stock (and potentially sector) concentration: despite academia evidencing the merits of diversification
… underweighting the smaller companies: despite academia identifying that small companies historically
outperform large companies, i.e. the small companies effect
… increasing the weighting in companies when their share prices rise and decreasing the weighting in
companies when their share prices go down, i.e., buying high and selling low
… oh, and best point last, they highlight that historical analysis shows that market capitalisation weighting the
FTSE 100 means that, more times than not, it may underperform the elegantly simple equal weight version
- they can, however, now draw attention to EMH: markets are efficient; everything is in the price; the only thing
that can move prices is unknown information; consistently beating markets is impossible:
… you, however, may counter that while it is, of course, interesting to consider the principles of EMH, there is
no information value to knowing everything is in the price: it doesn’t lead to the ability to actually forecast
anything about future performance … and that, arguably, points to the agnostic case for equal weighting
© COPYRIGHT 2021 TEMPO STRUCTURED PRODUCTS 9The rise and rise of interest in and use of smart beta …
The rise and rise of interest in Investors in smart beta include
and use of smart beta sovereign wealth funds, institutions,
has been global and exponential pension funds and retail investors
In the US, smart beta interest and use In Europe, smart beta interest and use
was initially led by retail investors was initially led by institutional investors
Investors see smart beta Funds flowing into smart beta
as a viable alternative and complement to include new monies and monies moving from
both passive index and actively managed funds both passive index and actively managed funds
A significant percentage of institutional investors A significant percentage of institutional investors
already include smart beta in portfolios anticipate increasing smart beta in portfolios
Major asset managers such as Smart beta AUM globally
BlackRock, Vanguard and State Street surpassed $1tn
dominate global smart beta AUM in December 2017
* Source: State Street Global investors: ‘Beyond Active and Passive’ Survey of Institutional Investors in Europe and North America 10The main smart beta rules and factors which have emerged …
Smart beta refers to an almost countless number of rules and factors (300+*):
- many smart beta rules / factors are technical and specialist
- a small number of widely recognised smart beta rules and factors have emerged
EQUAL WEIGHT / SIZE QUALITY
The same companies as the market Companies selected on the basis of strong
capitalisation index: but equally weighted balance sheets, profit margin, etc.
DIVIDENDS MOMENTUM
Companies selected on the basis of high
dividends, stability and growth of dividends, Companies selected on the basis of strong
etc. recent / current (3-12 mths) performance
VOLATILITY STYLE
Companies selected on the basis Companies selected on the basis of style
of low historical volatility / beta characteristics, such as ‘value’ / ‘growth’
* Source: FTfm Smart Beta: What’s in a Name, Nov 17 © COPYRIGHT 2021 TEMPO STRUCTURED PRODUCTS 11Focusing on equal weighting …
Equal weighting is generally considered to be the most obvious and simple / straightforward alternative
to market capitalisation weighting methodology of an index
The features, rules and factor exposures explicit in equally weighted indexes can effectively reverse
features, rules and factor exposures embedded implicitly in market capitalisation weighted indexes:
1. concentration risk at company (and potentially sector) level is exchanged for diversification:
… for example, in the FTSE 100, 100 x 1% weights means the top 10 companies account for 10% in total
2. the exposure to smaller companies in an index, which may be considered ‘underweight’, are equalised:
… for example, in the FTSE 100, 100 x 1% weights means the bottom 10 companies account for 10% in total
(as per the top 10): in the FTSE 100, over 70 companies may increase weighting when equally weighted
3. periodic rebalancing to maintain equal weighting embeds a ‘buy low / sell high’ approach, as a rule:
… in contrast to market capitalisation weighting, which does the opposite
Many mainstream index providers recognise the academic and real-world merits of equal weighting and
offer both market capitalisation and equally weighted methodology options on the main indexes:
… for example: FTSE 100; S&P 500; MSCI World; EuroSTOXX 50
* Source: Thomson Reuters 31 Dec 20. © COPYRIGHT 2021 TEMPO STRUCTURED PRODUCTS 12Equal weighting in the words of: FTSE Russell …
FTSE Russell says the following regarding equal weight index methodology:
- ‘FTSE Russell smart beta surveys reveal that interest in smart beta amongst asset owners has been driven
both by risk considerations (such as a wish to reduce index-level risk or to improve levels of index
diversification) and a desire to enhance return through exposure to factor risk premia’
- ‘equal-weighted indexes are one of the earliest examples of ‘smart beta’ indexes’
- ‘they have long been popular for their ability to diversify the mega-cap dominance inherent in cap-weighted
indexes’
- ‘likewise, rebalancing to equal-weight causes the index to increase the weight of stocks that have recently
declined and decrease the weight of stocks that have recently risen: this contrarian trading pattern (‘buy
low, sell high’) is a key component of the equal-weighting methodology’
- ‘equal weight index strategies are undergoing a rise in popularity’
- ‘roughly half of US financial advisers surveyed by FTSE Russell in 2015 either use or are very likely to use
an equal weight investment approach: as of December 2016, there are approximately 100 globally-listed
ETFs with $21.7 billion in assets that track a variation of an equal weight index’
(as at 31 Dec 2020, ETFGI data shows XY ETFs with $XY.Z billion based on equal weight indexes)
Source: www.ftserussell.com | www.etftrends.com | www.etfgi.com
13Equal weighting in the words of: S&P …
S&P says the following regarding equal weight index methodology:
- ‘weighting an index by companies’ market caps is a natural approach - the market itself is cap weighted so
the index return and the market return should match’
- ‘the tech boom-bust proved that on the way up cap weighting can be a strong momentum performer - on the
way down after the market turns, the index is often over-weighted in the stocks with the most to lose’
- ‘S&P began exploring other ways to weight indices’
- ‘in January 2003, S&P launched an equal weighted version of the S&P 500. Rather than weighting stocks
by market value, the index weights each stock equally’
- ‘compared to the standard S&P 500, the equal weight version over weights the smaller stocks and under
weights the larger ones’
- ‘from January 2003 to May 2019, the equal weight S&P 500 returned 9.2% per year compared to 7.3% per
year for the cap-weighted version’
Source: www.spglobal.com/en/research-insights/articles/a-look-at-index-history-part-1
14Equal weighting in the words of: MSCI …
MSCI says the following regarding equal weight methodology:
- ‘for over 35 years, MSCI has constructed the most widely used international equity indexes for institutional
investors’
- ‘in calculating its international equity indexes, MSCI employs market capitalisation weighting where each
constituent in the index is weighted by its free float-adjusted market capitalisation’
- ‘over time, investors have expressed a desire for index providers to additionally provide indexes based on
alternative weighting schemes’
- ‘the MSCI equal weighted indexes offer an alternative to market capitalisation weighted indexes’
- ‘equal weighting is a simple idea - an investor holds the same dollar value in each stock, representing an
equal part of the value of the portfolio’
- ‘equally-weighted indexes are some of the oldest and best-known factor strategies that have aimed to
identify specific characteristics of stocks generating excess return’
- ‘simply put, MSCI Equal Weighted Indexes avoid concentrating too much of the portfolio into a few large
stocks’
- ‘the result: over the Dec 2000 to mid-2015 period, equal-weighted versions of MSCI flagship indexes, such
as the MSCI USA Equal Weight, delivered significantly higher returns than their cap weighted counterparts’
Source: www.msci.com/msci-equal-weighted-indexes
15Equal weighting in the words of: Research Affiliates …
Research Affiliates says the following regarding equal weight methodology:
- ‘for over 40 years, our industry has relied on … the capitalisation weighted market portfolio for asset
allocation, for market representation and for our default core equity investments’
- ‘market capitalisation remains immensely popular as the incumbent and theoretically efficient choice,
despite doubts about whether its core theoretical underpinnings (EMH and CAPM) are precisely correct’
- ‘when investors construct portfolios that weight companies proportional to capitalisation, they inherently
overweight overpriced stocks and underweight the underpriced stocks’
- ‘it’s no longer clear that market capitalisation weighting is the only legitimate benchmark or core portfolio
choice: in fact, institutional investors can choose from a wide array of alternative beta strategies, including
equal weight, minimum variance and economic size, to name a few’
- ‘these alternatives have generally offered better returns or lower volatility, or both, when compared with cap
weight’
- ‘equal weighting was the basis for the first index futures, has the longest history of the index alternatives,
and provides an interesting counterpoint to cap weight’
- ‘equal weight assumes that the aggregate investor universe has zero ability to forecast anything’
- ‘equal weight has the longest track record of added value’
- ‘for practitioners, the elegant simplicity of an equally weighted portfolio is compromised by implementation
issues … still, absent trading costs and any view on forecasting return or risk, equal weighting has
considerable appeal on a risk / return basis’
Source: Journal of Indexes, Jan / Feb 10: ‘Beyond Cap Weight’, Rob Arnott, Vitali Kalesnik, Paul Moghtader and Craig Scholl
16Touching on some of the academia …
Extensive academia highlights two factors which can contribute positively to portfolio performance,
which may benefit from equal weighting:
- equal weighting can capture outperformance potential that is associated with both ‘size’ and ‘value’ factors
1. The ‘size’ factor: equal weighting increases exposure to the smaller companies in an index:
- academia identifies that small companies have historically outperformed medium and large companies, over
the longer term (even the major stocks in the world today were smaller companies at some point in the past)
- the higher return premium of small companies is usually associated with increased risk and volatility: and less
information, less certainty, lack of liquidity, etc.
- academic research re the size factor: Banz (1980); Keim (1982); Fama and French (1992)
- the ‘size factor / small companies effect’ most specifically applies to small companies: notably, smaller
companies in the FTSE 100 are still considered large (and on p18 we highlight the performance of medium
sized ‘Mid 250’ companies compared to the FTSE 100): despite being relatively smaller companies, compared
to the ‘mega-cap’ end of the FTSE 100, these companies are not small in the academic sense: however, the
increased risk and volatility of large and medium size companies may be less than for small companies
2. The ‘value’ factor: re-balancing imposes a ‘buy low / sell high’ rule, which captures elements of value:
- in the last decade, value investing has been out of favour, while growth stocks have driven the performance of
certain stock market indexes: however, academia identifies the potential merits of value investing
- academic research re the value factor: Basu (1977); Rosenberg, Reid and Lanstein (1985); De Bondt and
Thaler (1987); Fama and French (1992)
© COPYRIGHT 2021 TEMPO STRUCTURED PRODUCTS 17Real world: smaller companies (the ‘size’ factor) premium …
FTSE 100 vs FTSE 250
20YRS (Jan 2001 to Dec 2020)
FTSE 100 FTSE 250
FTSE 100 vs FTSE 250
20YRS (Jan 2001 to Dec 2020)
FTSE 100 FTSE 250
Source: Thomson Reuters | 31 Dec 20. Past performance is not a reliable indicator of or guide to future performance and should not be relied upon, particularly in isolation.
18Real world: ‘buy low / sell high’ (an element of the ‘value’ factor) …
MSCI World Value vs MSCI World Growth
20YRS (Jan 2001 to Dec 2020)
MSCI World Growth MSCI World Value
Source: Thomson Reuters | 31 Dec 20. Past performance is not a reliable indicator of or guide to future performance and should not be relied upon, particularly in isolation.
19FTSE 100: comparing market captalisation and equal weighting …
FTSE 100 | FTSE 100 EQ FTSE 100 | FTSE 100 EQ
5YRS (Jan 2016 to Dec 2020) 10YRS (Jan 2011 to Dec 2020)
FTSE 100 FTSE 100 EQ FTSE 100 FTSE 100 EQ
FTSE 100 | FTSE 100 EQ FTSE 100 | FTSE 100 EQ
15YRS (Jan 2006 to Dec 2020) 20YRS (Jan 2001 to Dec 2020)
FTSE 100 FTSE 100 EQ FTSE 100 FTSE 100 EQ
Source: Thomson Reuters | 31 Dec 20. Past performance is not a reliable indicator of or guide to future performance and should not be relied upon, particularly in isolation.
20FTSE 100: comparing market captalisation and equal weighting …
Year-on-Year performance comparison (total return):
- throughout this presentation, colour highlights better or worse performance: if the metric for equal weighting
is better, this is show in green / if the metric for market capitalisation weighting is better, this is shown in red
YEAR-ON-YEAR PERFORMANCE (TOTAL RETURN)
2010 2011 2012 2013 2014 2015 2016 2017 2018 2019 2020
FTSE 100 12.6% -2.2% 10.0% 18.7% 0.7% -1.3% 19.1% 11.9% -8.7% 17.3% -11.5%
FTSE 100 EQ 21.3% -7.3% 17.9% 19.8% 4.5% 3.0% 12.6% 13.2% -9.0% 23.1% -2.2%
- as can be seen, more often than not equal weighting the FTSE 100 resulted in outperformance compared to
market capitalisation weighting: 8 out of the last 11 calendar years
Volatility and drawdown:
VOLATILITY DRAWDOWN
1YR 3YRS 5YRS 10YRS 10YRS
FTSE 100 29.0% 19.6% 13.6% -34.2%
FTSE 100 EQ 29.8% 21.1% 15.6% -37.2%
- as can be seen, equal weighting resulted in higher volatility and greater maximum drawdown (in Q1 2020, at
the outbreak of the Covid-19 pandemic) than the market capitalisation weighted FTSE 100
Source: FTSE Russell FTSE 100 EQ factsheet, 31 Dec 20. Performance data prior to the inception of the FTSE 100 EQ on 23 Dec 11 is simulated historical data.
21
Past performance is not a reliable indicator of or guide to future performance and should not be relied upon, particularly in isolation.Where do structured products come in …
The merits and potential benefits of equally weighted indexes are clear, so where are all the equally
weighted index mutual funds and ETFs:
- there are implementation issues / obstacles for mutual funds and ETFs in equal weighting
- the increased weighting and trading in smaller companies, including as a result of regular rebalancing to
maintain the equal weighting, can present liquidity, trading costs and tracking error challenges
However, structured products are based on contracts, issued by banks, with product returns calculated
based upon the level / performance of an index, without investing directly into the stocks in the index:
- issuing banks may arrange to hedge themselves against the legal obligation to deliver the returns stated, but
they do not necessarily replicate the index, or need to do so in the way that a typical passive fund or ETF does
- structured products do not, therefore, face and suffer the liquidity challenges, turnover costs or tracking error
issues of mutual funds and ETFs
- structured products can therefore employ and exploit academically evidenced smart beta strategies, including
equal weighting, in ways (and with risk / return profiles) which typical passive funds and ETFs cannot
© COPYRIGHT 2021 TEMPO STRUCTURED PRODUCTS 22FTSE 100 FDEW
----------------------------------------------
FTSE 100 FIXED DIVIDEND EQUAL WEIGHT CUSTOM INDEX
A FTSE RUSSELL INDEX
© COPYRIGHT 2021 TEMPO STRUCTURED PRODUCTSFTSE 100 FDEW: introduction …
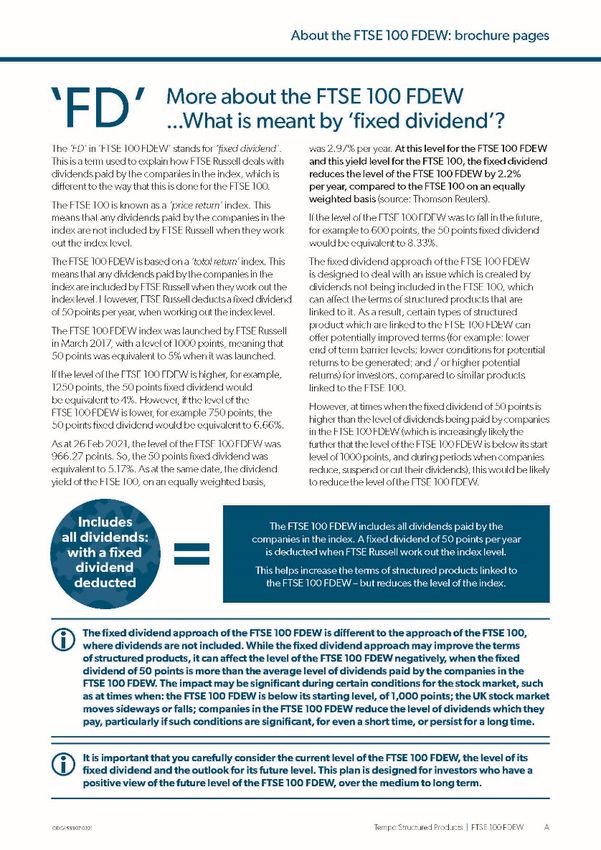
The FTSE 100 Fixed Dividend Equal Weight Custom Index (‘FTSE 100 FDEW’) is a FTSE Russell index:
- it was launched by FTSE Russell in March 2017 (with simulated data to 2001), with a starting level of 1,000
- it comprises the same 100 stocks as the FTSE 100, uses the same methodology re quarterly reviews and
constituents, and adheres to the same FTSE Russell FTSE UK Index Series Ground Rules as the FTSE 100
- as its name suggests, it differs to the FTSE 100 in two important ways:
… the ‘FD’: the FTSE 100 FDEW is based on a total return index, including dividends paid by the companies:
however, a fixed dividend of 50 points per year is deducted when FTSE Russell work out the index level
… the ‘EW’: the 100 companies in the FTSE 100 FDEW are all equally weighted, at 1% by FTSE Russell,
instead of being weighted according to their market capitalisation
The FTSE 100 FDEW was developed by FTSE Russell, in collaboration with Societe Generale, which has
an exclusive license with FTSE Russell / Tempo have agreed exclusivity for our plans in the UK:
- the FTSE 100 FDEW was developed in order to address an issue which investment banks may encounter
when structured products are linked to the FTSE 100, with the aim of improving product terms for investors
- improved structured product terms which can be achieved through use of the FTSE 100 FDEW can include:
… lower end of term barrier levels
… lower conditions for positive returns to be generated
… higher potential returns
© COPYRIGHT 2021 TEMPO STRUCTURED PRODUCTS 23FTSE 100 FDEW: the main features …
A TOTAL RETURN
THE SAME 100
INDEX, INCLUDING
COMPANIES AS
ALL DIVIDENDS:
THE FTSE 100: FTSE 100 FDEW
WITH A FIXED
EQUALLY
DIVIDEND
WEIGHTED
DEDUCTION
© COPYRIGHT 2021 TEMPO STRUCTURED PRODUCTS 24FTSE Russell indexes: FTSE 100 / FTSE 100 FDEW …
FTSE 100 FTSE 100 FDEW
Index provider FTSE RUSSELL FTSE RUSSELL
Exchange LSE LSE
Bloomberg ticker UKX UKXFD
The 100 largest stocks listed on the The 100 largest stocks listed on the
Constituent stocks
LSE, by market capitalisation LSE, by market capitalisation
Weighting Market capitalisation weighting Equal weighting
Review Quarterly Quarterly
Rebalancing N/A Quarterly
Included in the index, with a fixed dividend
Dividends Not included in the price return index
deduction in the calculation of the daily level
© COPYRIGHT 2021 TEMPO STRUCTURED PRODUCTS 25Let’s start with the ‘EW’: equal weighting …
As we know, the equal weighting of the FTSE 100 FDEW:
- decreases stock (and potentially sector) concentration risk and improves diversification
- increases exposure to the smaller companies in the index:
… in fact, equal weighting of the FTSE 100 FDEW increases exposure to over 70 companies which are
weighted at less than 1% in the market capitalisation weighted FTSE 100 (as at 31 Dec 2020)
- imposes a ‘buy low / sell high’ rule and value element in the index methodology, through regular rebalancing
… it is important to understand the points made regarding the features, rules, factor exposures and potential
issues which are embedded implicitly in market capitalisation weighted indexes and the features, rules,
factors and potential issues which are explicit in equal weighting methodology, which mean that the FTSE
100 FDEW will perform differently to the market capitalisation weighted FTSE 100: performance might be
higher or lower, which should be expected
Source: Thomson Reuters | 31 Dec 20. © COPYRIGHT 2021 TEMPO STRUCTURED PRODUCTS 26The ‘EW’: increases stock (and usually sector) diversification …
FTSE FTSE FTSE FTSE FTSE FTSE FTSE FTSE
100 Sector 100 100 Sector 100 100 Sector 100 100 Sector 100
rank weight rank weight rank weight rank weight
1 Pers. and h'hold goods 6.19% 26 Retail 1.22% 51 Chemicals 0.49% 76 Travel and leisure 0.34%
2 Pharmaceuticals 5.16% 27 Financial services 1.09% 52 Indust. goods and services 0.49% 77 Financial services 0.33%
3 Banks 4.14% 28 Indust. goods and services 1.07% 53 Indust. goods and services 0.48% 78 Utilities 0.33%
4 Basic resources 3.66% 29 Food and beverage 0.96% 54 Pers. and h'hold goods 0.47% 79 Financial services 0.33%
5 Pharmaceuticals 3.61% 30 Financial services 0.94% 55 Food and beverage 0.46% 80 Pers. and h'hold goods 0.32%
Food and beverage 3.61% 31 Retail 0.92% Indust. goods and services 0.46% 81 Indust. goods and services 0.32%
6 56
82 Pers. and h'hold goods 0.32%
7 Pers. and h'hold goods 3.33% 32 Insurance 0.85% 57 Insurance 0.46%
83 Pharmaceuticals 0.31%
8 Oil and gas 2.86% 33 Indust. goods and services 0.84% 58 Travel and leisure 0.46%
84 Media 0.31%
9 Oil and gas 2.78% 34 Utilities 0.84% 59 Retail 0.45%
85 Retail 0.31%
10 Oil and gas 2.50% 35 Indust. goods and services 0.83% 60 Basic resources 0.45%
86 Media 0.30%
11 Pers. and h'hold goods 2.50% 36 Banks 0.79% 61 Precious metals and mining 0.45%
87 Technology 0.30%
12 Basic resources 2.18% 37 Pers. and h'hold goods 0.78% 62 Indust. goods and services 0.45%
88 Utilities 0.29%
13 Insurance 1.89% 38 Basic resources 0.76% 63 Media 0.44%
89 Financial services 0.29%
14 Media 1.86% 39 Health care 0.71% 64 Indust. goods and services 0.44%
90 Pers. and h'hold goods 0.28%
15 Basic resources 1.77% 40 Telecommunications 0.70% 65 Precious metals and mining 0.43%
91 Financial services 0.28%
16 Telecommunications 1.74% 41 Insurance 0.69% 66 Travel and leisure 0.43%
92 Indust. goods and services 0.28%
17 Financial services 1.70% 42 Pers. and h'hold goods 0.66% 67 Financial services 0.41%
93 Media 0.27%
18 Basic resources 1.67% 43 Real estate 0.61% 68 Pers. and h'hold goods 0.39%
94 Indust. goods and services 0.27%
19 Utilities 1.63% 44 Financial services 0.60% 69 Financial services 0.39% 0.27%
95 Financial services
20 Travel and leisure 1.42% 45 Media 0.53% 70 Insurance 0.38% 96 0.27%
Retail
21 Banks 1.38% 46 Indust. goods and services 0.51% 71 Insurance 0.38% 97 0.27%
Real estate
22 Industrial goods and services 1.37% 47 Retail 0.51% 72 Basic resources 0.37% 98 0.25%
Chemicals
23 Banks 1.37% 48 Indust. goods and services 0.50% 73 Pers. and h'hold goods 0.37% 99 0.24%
Real estate
24 Travel and leisure 1.30% 49 Indust. goods and services 0.50% 74 Consumer discretionary 0.36% 100 Retail 0.23%
25 Construction and materials 1.29% 50 Technology 0.49% 75 Technology 0.34% 101 Utilities 0.22%
Source: Thomson Reuters | 31 Dec 20. © COPYRIGHT 2021 TEMPO STRUCTURED PRODUCTS 27The ‘EW’: increases stock (and potentially sector) diversification …
FTSE 100
FTSE 100 BY SECTOR FTSE 100 SECTOR
FDEW FTSE 100 FDEW BY SECTOR
Dec 2020 8.14% Oil and gas 2.97% Dec 2020
7.68% Banks 3.96%
15.61% Personal and household goods 10.89%
9.08% Pharmaceuticals 2.97%
10.86% Basic resources 6.93%
8.80% Industrial goods and services 14.85%
5.04% Food and beverage 2.97%
4.64% Insurance 5.94%
3.72% Media 5.94%
3.94% Travel and leisure 4.95%
6.63% Financial services 10.89%
3.89% Retail 6.93%
3.31% Utilities 4.95%
2.44% Telecommunications 1.98%
1.29% Construction and materials 0.99%
1.12% Real estate 2.97%
0.71% Health care 0.99%
1.13% Technology 2.97%
0.75% Chemicals 1.98%
0.87% Precious metals and mining 1.98%
0.36% Consumer discretionary 0.99%
Source: Thomson Reuters | ICB sector classifications. 31 Dec 20
28The ‘EW’: increases stock (and potentially sector) diversification …
FTSE 100 BY SECTOR COMPARED TO FTSE 100 FDEW BY SECTOR
Dec 2020
FTSE 100 FTSE 100 FDEW
Source: Thomson Reuters | ICB sector classifications. 31 Dec 20
29The ‘EW’: imposes a ‘buy low / sell high’ rule …
The FTSE 100 FDEW is rebalanced every quarter by FTSE Russell:
- if a company’s share price has gone up, and its market capitalisation and weighting have increased above 1%,
the weighting in the company is reduced back down to 1%
- if a company’s share price has gone down, and its market capitalisation and weighting have decreased below
1%, the weighting in the company is increased back up to 1%
… the rebalancing embeds a ‘buy low / sell high’, ‘value’ rule in the methodology of the FTSE 100 FDEW (the
opposite of the ‘buy high / sell low’ , ‘momentum’ rule embedded in the FTSE 100)
© COPYRIGHT 2021 TEMPO STRUCTURED PRODUCTS 30Why the ‘FD’: the rationale for the fixed dividend approach …
The FTSE 100 is a price return index:
- dividends paid by the constituent companies are not included in its calculation
The FTSE 100 FDEW is based on a total return index:
- dividends paid by the constituent companies are included in its calculation: however, a fixed dividend of 50
points per year is deducted in the calculation of its daily level
The total return / fixed dividend approach of the FTSE 100 FDEW addresses an issue which banks may
encounter when structured products link to the FTSE 100, with the aim of improving product terms:
- when products link to the price return FTSE 100, banks may seek to hedge the dividends which are not
accounted for within the index, which they can do by selling dividend futures in the futures market
- however, future dividend levels are unknown and uncertain and the futures market typically discounts the
levels that it can see and expects, particularly in the longer term
- in addition, dividend futures are not very liquid and structured product issuers create a supply / demand
imbalance: many investment banks are natural sellers, while there are few natural buyers
- as a result, ‘implied’ dividend levels seen in the dividend futures market are often lower than ‘realised’
dividend levels actually paid by companies
- this ‘discounting cost’, linked to the need for banks to hedge through the futures market, can negatively
impact the terms of structured products linked to the FTSE 100
- the fixed dividend of the FTSE 100 FDEW is designed to address this issue, avoiding the discounting costs
of the futures market and removing the hedging uncertainty, allowing issuers to improve product terms
© COPYRIGHT 2021 TEMPO STRUCTURED PRODUCTS 31- notes re structured products and dividends …
- it is worth highlighting that investors in structured products do not usually benefit directly from dividends paid by
companies which make up a stock market index which a structured product links to
- this is because stock market indexes are usually ‘price return’ indexes, which do not account for dividends
- however, the FTSE 100 FDEW incudes dividends, with a fixed dividend of 50 points per year deducted when
FTSE Russell calculate the daily level
- while dividends which companies may pay are not guaranteed, they can be an important part of the total return
which investors in the stock market or mutual funds or ETFs investing in these companies may benefit from
- dividends may increase investors’ returns in a rising market and provide some return in scenarios where the
market, including price return indexes, moves sideways, or in a falling market, offsetting some capital losses
- in this respect, not accounting for dividends could be considered an indirect cost of investing in the stock
market via a structured product
- however, it should also be understood that the investment banks issuing structured products will effectively use
the value of the dividends when they arrange the features of the investments which make up the structured
product, including providing the potential for positive returns to be generated without requiring the stock market
index to rise and offering a defined level of protection should the stock market index fall
- so, it can also be seen that investors in structured products benefit indirectly from the dividends paid by the
companies in a stock market index which a structured product is linked to and that dividends are an important
element of the economics / mathematics of the building blocks of structured products
© COPYRIGHT 2021 TEMPO STRUCTURED PRODUCTSDividend futures: implied levels discount actual dividend levels …
FTSE 100 DIVIDEND FUTURES
Dec 2020
Source: Thomson Reuters | Barchart.com: 31 Dec 20. © COPYRIGHT 2021 TEMPO STRUCTURED PRODUCTS 32The material impact on structured product terms: an example …
Use of fixed dividend indexes is increasing: in Europe, EUR 12.6 billion was invested in fixed dividend
index products over 2019 - 2020, market share increasing from c.6.6% in 2019 to c.10.9% in 2020
Improved structured product terms through use of the FTSE 100 FDEW can include: lower end of term
barrier levels; lower conditions for positive returns to be generated; higher potential returns:
AN EXAMPLE: ‘ATM’ KICK-OUT PRODUCT TERMS
Investment term 10 years
Kick-Out frequency annual
Kick-Out level at or above100% of start level (‘atm’)
Index link FTSE 100 FTSE 100 FDEW
60-65% of start level (allowing 45% of start level (allowing
Barrier level and type
a 35-40% fall): end of term a 55% fall): end of term
Potential return 7.0% 13.4%
- barrier level and return numbers for FTSE 100 products are the average levels for products, as at 11 Jan 21*
- please see page 55 for important points regarding comparing different structured products / indexes:
… it is important that advisers and investors carefully consider the current level of the FTSE 100 FDEW,
the level of its fixed dividend and the outlook for its future level: our plans are designed for investors
who have a positive view of the future level of the FTSE 100 FDEW, over the medium to long term
Source: Tempo ‘CASPA’: 11 Jan 21. © COPYRIGHT 2021 TEMPO STRUCTURED PRODUCTS 33Understanding the ‘FD’ in the FTSE 100 FDEW …
The fixed dividend which helps investment banks improve structured product terms:
- however, it is important to understand the implications of a fixed dividend
The FTSE 100 FDEW index was launched by FTSE Russell in March 2017, with a level of 1000 points,
meaning that 50 points was equivalent to 5% when it was launched:
- if the level of the FTSE 100 FDEW is higher, for example, 1250 points, the 50 points fixed dividend is
equivalent to 4%
- however, if the level of the FTSE 100 FDEW is lower, for example 750 points, the 50 points fixed dividend is
equivalent to 6.66% and at 600 points equivalent to 8.33%
It is important to understand that while the fixed dividend helps investment banks improve structured
product terms, at times when the fixed dividend of 50 points is higher than the level of dividends being
paid by companies in the FTSE 100 FDEW (which is increasingly likely the further that the level of the
FTSE 100 FDEW is below its start level of 1000 points, and during periods when companies reduce,
suspend or cut their dividends), this would be likely to reduce the level of the FTSE 100 FDEW:
- the impact of the fixed dividend could be significant, if the differential between the level of the fixed dividend
and the index dividend level is significant, for even a short time, or if any differential persisted for a long time
… this could create a ‘dividend drag’ on the level and performance of the FTSE 100 FDEW
… as at 31 Dec 2020, the level of the FTSE 100 FDEW was 971 points / the 50 points fixed dividend was
equivalent to 5.65% (calculated as a 12 mth ave*) and the dividend yield of the FTSE 100, equally
weighted (also calculated as a 12 mth ave*), was 2.91% p.a.: at these levels, the fixed dividend reduces
the level of the FTSE 100 FDEW by 2.74% p.a., compared to the FTSE 100 on an equally weighted basis
Source: Bloomberg. 31 Dec 20. *See page 51 re calculations. © COPYRIGHT 2021 TEMPO STRUCTURED PRODUCTS
34Understanding that the ‘FD’ and the ‘EW’ operate in tandem …
Notably, if a fixed dividend was applied to the FTSE 100, if the fixed dividend is higher than the dividend
level of the index, it would create an instant drag on the level and performance of the index:
- however, in the FTSE 100 FDEW, the ‘FD’ operates in tandem with the ‘EW’
- while the ‘FD’ of the FTSE 100 FDEW is set at level which can exceed the dividend level of the index (which
optimises the terms of structured products), creating a potential drag, the ‘EW’ may serve as a counterbalance
- we are extremely clear about both the ‘FD’ and the ‘EW’ in our investor-facing plan documents, using plain
English, and in the collateral materials, input and support which we provide for professional advisers
© COPYRIGHT 2021 TEMPO STRUCTURED PRODUCTS 35Our investor-facing and professional adviser information …
Investor-facing Professional adviser Professional adviser
plan brochures ‘at a glance’ input resource library
© COPYRIGHT 2021 TEMPO STRUCTURED PRODUCTS 36About the FTSE 100 FDEW: including the target market …
Plan brochure ‘info point’: About the FTSE 100 FDEW:
- The FTSE 100 FDEW will perform differently to the
FTSE 100, due to the equal weighting and the total return
and fixed dividend approach. This means that the returns
from the plan might be higher or lower than the returns
from a similar product linked to the FTSE 100. It is
important that you carefully consider the current level of
the FTSE 100 FDEW, the level of its fixed dividend and
the outlook for its future level. This plan is designed for
investors who have a positive view of the future level of
the FTSE 100 FDEW, over the medium to long term.
© COPYRIGHT 2021 TEMPO STRUCTURED PRODUCTS 37‘FD’: What is meant by ‘fixed dividend’ …
Plan brochure ‘info point’: About the ‘FD’:
- The fixed dividend approach of the FTSE 100 FDEW is
different to the approach of the FTSE 100, where dividends
are not included. While the fixed dividend approach may
improve the terms of structured products, it can affect the
level of the FTSE 100 FDEW negatively, when the fixed
dividend of 50 points is more than the average level of
dividends paid by the companies in the FTSE 100 FDEW.
The impact may be significant during certain conditions for
the stock market, such as at times when: the FTSE 100
FDEW is below its starting level, of 1,000 points; the UK
stock market moves sideways or falls; companies in the
FTSE 100 FDEW reduce the level of dividends which they
pay, particularly if such conditions are significant, for even a
short time, or persist for a long time.
- It is important that you carefully consider the current level of
the FTSE 100 FDEW, the level of its fixed dividend and the
outlook for its future level. This plan is designed for
investors who have a positive view of the future level of the
FTSE 100 FDEW, over the medium to long term.
© COPYRIGHT 2021 TEMPO STRUCTURED PRODUCTS 38‘EW’: What is meant by ‘equal weight’ …
Plan brochure ‘info point’: About the ‘EW’:
- Neither equal weight nor market capitalisation weight
indexes are better or worse than the other. Each offers a
different approach and different merits and points for you
to consider. Risks and returns will be different for each
and will depend on the future stock market environment
and the performance of the companies in each index.
© COPYRIGHT 2021 TEMPO STRUCTURED PRODUCTS 39Comprehensive and granular performance analysis …
The FTSE 100 FDEW was launched in March 2017:
- live performance data is available since this date
- simulated performance data is available before this date, back to 2001
It is important to understand - and expect - that the FTSE 100 FDEW Index will perform differently to the
FTSE 100, due to the equal weighting and the total return / fixed dividend approach:
- both the FTSE 100 FDEW and FTSE 100 perform as expected, based on understanding the respective
features, rules and factor exposures embedded either implicitly or explicitly in their methodology
- comprehensive and granular analysis of past performance highlights historically comparable performance,
including sharpe ratios, volatility and correlation, over the long term
- careful consideration of the FTSE 100 FDEW and FTSE 100 highlights the attributes and potential merits of
both: and the potential merits of using structured products linked to both, in diversified and balanced portfolios
© COPYRIGHT 2021 TEMPO STRUCTURED PRODUCTS 40Historical performance comparison and analysis …
FTSE 100 | FTSE 100 FDEW
15YRS (Jan 2006 to Dec 2020)
FTSE 100 FTSE 100 FDEW
1YR 3YRS 5YRS 10YRS 15YRS
CUM ANN CUM ANN CUM ANN CUM ANN CUM ANN
FTSE 100 -15.04% -15.04% -15.96% -5.63% 3.50% 0.69% 9.50% 0.91% 14.98% 0.93%
FTSE 100 FDEW -8.37% -8.37% -6.20% -2.11% 7.70% 1.50% 13.98% 1.32% 19.32% 1.18%
VOLATILITY (ANNUALISED) SHARPE RATIO
1YR 5YRS 10YRS 15YRS 1YR 5YRS 10YRS 15YRS
FTSE 100 29.55% 17.36% 16.39% 18.85% -0.51 0.04 0.06 0.05
FTSE 100 FDEW 30.23% 18.01% 17.11% 19.80% -0.28 0.08 0.08 0.06
Source: Thomson Reuters: 31 Dec 20. Performance data prior to the inception of the FTSE 100 FDEW on 01 Mar 17 is simulated historical data.
41
Past performance is not a reliable indicator of or guide to future performance and should not be relied upon, particularly in isolation.Historical performance comparison and analysis …
FTSE 100 FTSE 100 FDEW
YEAR
DIFFERENCE PERFORMANCE PERFORMANCE DIFFERENCE
-15.04% 2020 -8.37% +6.67% 2020
12.00% 2019 17.13% +5.13% 2019
2018 +0.93% -12.03% 2018 -12.96%
7.63% 2017 7.83% +0.20% 2017
2016 +7.83% 14.43% 2016 6.60%
-4.93% 2015 -2.22% +2.71% 2015
-2.71% 2014 -0.94% +1.77% 2014
2013 +1.11% 14.43% 2013 13.32%
5.84% 2012 10.73% +4.89% 2012
2011 +7.25% -5.55% 2011 -12.80%
9.00% 2010 13.96% +4.96% 2010
22.07% 2009 34.27% +12.20% 2009
2008 +5.58% -31.33% 2008 -36.90%
2007 +10.01% 3.80% 2007 -6.22%
10.71% 2006 15.80% +5.09% 2006
16.71% 2005 17.36% +0.65% 2005
7.54% 2004 9.40% +1.86% 2004
2003 +1.99% 13.62% 2003 11.63%
2002 +2.10% -24.48% 2002 -26.58%
2001 +6.14% -16.15% 2001 -22.29%
9 / 20 YEARS 11 / 20 YEARS
Source: Thomson Reuters: 31 Dec 20. Performance data prior to the inception of the FTSE 100 FDEW on 01 Mar 17 is simulated historical data.
42
Past performance is not a reliable indicator of or guide to future performance and should not be relied upon, particularly in isolation.Historical volatility: comparable …
HISTORICAL VOLATILITY
15YRS (Jan 2006 to Dec 2020)
FTSE 100 FTSE 100 FDEW
Source: Thomson Reuters: 31 Dec 20. Realised, 1 year. Performance data prior to the inception of the FTSE 100 FDEW on 01 Mar 17 is simulated historical data.
43
Past performance is not a reliable indicator of or guide to future performance and should not be relied upon, particularly in isolation.Historical correlation: comparable …
HISTORICAL CORRELATION
15YRS (Jan 2006 to Dec 2020)
Source: Thomson Reuters: 31 Dec 20. 1 year correlation. Performance data prior to the inception of the FTSE 100 FDEW on 01 Mar 17 is simulated historical data.
44
Past performance is not a reliable indicator of or guide to future performance and should not be relied upon, particularly in isolation.Performance analysis: since live (01 Mar 2017), annual …
FTSE 100 | FTSE FDEW FTSE 100 | FTSE FDEW
2017 (from 01 Mar) 2018
FTSE 100 FTSE 100 FDEW FTSE 100 FTSE 100 FDEW
FTSE 100 | FTSE FDEW FTSE 100 | FTSE FDEW
2019 2020
FTSE 100 FTSE 100 FDEW FTSE 100 FTSE 100 FDEW
Source: Thomson Reuters, 31 Dec 20. Past performance is not a reliable indicator of or guide to future performance and should not be relied upon, particularly in isolation.
45Performance analysis: since live (01 Mar 17)
FTSE 100 | FTSE 100 FDEW
SINCE LAUNCH (01 Mar 2017 to 31 Dec 2020)
FTSE 100 FTSE 100 FDEW
Source: Thomson Reuters | Bloomberg, 31 Dec 20. Past performance is not a reliable indicator of or guide to future performance and should not be relied upon, particularly in isolation.
46You can also read