Investor Presentation January 2017 - Jain Irrigation Systems Ltd.
←
→
Page content transcription
If your browser does not render page correctly, please read the page content below
Investor Presentation January 2017

Disclaimer

  This document has been prepared and furnished by Jain International Trading BV (the "Issuer") and Jain Irrigation Systems Limited (the "Parent Guarantor") solely for use for the purpose of this
  presentation and is subject to change without notice. The presentation is being made to you on a confidential basis and solely for your information and may not be reproduced, disclosed or
  distributed in whole or in part to any other person.

  The information contained in this presentation has not been independently verified by Deutsche Bank AG Singapore Branch or J.P. Morgan Securities plc (the "Joint Global Coordinators "), or
  Barclays Bank PLC, Nomura International (Hong Kong) Limited or Coöperatieve Rabobank U.A., trading as Rabobank London (together with the Joint Global Coordinators, the “Joint Bookrunners
  and Joint Lead Managers”) or any of their respective subsidiaries, branches, affiliates or associates and, thus, no representation or warranty, express or implied, is made by any of them as to, and
  no reliance should be placed on the fairness, accuracy, completeness or correctness of the information, opinions or conclusions contained herein. None of the Joint Global Coordinators and Joint
  Bookrunners, the Joint Lead Managers, the Issuer or the Parent Guarantor or any of their respective affiliates, advisers and representatives accepts any liability whatsoever for any losses arising
  from any information contained in this presentation.

  This presentation does not constitute or form part of an offer to sell or issue or an invitation to purchase or subscribe for any securities of the Issuer or any of its affiliates in any jurisdiction, and no
  part of this presentation shall form the basis of or be relied upon in connection with any contract or commitment. Specifically, this presentation does not constitute a prospectus or other offering
  memorandum in whole or in part. Any decision to purchase securities of the Issuer or any of its affiliates in any public or private offering should be made solely on the basis of the final terms and
  conditions of the securities and the information contained in an offering circular together with any supplementary prospectus or other pricing information distributed to you and not on the basis of
  this presentation.

  This presentation contains forward-looking statements that involve risks and uncertainties. All statements other than statements of historical facts are forward-looking statements. These statements
  involve known and unknown risks, uncertainties and other factors that may cause the actual results, performance or achievements of the Issuer, the Parent Guarantor and/or any of their respective
  affiliates to be materially different from those expressed or implied by the forward-looking statements. You should not rely upon forward-looking statements as predictions of future events. This
  presentation speaks as of the date hereof. None of the Issuer, the Parent Guarantor, any of the Joint Global Coordinators and Joint Bookrunners or any Joint Lead Managers or any other person
  undertakes any obligation to update or revise any information or forward-looking statements, either as a result of new information, future events or otherwise.

  This presentation is directed only at persons which are not located in the “United States” as defined in Regulation S under the U.S. Securities Act of 1933 as amended (the “Securities Act”) and
  which are lawfully able to receive this document under the laws of the jurisdictions in which they are located or other applicable laws ("relevant persons"). Any person who is not a relevant person
  but who has received a copy of this document must return this document to the sender or destroy it immediately, and in no event should such person act on it or rely on it for any purpose. Any
  investment or investment activity to which this document relates are available only to relevant persons and will be engaged in only with relevant persons.

  THE SECURITIES HAVE NOT BEEN, AND WILL NOT BE, REGISTERED UNDER THE SECURITIES ACT, OR THE SECURITIES LAWS OF ANY STATE OF THE UNITED STATES OR ANY
  OTHER JURISDICTION AND THE SECURITIES MAY NOT BE OFFERED, SOLD OR DELIVERED WITHIN THE UNITED STATES, EXCEPT PURSUANT TO AN EXEMPTION FROM, OR IN A
  TRANSACTION NOT SUBJECT TO, THE REGISTRATION REQUIREMENTS OF THE SECURITIES ACT AND APPLICABLE STATE OR LOCAL SECURITIES LAWS. NO PUBLIC OFFERING
  OF THE SECURITIES WILL BE MADE IN THE UNITED STATES AND THE ISSUER AND PARENT GUARANTOR DO NOT INTEND TO REGISTER ANY PART OF THE PROPOSED OFFERING
  IN THE UNITED STATES.

  THIS PRESENTATION DOES NOT CONSTITUTE A PROSPECTUS OR OTHER OFFERING DOCUMENT (AN "OFFERING DOCUMENT") IN WHOLE OR IN PART. INFORMATION CONTAINED
  IN THIS PRESENTATION IS A SUMMARY ONLY, AND IS QUALIFIED IN ITS ENTIRETY BY REFERENCE TO THE OFFERING DOCUMENT. EACH INVESTOR SHOULD READ THE
  OFFERING DOCUMENT FOR MORE COMPLETE INFORMATION REGARDING THIS OFFERING BEFORE MAKING AN INVESTMENT DECISION. TO REQUEST A COPY OF AN OFFERING
  DOCUMENT PLEASE CONTACT YOUR SALESPERSON.

  BY ATTENDING THIS PRESENTATION AND/OR ACCEPTING A COPY OF THIS DOCUMENT, YOU AGREE TO BE BOUND BY THE FOREGOING LIMITATIONS AND CONDITIONS AND
  FURTHER, YOU REPRESENT AND WARRANT THAT (A) YOUR ARE LAWFULLY ABLE TO RECEIVE THIS DOCUMENT UNDER THE LAWS OF THE JURISDICTION IN WHICH YOU ARE
  LOCATED OR OTHER APPLICABLE LAWS, (B) YOU ARE LOCATED OUTSIDE THE UNITED STATES AND THIS PRESENTATION IS FURNISHED TO YOU OUTSIDE THE UNITED STATES,
  AND (C) YOU WILL NOT REPRODUCE, PUBLISH, DISCLOSE, REDISTRIBUTE OR TRANSMIT THIS PRESENTATION, DIRECTLY OR INDIRECTLY, TO ANY OTHER PERSON

                                                                                                            1
Presenters

  Anil Bhavarlal Jain   Atul Bhavarlal Jain       Manoj Lodha               Athang Jain
  Vice Chairman and     Joint Managing Director   Chief Financial Officer   Director, Jain Farm Fresh
  Managing Director                                                         Foods Limited

                                                    2
Summary terms of the offering
Issuer Jain International Trading B.V.
Guarantor Jain Irrigation Systems Limited
Currency USD
Ranking Senior Unsecured Fixed Rate Green Notes
Issue ratings B+(S&P)/B+ (Fitch)
Tenor 5 years
Size [•]
Format Regulation S only
~$190mm for repayment of existing debt with minimum $50mm to be used to repay
long term borrowings
Remainder of net proceeds for general corporate purposes
Use of proceeds
An amount equal to net proceeds would be allocated to finance / refinance (including
through acquisitions) Eligible Green Projects (Manufacturing of Renewable Energy
Products, Micro Irrigation Systems and Water Efficiency)
Listing Singapore Stock Exchange
Governing Law New York Law
Joint Global Coordinators Deutsche Bank, J.P. Morgan
Joint Bookrunners and
Deutsche Bank, J.P. Morgan, Barclays, Nomura, Rabobank
Joint Lead Managers
3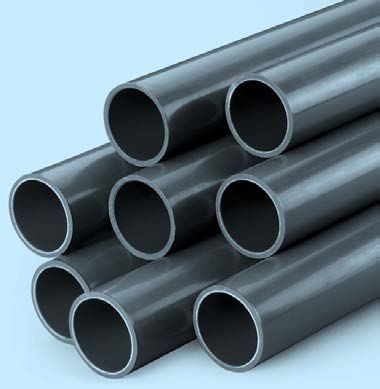
Illustrative corporate structure

                                                                                         Jain Irrigation Systems Limited
                                                                                                       (India)1

                           100%                                                  100%                                                  100%                                    7.16%      81.65%

                                                                                                                    Jain Processed Foods Trading &
                JISL Overseas Ltd                               Jain International Trading BV                                                                              Jain Farm Fresh Foods Ltd
                                                                                                                           Investment Pvt Ltd
                    (Mauritius)                                          (Netherlands)                                                                                               (India)
                                                                                                                                 (India)

                                     30.55%                                                      100%                                              75%                                       100%
                        69.45%                      54.53%                  45.47%

        Jain America Holdings Inc                      Jain (Europe) Ltd2                         Jain Overseas BV                        Driptech India Pvt Ltd               Jain International Foods Ltd
                 (USA)                                        (UK)                                  (Netherlands)                                (India)                                   (UK)

                        100%                                      100%                                                                                  100%                                 100%

             Jain Irrigation Inc                      Ex-Cel Plastics Ltd                                                               Sleaford Food Group Ltd                  Jain America Foods Inc3
                    (USA)                                  (Ireland)                                                                              (UK)                                   (USA)

                        100%
                                                                                                                                                               100%                          100%
                  100%                             100%                              100%                           100%

          Point Source                   Jain Agricultural                                                                                           Sleaford Quality              Cascade Specialties
                                                                            JISL Global SA                Jain (Israel) BV
           Irrigation                        Services                                                                                                   Foods Ltd                         Inc
                                                                             (Switzerland)                 (Netherlands)
             (USA)                            (USA)                                                                                                        (UK)                          (USA)

                                                                                     100%                                                                               100%
                                                                                                                    51%              94.90%     5.10%
                                                                                                          Gavish Control                 NaandanJain               Arnolds Quick Dried
                                                                           JISL System SA
                                                                                                           System Ltd                   Irrigation Ltd4                Foods Ltd
                                                                             (Switzerland)
                                                                                                              (Israel)                       (Israel)                     (UK)

                                                                                     100%

                                                                            THE Machines
                                                                             Yvonand SA
                                                                             (Switzerland)

                   Issuing entity                                                    75%

                   Parent Guarantor                                          Pro Tool AG
                                                                             (Switzerland)

       Note:
       1 The Parent Guarantor holds a 49% interest in SAFL, a non-banking financial company which focuses on providing financing solutions to Indian farmers
       2 Jain (Europe) Ltd has an additional subsidiary as of the issue date of the Notes
       3 Jain America Foods Inc has one subsidiary as of the issue date of the Notes
                                                                                                            4
       4 NaandanJain Irrigation has 14 subsidiaries as of the issue date of the Notes
Company overview

Jain Irrigation Systems Ltd. (“JISL”) – A snapshot
Incorporated in
1963 ~USD 921mm
Started our trading 1986 Aggregate revenues as
business in agricultural on 31st March, 2016
inputs and equipment
120 countries with 30 ~USD 647mm
sales presence manufacturing plants Market capitalization as
on 11th January, 2017
~6,527 ~4,028 10,695
Dealers and distributors Distributors and Employees globally
In India customers overseas
1,364 610 TM 231 Awards
Agricultural scientists, Trademarks in India 18 international, 172 national
technicians and engineers and 41 state awards
Market leadership in each of the markets we operate
One of the major players in MIS
One of the major players in agriculture PVC pipes and HDPE pipes
Largest exporter of processed fruits and vegetables in India
Touching lives in more ways than one
Source: BSE
Note: FX rate USD/INR = 68.2 6
Integrated business model
Conservation of resources. Enhanced productivity.
Sustainable environment. Cost savings.
Watershed planning Drip irrigation systems
Water harvesting Sprinkler irrigation systems
Soil/water saving Increased Product Cultivated tissue culture plants
productivity development
Water resource estimation Greenhouses
Waste land reclamation PVC piping systems
PE piping systems
Weather
Adequate
and timely Knowledge
Soil Farmer Water
Aiding Feedback
More investments. repayment Improved product quality.
More profits and security to Value adding solutions.
SAFL Manpower
Purchase agreements with Turnkey services
farmers Advisory services
Dehydrated onion and Training
vegetable products Price support
Quality
for certain agri Agronomy services
Processed fruit products goods
inputs
Surveys and analysis for water
and soil
Irrigation scheduling
Fertigation scheduling
Unique total solutions offered to farmers
7
Business segments
1 2 3 4
Hi-tech agri inputs Plastic products Agro processing Others
Micro irrigation systems PVC Pipes and fittings, Fruit pulps, concentrates, Renewable energy systems,
(MIS), tissue culture, solar PVC sheets, Turnkey vegetable dehydrations, solar power generation,
pumps Projects spice processing, etc. equipment manufacturing
Drip & Sprinkler Systems One of the largest players in Largest exporter of Renewable energy systems
Precision Farming Advisory India processed fruits and includes solar water heater
Wide distribution presence Catering to Agricultural as vegetables in India systems and solar lighting
well as Industrial and Forayed into Retail in FY162 systems
Manufacturing base in India,
Israel, Turkey, USA, Latin Infrastructure customers Manufacturing in India, UK Solar power plant with an
America and Europe Manufacturing primarily and USA installed capacity of 8.5 MW
driven from India in Jalgaon
R&D base in India, Israel,
USA Forayed into Urban space Equipment manufacturing
by introducing plumbing produces machinery and
systems lines for irrigation systems
and plants
48%1 26%1 24%1 2%1
1 Audited consolidated sales as a % of total sales for the half year ending September 30, 2016
2 FY ending March 31, 2016
8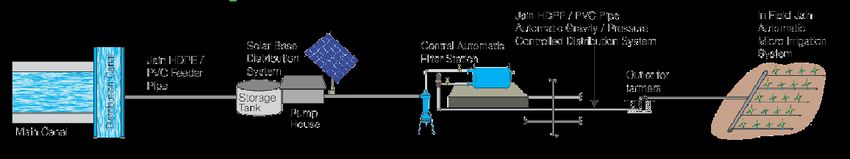
Business segments
India remains largely an agrarian economy however high water scarcity has impacted
   agricultural activity

                                                                                  …with one of the highest share of population engaged in
               Contribution of agriculture to GDP remains high (%)…               agriculture in the world (%)
Hi-tech agri
                     16.4                                                                                                1994        2010
  Plastic                                                                              61
                                                                                            51      50
                                    8.6                                                                                                                         39
                                                  6.2                                                              26
   Agro                                                     4.7            4.0                                                                                          20
                                                                                                                         16          16
                                                                    1.1                                    3                                8      3        2

                    India         China          Brazil    Russia   US    World        India        China          Brazil            Russia            US        World
               Source: EIU estimates for the year 2016                            Source: World Bank database

               54% of India faces high to extreme high water stress…
                                                                                                           Baseline Water Stress
                                                                                                               Low (80%)
                                                                                                               Arid & low water use
                                                                                                               No data
                                                                                  …with sharp decline witnessed in per capita water
                                                                                  availability

                                                                                            Per-capita water availability forecast (cubic meters)
                                                                                        6,042

                                                                                                           1,816            1,545               1,340           1,140

                                                                                        1947               2001               2011              2025            2050
               Source: World Resources Institute website                          Source: Grant Thornton

                                          India has 18% of the world’s population and only 4% of usable water resources

                                                                                  10
Low irrigation coverage and high dependence on erratic rainfall are the key challenges
for Indian agriculture
Small land holdings… …and low irrigation coverage…
Hi-tech agri
(hectares) Gross cropped area
Plastic India 1.3 (198.0mm ha)
Agro
Brazil 72.8
Net cropped area Uneven distribution of rain
(142.0mm ha)
makes irrigation paramount
US 178.4
Only 46% of net cropped
area is under irrigation
Net irrigated area
Small land holdings result in reduced productivity and (65.3mm ha)
inefficient use of resources
Source: FAO statistical year book 2013 Source: Grant Thornton
…has meant that agricultural activity remains highly dependent on rainfall
India food grain production (mm tons (mt)) Varying food production numbers demonstrate
259 265 its continued reliance on rain-water for
257 251
245 cultivation
In 2014-15, food production declined to 251.1
million tonnes from 265.04 million tonnes the
previous year
The reason behind the decline was the 12%
monsoon rainfall deficit
2010 2011 2012 2013 2014
Source: Grant Thornton
Feeding a growing population, which is expected to reach 1.6 billion by year 2050, will be a major challenge for the Indian agriculture
11Micro irrigation system – Solution to the challenges faced by Indian agriculture
Efficient water use Reduction in input consumption Increase in crop productivity
Surface irrigation Sprinkler irrigation Drip irrigation Estimated cost savings (% change) Estimated cost savings (% change)
Hi-tech agri
100 90
80-90 Productivity
Benefits of MIS
Percentage (%)
80 50-60 (Canal) 60-80
Plastic 60-70 (Well) Energy 30.5% increase – 42.4%
40-70 50-70 Fruits
60 30-40
Agro 40 30-40 30-35 Productivity
20-25 Fertilizer 28.5% increase – 52.7%
20 Vegtables
0
Conveyance Application Surface Overall New Crop
Irrigation 31.9% 30.4%
efficiency¹ efficiency water efficiency introduction
evaporation
Increase in farmer’s income Benefits to farmers outweigh the cost of MIS installation
Benefit: Cost ratio, fruit crops
% increase
2.64 2.78 2.71
2.55 2.47 2.49 2.50 2.53 2.57 2.52
AP 32.6% 2.36
2.12
1.75
Bihar 32.8%
Chhattisgarh 67.3%
Maharashtra
Tamil Nadu
AP
Bihar
Haryana
Karnataka
Chhattisgarh
Gujarat
Odisha
UP
Rajasthan
Sikkim
Uttarakhand
Gujarat 68.0%
Haryana 59.0%
Impact of MIS
Karnataka 27.7%
Maharashtra 45.8%
Benefit: Cost ratio, vegetable crops
Odisha 38.5%
2.58 2.74
Rajasthan 52.5% 2.37 2.39 2.39 2.45
2.09 2.15 2.23 2.23
1.89 1.83 1.85
Sikkim 37.3%
Tamil Nadu 33.3%
UP 49.4%
Maharashtra
Tamil Nadu
AP
Bihar
Haryana
Karnataka
Chhattisgarh
Gujarat
Odisha
UP
Rajasthan
Sikkim
Uttarakhand
Uttarakhand 20.1%
Total 42.0%
Source: Grant Thornton
1 For open channels only
12Micro irrigation has immense potential in India
Current micro irrigation penetration is very low Area under micro irrigation (mm hectares)
Penetration of arable land (%)
Hi-tech agri
90.0
Plastic 7.73
78.0
6.14
Agro 65.0
55.0 52.0 4.94
3.09
10.0
5.5
Israel Russia Spain US Brazil China India 2005 2010 2012 2015
With half the cultivable land in the country still being rain-fed, there is significant potential for promoting micro irrigation on India’s 140
million hectares of arable land
Government support and growing recognition of MIS
Central government launched PMKSY1 scheme in July with an outlay of INR50bn over the next five years to promote MIS
and irrigation. Some of the major objectives of PMKSY are to:
The Indian government expand cultivable area under assured irrigation (Har Khet Ko Pani)
has launched various improve on-farm water use efficiency to reduce wastage of water
programs in support of enhance the adoption of precision-irrigation and other water saving technologies (more crop per drop)
micro irrigation
attract greater private investment in precision irrigation system
increase efficient water conveyance which will require the construction of MIS
Subsidy support to Under current incentives in India, at least 35% of the purchase price of micro irrigation systems are subsidized by the
push MIS Indian central and state governments to the farmer
Source: Grant Thornton
Note: 1 PMKSY: Pradhan Mantri Krishi Sinchayee Yojana
13Unique value proposition of JISL
1 2 3 4 5
Hi-tech agri Manufacturing and Integrated product Innovation and thought Customer
Financing Affiliate
distribution capabilities offering leadership engagement
Plastic
Agro Manufacturing base in Capability to provide Significant pool of Agronomic and Farmers in India face
India, Israel, Turkey, fully integrated MIS intellectual property extension support, financial constraints to
USA and in Latin solutions provide technological after sales services, fund farm equipments
American countries leadership technical support for
MIS + Pipes + Solar = getting better crop Started NBFC
Wide distribution Competitive 2,000 acre of R&D returns operations in July
presence globally positioning facilities 2012 to address the
Large pool of problem
Extensive scale of Products and services R&D base in India, technocrats,
manufacturing range from drip and Israel, USA and engineers, Provides financing for
sprinkler irrigation Switzerland agronomists, micro-irrigation
Large export potential systems, precision horticulturists and systems, farm
globally farming to rain port regional offices, as equipment, contract
irrigation well as trained farming, solar module
dealers distributors in etc.
India and all over the
world
One of the major players in MIS
14Hi-tech agri input products business overview
Micro irrigation systems
Overview Key products MIS – How it works
Hi-tech agri
Products and services
Plastic range from drip and
Drip and sprinkler irrigation
sprinkler irrigation systems,
Agro precision farming to rain
port irrigation
Capability to provide fully
integrated MIS solutions
Drippers Sprinklers
Provides financing for
micro-irrigation systems,
farm equipment, contract
farming, `solar module etc.
Drip irrigation Sprinkle irrigation
Integrated irrigation projects
Integrated irrigation projects
on a turnkey basis
Study, design, install and
commission integrated
irrigation systems and
provide after sales and
O&M services
Pressurized and gravity based irrigation model
Minimizes losses through
evaporation and seepage
unlike open canals
Canal based pressurized irrigation model
15Hi-tech agri input products business overview (cont’d)
Solar agri-pump business Tissue culture
Hi-tech agri
Our solar pumping systems comprise PV solar panels Our cultivated tissue culture products include tissue
Plastic and pump modules culture plants, hybrid seedlings and grafted plants
We offer integrated irrigation solutions by combining our Tissue culture plants are produced by cultivating plant
Agro
MIS products with solar pumping systems tissue or cells in lab conditions
No batteries We offer cultivated tissue cultures of various types of
Overview
bananas, pomegranates and strawberries
In addition, we also produce hybrid onion seedlings and
mango, citrus, guava, gooseberry and sapota grafted
plants
Select
brands
Select
products
Banana Pomegranate
Solar Water Pumping System
Note: PV: Photovoltaic, FX rate USD/INR = 68.2
16Plastic products business overview
Plastic products
Piping systems PVC sheets Turnkey projects
Hi-tech agri
Plastic
Products &
services
Agro
Farm Drinking Home & Interior
Applications Sewerage Effluents Cable Ducting Gas Sign boards
Irrigation Water Design
New infrastructure Housing & water supply Farm irrigation Others
Swachh Bharat Mission: Housing for all by 2022 Pradhan Mantri Krishi Other growth drivers include
Investment in sanitation and aims to provide affordable Sinchai Yojana (“PMKSY”) city gas distribution,
drinking water facility housing in both urban and aims to improve farm upgrading of ageing
presents significant rural areas productivity and achieve infrastructure etc.
opportunity for PVC pipes better use of resources High growth due to
Key demand
drivers Under AMRUT and Smart Through use of irrigation and Increasing urbanization
Cities initiative, demand of other water-saving activities,
Rising sensitivity to
pipes to increase for water PMKSY will create strong
environmental pollution
supply, sewerage, solid demand for high pressure
waste management and agricultural pipes
storm water drains
One of the major players in agriculture PVC pipes and HDPE pipes
Source: Report titled ‘Building Materials: Plastic Pipes Sector Note’ by Spark Capital in September, 2016
Note: PVC: Poly Vinyl Chloride, AMRUT: Atal Mission for Rejuvenation and Urban Transformation, HDPE: High Density Poly Ethylene
17Jain Irrigation has the solution for every piping need of a ‘SMART CITY’
Hi-tech agri
Plastic
Agro
Smart City: Objective is to promote cities that provide core infrastructure and give a decent quality of life to its citizens, a clean
and sustainable environment
AMRUT: Atal Mission for Rejuvenation and Urban Transformation aims to provide basic services such as water supply,
sewerage and urban transport, to households and to build amenities in cities to improve the quality of life
18Agro processed products business overview
Onion and vegetable Retail foray and spice
Fruit processing processing processing
Capability of processing various fruits Product range includes sliced, diced, Launched AamRus in 2016
Hi-tech agri including mango, strawberries, chopped, granulated, powdered, Aim to commence the production of
banana, pomegranates, guavas etc. toasted and fried products processed fruit snacks in India
Plastic Can operate our manufacturing Used in dry soup mix, pizza toppings, Plan to manufacture processed spices
Overview facilities for 10-11 months a year sauces and other processed foods
Agro Currently conducting trials for the
Major processed fruit products are 2 plants in India and 1 in US introduction of retail fruit juice vending
frozen pulps, purees, concentrates,
~60% of fresh onions sourced through machines
frozen fruit slices and dices
purchase arrangements from farmers
Select
product
range
Frozen
Mango slice Onion dehydration
Wide retail footprint across the country
Planning to leverage existing distribution
Footprint network
Jalgaon unit Chittoor unit Jalgaon unit Oregon unit
Customers are beverage and juice Primary customers are multi-national Catering to retail customers pan India
companies in India and overseas food companies in India, other parts of Plans for retail foray in both fruits and
Unnati, partnership with Coca-Cola for Asia, Europe and American continents spices
Customers raw material security Accredited with BRC certificates
and projects MoU with Hindustan Coca-Cola to Quality Management Systems (QMS)
develop orange juice producing facilty established
All plants certified for ISO 22000, ISO
14001 & BS OHSAS 18001: 2007
Note: UHDP: Ultra High Density Mango Plantation
19Jain Irrigation is a market leader in fruit and vegetable processing in India
1 2 3 4
Hi-tech agri
Sourcing arrangements Quality control and assurance Modern manufacturing facility Established clientele
Plastic
Agro JISL sells high yielding and Implements Jain Good Flexible manufacturing allows Customers are beverage and
hybrid onion seeds to farmers Agricultural Practices and processing of multiple fruits juice companies and multi-
and purchase fresh onions from Sustainable Agricultural Codes to national food companies in India
them promote traceability, food safety, Manufacturing setup consists of and overseas
worker welfare, hygiene, processing plants, ripening
Teams of farming consultants sanitation as well as chambers, modern, custom-built Catering to major players in dry
provide technical knowhow to environmental and biodiversity mill, cold storage and soup mix, pizza toppings, sauces
farmers protection, conservation and warehouses and many other processed foods
enhancement
JISL sources fresh onions and Hindustan Coca-Cola, a
other harvested vegetables ISO, BS OHSAS, BRC subsidiary of The Coca-Cola
grown in close proximity to certifications Company in India, accounts for
dehydration plants 12.4% of total sales in this
Manufacturing and control segment in FY2016
~60% of fresh onion processes ensures traceability
requirements met from farmers
with whom we have purchase
arrangements
Winner of the APEDA Golden Trophy for the last 5 consecutive years:
Largest exporter of processed fruits and vegetables in India
Note: APEDA: Agricultural and Processed Food Products Export Development Authority
20Our business strategy
1
Intend to increase our sales in regions other than Western and Southern India through
expanding our distribution network
Expand our geographic Expand sale of MIS and solar pumping systems into Africa and South America which offer
markets and product offering attractive opportunities for growth
Capitalize on growth opportunities and further strengthen our market position through the
expansion of our product offering
2
Aim to commence the production of processed fruit snacks in India under an in-house brand
Expand our retail product
Currently conducting trials for the introduction of retail fruit juice vending machines with a
portfolio
leading fast-moving consumer goods company
3
Aim to reduce our working capital requirements by continuing to implement our cash and
carry policy for our sales of MIS products to dealers in India
Implement prudent financial
Intend to leverage our relationship with Sustainable Agro-commercial Finance Ltd (“SAFL”) to
strategy
bolster our liquidity position as SAFL expands its operations in the extension of credit to our
customers, providing upfront cash for the purchases of our products
4
Pursue M&A opportunities Plan to prudently and selectively pursue strategic M&A opportunities that will allow us to
that are in line with our vision expand and/or complement our current portfolio of products, marketing capabilities and
and strategic objectives geographical footprint
21Key credit highlights
Key credit highlights

                                                1

                                                    Integrated agricultural
                                                      solutions provider

          7                                                                         2

              Experienced board and                                                      Leadership in each of the
                management team                                                         markets in which we operate

                                                          Key credit
      6                                                                                    3
                                                          highlights
          Strong product quality and
                                                                                               Diversified revenue base
           internal quality controls

                            5                                      4
                                                                       Extensive manufacturing,
                                Strong R&D capabilities and
                                                                         marketing, sales and
                                    intellectual property
                                                                         distribution platform

                                                                 23
1 Integrated agricultural solutions provider
Presence across the agricultural value chain
We help farmers to produce more and better
Tissue Cultured PVC, HDPE Piping Drip and Sprinkler Controlled Solar Pumping
Plants Systems Irrigation Systems Agriculture Systems
Turnkey Services Training and Research and Purchase
Extension Development arrangements with
farmers
We purchase fruits and vegetables from farmers
We process these for export and domestic markets
Dehydration Onion Modern Fruit Pulps, Concentrates
and Vegetable Dehydration Facility Processing Plant and frozen fruits
JISL was the only Indian company to be inducted into Fortune magazine’s inaugural “Change the World” list in 2015,
which recognized its contributions to the improvement of the livelihoods of millions of small farmers in India
242 Leadership in each of the markets in which we operate
Hi-tech agri products Plastic products Agro processed products
One of the major players in MIS One of the major players in Largest exporter of processed fruits
agriculture PVC pipes and HDPE and vegetables in India
pipes
Micro-irrigation Plastic pipes Mango Processing
Tissue culture (banana, Dehydration (onion,
PVC sheets
pomegranate) vegetable)
253 Diversified revenue base
Revenue mix: By segment1 Revenue mix: By geography1
Other
products
and
Rest of
services
Agro- World
3%
processed 15%
products
24%
North
Hi-tech agri America
input 11%
products
46% India
55%
Europe
19%
Plastic
products
27%
1H17 revenue: US$466mm 1H17 revenue: US$466mm
Well balanced revenue stream with diversified product portfolio and geographical presence
Note: 1 Revenue mix for first half ending September 30, 2016, FX rate USD/INR = 68.2
264 Extensive manufacturing, marketing, sales and distribution platform
Manufacturing and distribution presence across India
Domestic manufacturing capacity1
Products1 Unit Installed capacity
MIS products tons 257,720
Cultivated tissue culture
mm 90
plants
Piping systems tons 334,020
PVC sheets tons 18,400
Dehydrated onion and
tons 33,148
vegetable products
Processed fruit products tons 159,000
Solar water heater systems liters 5,000,000
PV solar panels watts 55,000,000
Domestic marketing network1
State1 Plants Offices Depots Dealers
Maharashtra 5 18 9 3,307
Madhya Pradesh – 1 3 173
Karnataka – 5 2 497
Gujarat 2 5 2 514
Tamil Nadu 1 6 3 221
Rajasthan 1 3 4 191
Telangana 1 8 1 383
Andhra Pradesh 2 13 3 319
Other States – 22 12 727
Total 12 81 39 6,527
Note: 1 As of September 30, 2016
274 Extensive manufacturing, marketing, sales and distribution platform (cont’d)
Manufacturing and distribution facilities across key target markets
Overseas manufacturing capacity1 Overseas marketing network1
Products1 Unit Installed capacity Distributors
MIS products tons 58,507 Continent1 Plants Sales Managers & customers
Cultivated tissue culture plants mm – South & Latin America 2 10 632
Piping systems tons – North America 6 53 2,231
PVC sheets tons 8,750 Europe 6 38 925
Dehydrated onion and vegetable Asia (Other than India) 4 19 117
tons 38,937
products Australia 0 5 104
Processed fruit products tons – Other – 5 19
Solar water heater systems liters – Total 18 130 4,028
PV solar panels watts –
Note: 1 As of September 30, 2016
285 Strong R&D capabilities and intellectual property
Strong R&D franchise
Trademarks in India out of which 421 trademarks are registered for various products and service lines, including MIS products and services, piping
610 systems, agro-processed products, PVC sheets, renewable energy systems and other products
Registered trademarks in the United States and two in each of Canada and Mexico 13
54 Trademarks applied for MIS products in Turkey, out of which received registration for 10 trademarks
R&D personnel across global operations, as of Sep 30, 2016 170
2,000 Acres of R&D farms for devising efficient solutions for different crops & applications
R&D in precision farming – PureSense and GeneSys technology
Puresense Genesys
Technology and software for farmers to monitor irrigation Wireless sprinkler with modifiable water flow and pattern
requirements at crop root levels on a real time basis
Puresense Technology Genesys Smart Sprinkler: Wireless Sprinkler
296 Strong product quality and internal quality controls
ISO 9001:2015 ISO 14001:2015
for Quality management system for Environmental management Systems
ISO 22000: 205 ISO 50001:2011
for Food safety management for Energy management system
ISO 14064:2006
BS OHSAS 18001:2007
for Quantification and reporting of greenhouse
for Occupational health and safety management system
gas emissions and removals
BRC Issue 7: January 2015 SGF (SURE - GLOBAL – FAIR)
for Food safety management system for Exports to Europe
Kosher Halal
GMA — SAFE
National Certification System
for Food safety management system for customers in the
for Tissue Culture Raised Plants Management Cell
US
ISO/IEC 17025:2005 certifications
Global GAP certification
by the National Accreditation Board for Testing and
for Agri Park in Jalgaon
Calibration Laboratories
We have received 41 State, 172 National and 18 International Awards for outstanding exports, business practices,
excellence in sustainability, R&D achievements & entrepreneurship
Note: Please refer to the Appendix for more details
306 Experienced board and management team
Ashok Bhavarlal Jain Director since September 2005
Chairman Joined the management team in 1982 and has since then served in various senior positions with over 34 years of experience
Mr. Jain holds a degree in Commerce from Pune University
Anil Bhavarlal Jain Serves as Vice Chairman and Managing Director
Vice Chairman & Joined the management team in 1984 and was in charge of US marketing operations
Managing Director Mr. Jain holds a Commerce and Law degree from Pune and Mumbai University respectively
Ajit Bhavarlal Jain Joint Managing Director; serving as Director since May 2004
Joint Managing Director Joined Jain Irrigation Systems in 1984
Mr. Jain is an engineering graduate from Dnyaneshwar University
Atul Bhavarlal Jain Joint Managing Director; serving as Director since September 2009
Joint Managing Director Been with the firm since 1992
Mr. Jain holds a graduate degree in Commerce from Pune University
R Swaminathan Executive Director; servicing as Director since September 2005
Executive Director Over 43 years of experience in operation and maintenance activities of plants
Mr. Swaminathan holds a B.Tech in Chemical engineering from Coimbatore Institute of Technology
Devendra Raj Mehta Independent Director at JISL since December 2007 and serves as Chairman of Poly Medicure
Independent Director Mr. Mehta was a civil servant for almost 42 years and is an alumnus of Alfred Sloan School of Management, MIT, USA
Previously Deputy Governor of RBI and Chairman of SEBI
Ghanshyam Dass Independent Director since August 2009 and serves as a Senior advisor to KPMG
Independent Director Served in various senior roles in NASDAQ OMX group, HSBC, Wells Fargo and also is a Director of Mayar Infrastructure, Jubilant Agri
and Customer Products, Jubilant Industries, Powerica Ltd among others
Mr. Dass holds an Economics (Honours) and Linguistics degree from Delhi University and Jawaharlal Nehru University respectively
Vasant V Warty Independent Director since May 2004
Independent Director Previously served as Director of Ratnagiri Gas and Power, General Manager of Commercial Banking at SBI, Orissa and joined as a
Probationary Officer at SBI in 1966
Mr. Warty holds a Diploma in Managerial Accounting from Jamnalal Bajaj Institute
Radhika Pereira Independent Director since December 2005
Independent Director Currently serves as partner at Shardul Amarchand Mangaldas & Co. (Advocates & Solicitors)
Previously, she was founder and managing partner at Dudhat, Pereira and Associates (Advocates & Solicitors)
Ms. Pereira is an alumnus of Cambridge University and Harvard University
Harishchandra Prasad Independent Director since August 2014
Singh Founder and Chairman of the Confederation of Horticulture Associations of India (CHAI)
Independent Director Mr. Singh holds a M.Sc (Hort) with Gold Medal from Rajendra Agricultural University
31Financial profile
Consolidated Financial Statements
Summary Income Statement

      US$mm                                                                                US$mm
      Particulars                                         2014A          2015A    2016A    Particulars                                        1H16A    1H17A
      Net revenue from operations                           854            902      921
                                                                                           Total revenue from operations                        438      466
      Other income                                            7               6        7
      Total revenue                                         861            908      928    Cost of material consumed                            265      294
      yoy growth                                                          5.4%     2.3%    Employee benefits expense                             45       53
      Cost of material consumed                              497           522      523
                                                                                           Depreciation and amortization expense                 19       21
      Gross profit                                           364           386      405
      % to revenue                                        42.3%          42.5%    43.6%    Profit (loss) before other income, finance costs
                                                                                                                                                 33       41
                                                                                           and exceptional items
      Finance costs                                            69            69       70
      Depreciation and amortization expense                    30            36       39   Other income                                           3        4
      Total expenses                                         840           892      911    Finance costs                                         36       34
      Profit before exceptional items and tax                  21            16       17
                                                                                           Exceptional items                                      0        0
      Exceptional items                                        34            11        3
      EBT                                                    (13)             5       14   Profit before tax                                      0       12
      Taxation (Current tax)                                    3             1        0   Tax expenses                                          (1)      (1)
      Deferred Tax Adjustment                                (10)           (5)        1
                                                                                           Net profit                                             1       13
      Net profit                                              (6)             8       13
      % to revenue                                        (0.7%)          0.9%     1.4%    % to revenue                                        0.3%     2.8%
      Note: FYE as of March 31, FX rate USD/INR = 68.2
      FY financials as per Indian GAAP and 1H financials as per IND-AS

                                                                                           33
Consolidated Financial Statements
Summary Balance Sheet
US$mm US$mm
Particulars 2014A 2015A 2016A Particulars 1H16A 1H17A
Stockholders Equity 319 314 357 Total equity 313 407
Minority interest 3 - 10 Non controlling interest - 11
Long term borrowings 220 249 283 Non-current borrowings 240 201
Other long term liabilities 25 24 31 Other non-current financial liabilities 16 14
Short term borrowings 321 328 311 Deferred tax liabilities (net) 1 21
Trade payables 197 199 197 Current borrowings 373 358
Other current liabilities 119 115 126 Trade payables 203 212
Total 1,204 1,228 1,314 Other current financial liabilities 81 115
Goodwill on consolidation 32 37 43 Other current liabilities 27 22
Tangible assets 366 360 361 Total 1,265 1,373
Intangible assets 8 8 7 Goodwill on consolidation 50 50
Capital work-in-progress 12 8 9 Property, plant and equipment 368 356
Deferred tax assets (net) 18 20 23 Intangible assets 8 7
Long term loans and advances 47 43 43 Capital work-in-progress 10 19
Other non-current assets 16 21 23 Deferred tax assets 24 42
Inventories 269 272 281 Financial assets 40 42
Trade receivables 264 286 330 Inventories 308 348
Cash and cash equivalents 29 45 61 Trade receivables 268 316
Short term loans and advances 82 68 66 Cash and cash equivalents 31 27
Other current assets 61 51 58 Other current assets 142 146
Total 1,204 1,228 1,314 Total 1,265 1,373
Note: FYE as of March 31, FX rate USD/INR = 68.2
FY financials as per Indian GAAP and 1H financials as per IND-AS
34Consolidated Financial Statements
Summary Cash Flow Statement
US$mm
Particulars 2014A 2015A 2016A
Cash flow from operating activities:
Net profit before tax (13) 5 14
Adjusted for:
Depreciation and amortization expense 30 36 39
Un-realized forex (gain) loss 18 (1) (12)
Interest and finance charges 69 69 70
Dividend and interest income (2) (3) (3)
Operating profit before working capital changes 107 113 114
(Increase) decrease in trade and other receivables 19 (29) (49)
(Increase) decrease in loans and advances and other assets (44) 8 (5)
(Increase) decrease in inventories (17) (3) (9)
Increase (decrease) in trade payable, other liabilities and provisions 19 11 (1)
Cash flow generated from operations 85 101 50
Taxes paid (1) (4) (1)
Net cash flow from operating activities 84 97 48
Cash flow from investing activities:
Purchase of fixed assets (49) (32) (35)
Sale of fixed assets 10 2 1
Interest received 2 3 3
Net cash flow used in investing activities (43) (33) (42)
Cash flow from financing activities:
Total proceeds by way of issue of shares 0 0 16
Investment by minority shareholders 0 0 35
Increase (decrease) in term loans (net) (12) 17 46
Increase (decrease) working capital borrowings (net) 30 8 (17)
Interest and finance charges paid (68) (68) (70)
Dividend and dividend distribution tax paid (4) (4) (4)
Net cash flow from (used in) financing activities (47) (48) 5
Net increase (decrease) in cash and cash equivalents (6) 16 11
Note: FYE as of March 31, FX rate USD/INR = 68.2
FY financials as per Indian GAAP
35Consolidated Financial Statements
Summary Cash Flow Statement (cont’d)
US$mm
Particulars 1H16A 1H17A
Cash flow from operating activities:
Net profit before tax 0 12
Adjusted for:
Depreciation and amortization expense 19 21
Un-realized forex (gain) loss (14) (2)
(Gain) loss on derivatives 1 (0)
Finance costs 36 34
Provision for doubtful debts and advances written back (0) (2)
Dividend / interest income (1) (1)
(Increase) decrease in trade and other receivables 19 6
(Increase) decrease in loans and advances and other assets (16) (19)
(Increase) decrease in inventories (39) (73)
Cash flow generated from operations 4 (31)
Taxes paid (0) (2)
Net cash flow from operating activities 4 (31)
Cash flow from investing activities:
Purchase of fixed assets (15) (16)
Interest received 1 1
Net cash flow used in investing activities (18) (14)
Cash flow from financing activities:
Proceeds from term loan borrowings (net) 8 2
Proceeds from working capital borrowings (net) 29 45
Interest and finance charges paid (35) (31)
Net cash flow from (used in) financing activities 2 18
Net increase (decrease) in cash and cash equivalents (13) (29)
Note: FYE as of March 31, FX rate USD/INR = 68.2
1H financials as per IND-AS
36Appendix
Brand universe

      Micro irrigation systems, equipment & agri inputs

      Plastic products

      Green energy products

      Food products

                                                          38
Strong product quality and internal quality controls
Quality certifications for our manufacturing facilities in India
Certification Plant Location Products Covered
ISO 9001:2015 for quality Jalgaon MIS products, piping systems, PVC sheets, precision farming products, renewable energy, systems and
management system cultivated tissue culture plants
Alwar MIS products, piping systems, precision farming products and renewable energy systems
Bhavnagar MIS products and piping systems
Hyderabad MIS products and piping systems
Udumalpeth MIS products and piping systems
ISO 14001:2015 for Jalgaon MIS products, piping systems, PVC sheets, dehydrated onion and vegetable products and processed
environmental management fruit products
systems
Alwar MIS products, piping systems, precision farming products and renewable energy systems
Bhavnagar MIS products and piping systems
Hyderabad MIS products and piping systems
Udumalpeth MIS products and piping systems
Vadodara Dehydrated onion and vegetable products
ISO 22000: 205 for food safety Jalgaon Dehydrated onion and vegetable products and processed fruit products
management
Chittoor I Processed fruit products
Chittoor II Processed fruit products
BS OHSAS 18001:2007 for Jalgaon MIS products, piping systems, PVC sheets, dehydrated onion products and processed fruit products
occupational health and safety
Alwar MIS products, piping systems, precision farming products and renewable energy systems
management system
Bhavnagar MIS products and piping systems
Hyderabad MIS products and piping systems
Udumalpeth MIS products and piping systems
Vadodara Dehydrated onion and vegetable products
Chittoor I Processed fruit products
Chittoor II Processed fruit products
Global GAP certification Jalgaon Agri Park
39Strong product quality and internal quality controls
Quality certifications for our manufacturing facilities in India (cont’d)
Certification Plant Location Products Covered
ISO 50001:2011 for energy Jalgaon MIS products, piping systems, PVC sheets, precision farming products, renewable energy systems,
management system dehydrated onion products and processed fruit products
Vadodara Dehydrated onion and vegetable products
ISO 14064:2006 for All manufacturing All products
quantification and reporting of facilities
greenhouse gas emissions and
removals
BRC Issue 7: January 2015 for Jalgaon Dehydrated onion products and processed fruit products
food safety management Vadodara Dehydrated onion and vegetable products
system
Chittoor I Processed fruit products
Chittoor II Processed fruit products
SURE - GLOBAL - FAIR for Jalgaon Processed fruit products
exports to Europe Chittoor II Processed fruit products
Kosher Jalgaon Dehydrated onion products and processed fruit products
Vadodara Dehydrated onion products
Chittoor I Processed fruit products
Chittoor II Processed fruit products
Halal Jalgaon Dehydrated onion and vegetable products and process fruit products
Vadodara Dehydrated onion and vegetable products
Chittoor I Processed fruit products
Chittoor II Processed fruit products
GMA — SAFE for food safety Jalgaon Dehydrated onion and vegetable products
management system for
customers in the United States
National Certification System Jalgaon Cultivated tissue culture plants
for Tissue Culture Raised
Plants Management Cell
ISO/IEC 17025:2005 Jalgaon Agri Park
certifications by the National
Accreditation Board for Testing
and Calibration Laboratories
40Solving the finance requirements for farmers
Sustainable Agro-commercial Finance Limited
Overview of SAFL Shareholding pattern
JISL promoted Sustainable Agro-commercial Finance Ltd (SAFL) a
NBFC with an objective to serve Indian small farmers International Finance
Corporation (IFC)
SAFL started operations in July 2012 with head office in Mumbai 10%
SAFL currently has distribution network comprising of 67 offices spread
across Maharashtra, Karnataka and Madhya Pradesh Mandala Capital
20% Jain Irrigation
Plans to expand its operations further in existing states as well as in new
Systems Ltd
states such as Gujarat, Tamil Nadu, Rajasthan and Haryana
49%
It plans to have around 250 offices in next 5 years time
Current capital adequacy ratio of approximately 80%
Jain Family
21%
Financing solutions offered by SAFL Loan outstanding
MIS products
(Amount INR in millions)
farm equipment
piping systems
motors and pumps for lift irrigation
solar modules 2,184
2,040 1,917
crops
1,564
livestock
sheds 949
two wheel vehicles
contract farming
agricultural projects and
business ventures FY14 FY15 FY16 1H16 1H17
Average ticket size per loan: INR120,000
4142
You can also read