Evaluating the Performance of Public Transit Systems: A Case Study of Eleven Cities in China - MDPI
←
→
Page content transcription
If your browser does not render page correctly, please read the page content below
sustainability

Article
Evaluating the Performance of Public Transit Systems:
A Case Study of Eleven Cities in China
Di Yao, Liqun Xu * and Jinpei Li
 Antai College of Economics and Management, Shanghai Jiao Tong University, Shanghai 200030, China
 * Correspondence: lqxu@sjtu.edu.cn; Tel.: +86-137-6185-1178

 Received: 29 May 2019; Accepted: 26 June 2019; Published: 28 June 2019

 Abstract: This paper presents a super-efficiency network data envelopment analysis (SE-NDEA)
 model for 11 cities in China. The model focuses on measuring the performance of public transit
 system by integrating multiple stakeholders involved in the public transit system with the exogenous
 environment in which they operated. Thus, local authority, bus operators, passengers, uncontrollable
 environmental factors, and the externality of the public transit are all taken into account in
 the measurement framework and are both interrelated inputs and outputs. The measurement
 framework can simultaneously capture each public transit system’s production efficiency, service
 effectiveness, and operational effectiveness. Meanwhile, undesirable outputs, uncontrollable factors,
 and boundary-valued variables are considered. The paper evaluates the performance of public transit
 system of 11 Chinese cities from 2009 to 2016. The results reveal that the exogenous environment
 has a marked impact on the performance measurement of the public transit system. Super cities
 tended to perform better than mega cities, and mega cities tended to perform better than large cities.
 Furthermore, service effectiveness has a significantly positive correlation with production efficiency,
 and transit rail tends to perform better than the conventional bus. These findings have an important
 implication for China’s bus priority implementation and more general managerial insights for public
 transit development.

 Keywords: public transit system; performance measurement; exogenous environment; data
 envelopment analysis (DEA); efficiency and effectiveness

1. Introduction
      According to the recent statistical data, provided by the National Bureau of Statistics (NBS),
the total volume of passenger and freight flows was 6.65 million in 2017, which is almost 50% more
compared to the total passenger and freight volumes in 2007. However, such a significant increase in
passenger and freight flows has led to a series of problems to cities, including traffic congestion and
environmental pollution. In such circumstances, all transport modes, whether by sea, air, or land, have
to operate more efficiently to serve the growing demand and achieve sustainable development [1–4].
Among the transport modes in cities, public transit is an effective mode for relieving the pressure of
traffic congestion, especially during rush hours [5]. Therefore, from the perspective of the city, proper
management and good performance of public transit is beneficial to alleviating urban problems and
achieving the sustainable development of cities [6].
      In order to encourage people to use public transit, the Chinese government put forward the bus
priority policy in 2004, i.e., it has been implemented for over ten years. During this time, governments
at all levels have poured a large number of investments and financial support into the public transit
system. It should be noted that the public transit system in this paper refers to buses, trolleybuses,
and rail transit in the municipal districts at the city level, excluding public bicycles and taxis. With
strong support, certain achievements have been made. Taking Shenzhen as an example, in the period

Sustainability 2019, 11, 3555; doi:10.3390/su11133555                     www.mdpi.com/journal/sustainability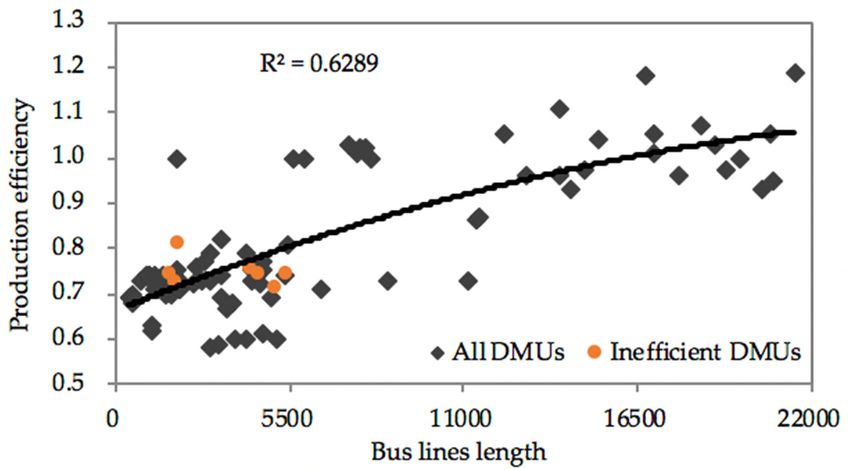
Sustainability 2019, 11, 3555                                                                        2 of 21

of 2008–2016, the subsidies to buses have risen from 1 billion to 5.103 billion RMB, and the annual
operating kilometers have increased by 362%. However, the increased investments and financial
support in successive years have caused a great burden on local governments, and seriously restricted
the sustainability of the bus priority development. Given that capital is a relatively scare resource in
developing countries, such as China, it is quite important to operate the public transit system efficiently
and effectively to obtain its own sustainable development [7]. Thus, a reasonable performance
evaluation of the public transit system is needed to measure the performance of public transit system
objectively, and identify the bottleneck in the public transit system operation.
       In terms of the public transit performance measurement, most papers have focused on the bus
operators’ performance measurement [8–11]. However, some researchers recognized the significant
influence of other factors on the performance of public transit and began to expand the measurement
framework from different perspectives. For example, Sheth et al. [12] assessed bus route performance
by taking bus operators, passengers, and societal perspectives into consideration. The societal variables
referred to the externality of public transit to the exogenous environment and included air quality, noise
pollution, natural resources, and safety. Kang et al. [13] also confirmed the impact of environmental
pollution on the efficiency evaluation of bus transit firms. Zhao et al. [14] considered three stakeholders,
namely, service providers, passengers, and community. They are interrelated intermediate inputs or
outputs. Yu and Fan [15] addressed the limitation with regard to uncontrollable environmental factors
(i.e., population density and car ownership). However, there has been no research to evaluate transit
system performance by integrating all relevant roles, i.e., taking into account both three stakeholders
in the transit system and the interaction between the transit system and its exogenous environment.
The interaction includes both the influence of uncontrollable environmental factors on public transit
performance and the externality of transit system to the exogenous environment. Besides, with the
expansion of measurement framework, some papers modified the traditional model to apply to various
settings, such as the consideration of uncontrollable factors [16] or undesirable inputs/outputs [17,18].
However, output variables with boundary values—such as passenger satisfaction, whose maximum
is 100—have not received attention yet. It should be noted that this neglect may overestimate the
efficiency score and result in misleading projections which should have contributed to efficiency,
especially for output-oriented models. Finally, most previous literature focused on the public transit
systems’ efficiency scores and rankings, while little attention was paid to find operational deficiencies
of inefficient systems and project them to efficiency. This is another important role that should be
considered in the performance evaluation.
       Consequently, the research questions to be answered in this paper are as follows: (1) How
to measure the performance of public transit by integrating multiple stakeholders involved in the
public transit system with the exogenous environment in which they operated? (2) Technically, how
to construct a measurement model by simultaneously considering uncontrollable environmental
factors, undesirable outputs, and boundary-valued variables? (3) In the case study, how to identify
operational deficiencies of the inefficient public transit system and propose feasible projections to
improve its performance? In a nutshell, this paper focuses on measuring the public transit system
more comprehensively and applicably.
       The remainder of this paper is organized as follows. Section 2 reviews the existing literature
with respect to the public transit performance measurement. Section 3 presents the performance
measurement framework of the public transit system, introduces the corresponding methodology, and
selects measurement variables. The first two research questions are answered in this section. Section 4
describes a case study and answers the last research question through this case. Section 5 summarizes
the conclusions, limitations, and future research directions.

2. Literature Review
     A wide variety of methods has been put forward by scholars and practitioners to measure
the performance of the public transit system [19–21]. In terms of the public transit efficiency, the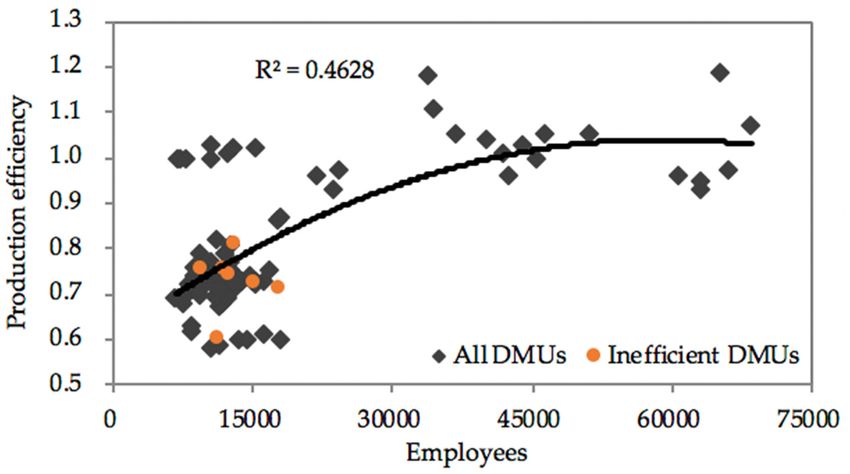
Sustainability 2019, 11, 3555                                                                       3 of 21

measurement methods are divided mainly into parametric analysis represented by the stochastic
frontier approach (SFA) [22–24], and nonparametric analysis represented by the data envelopment
analysis (DEA) [25–29]. Although one method is not strictly preferable to the other, the DEA method
has been more widely acknowledged and applied for the strength of avoiding subjective weight
determination and capturing the interplay between multiple inputs and outputs [30].
      The DEA, which is introduced by Farrell [31] and popularized by Charnes et al. [32], is an
analytical method that uses a linear programming technique to evaluate the relative performance of
decision-making units (DMUs). This method for evaluating public transit system is constantly ongoing
and affluent. This affluence mainly arises from multiple perspectives and diverse measurement models.
As discussed in Zhao et al. [14], the operation of public transit involves three stakeholders, namely,
bus operators, passengers, and local authority. Different stakeholders are concerned about different
issues, so different measurement perspectives can be obtained when considering different stakeholders.
More concretely, bus operators strive to minimize the operating inputs and maximize their economic
benefits and, thus, production efficiency is proposed to evaluate the service provision capacity of
bus operators by using production-oriented variables (e.g., vehicle-km or seat-km) [33]. Passengers
expect superior public transit service to meet their daily travel requirements and, accordingly, service
effectiveness is proposed to evaluate the service consumption capacity of passengers by employing
service-oriented variables (e.g., passengers or passenger-km) [27,34]. Governments focus on both their
own financial investments and the whole public transit system, so operational effectiveness is proposed
to evaluate the performance of public transit system by combining production efficiency and service
effectiveness [35–37] or by adding government input variables (e.g., the amount of subsidy) [38,39]. In
addition to three stakeholders within the public transit system, some researchers expanded public
transit performance measurement to a broader perspective. For example, Yu and Fan [15], and Karlaftis
and Tsamboulas [40] considered uncontrollable environmental factors (e.g., population density, car
ownership, and area) in the measurement model in order to eliminate the effects of the operating
environment on the performance of public transit. Kang et al. [13] found that bus transit firms’ technical
efficiency was affected by their environmental pollution. These studies showed that the performance
of public transit was impacted by the exogenous environment. However, none of the abovementioned
literature has taken all perspectives (i.e., local authority, bus operators, passengers, uncontrollable
environmental factors, and the externality of public transit) into account. Therefore, it is necessary to
integrate all perspectives to measure the performance of the public transit system at the city level.
      The multiple perspectives and settings have derived kinds of measurement models. Some papers
used the original CCR (Charnes-Cooper-Rhodes) and BCC (Banker-Charnes-Cooper) that respectively
assume constant return to scale (CRS) and variable return to scale (VRS) to measure public transit
performance [25,40], but most papers paid more attention to improving the measurement approach
by modifying DEA or combining DEA with other models. For example, given that transit firms may
generate both desirable and undesirable outputs while some of which may only take integer values,
Chen et al. [18] proposed an integer DEA model with undesirable inputs and outputs. Boame [26]
used a bootstrap DEA to estimate technical efficiency for Canadian transit systems from 1990 to 1998.
The bootstrap method may estimate bias and confidence intervals for the efficiency scores in order to
assess their precision. Zhang et al. [39] combined the information entropy theory and super-efficiency
DEA to evaluate 13 transit operators in Yangtze Delta of China. All model improvements were
aimed at enhancing measurement models’ applicability and discrimination capability. Nevertheless,
existing studies ignored the consideration of measurement variables with boundary values, such as
passenger satisfaction. This neglect may overestimate the efficiency score for output-oriented models.
Furthermore, an important purpose of public transit performance measurement is to find operational
deficiencies and propose feasible projections to improve the performance of inefficient transit systems,
but only a few studies have carried out efficiency frontier analysis [16,41].
      In a nutshell, most previous studies evaluating the public transit system have considered one or
just a few perspectives, and have not included all the perspectives thought to influence public transit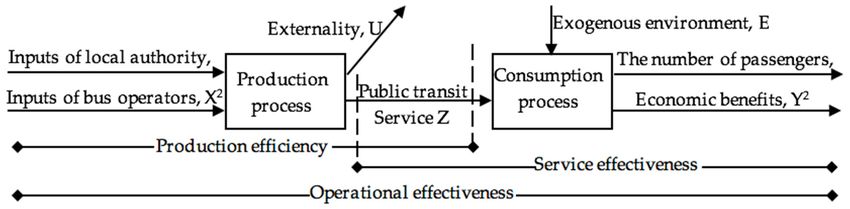
Sustainability 2019, 11, x FOR PEER REVIEW 4 of 21
improve the performance of inefficient transit systems, but only a few studies have carried out
efficiency frontier analysis [16,41].
Sustainability 2019, 11, 3555 4 of 21
In a nutshell, most previous studies evaluating the public transit system have considered one or
just a few perspectives, and have not included all the perspectives thought to influence public transit
system evaluation.Second,
system evaluation. Second,it itcannot
cannot be be ignored
ignored thatthat the measurement
the measurement variables
variables with boundary
with boundary values
values
may lead may to lead to overestimating
overestimating of the efficiency
of the efficiency score,
score, and noand no studies
studies have addressed
have addressed this Third,
this issue. issue.
Third, inefficient public transit systems have rarely been further investigated. These
inefficient public transit systems have rarely been further investigated. These considerations represent considerations
represent
significant significant gaps in the
gaps in the literature. literature.
Therefore, thisTherefore,
study attemptsthis study attempts
to address these to
gapsaddress
found inthese gaps
previous
found
researchin byprevious researchall
(1) integrating byrelevant
(1) integrating all relevant
perspectives into the perspectives into
public transit the public
system transit namely,
evaluation, system
evaluation,
local authority, namely, local authority,
bus operators, passengers, bus operators, passengers,
uncontrollable environmental uncontrollable
factors, and theenvironmental
externality of
factors, and (2)
public transit; theconstructing
externalitya measurement
of public transit;model by (2) simultaneously
constructing considering
a measurement model by
boundary-valued
simultaneously considering boundary-valued variables, uncontrollable environmental
variables, uncontrollable environmental factors, and undesirable outputs; and (3) projecting inefficient factors, and
undesirable outputs; and (3) projecting
transit systems to efficiency in a case study. inefficient transit systems to efficiency in a case study.
3. Research
Research Design
Design
3.1. Measurement
3.1. Measurement Framework
Framework
The measurement
The measurement framework framework in in our
our study
study mainly
mainly expands
expands on on several
several major
major existing
existing studies.
studies.
First, public
First, public transit
transit system
system operation
operation is is aa complex
complex process
process involving
involving multiple
multiple stakeholders, i.e., bus
stakeholders, i.e., bus
operators, passengers, and local authority [14]. These three stakeholders
operators, passengers, and local authority [14]. These three stakeholders participate in the public participate in the public
transit system
transit system in indifferent
differentways.
ways.For Forexample,
example, fromfromthethe
busbusoperators’
operators’point of view,
point they input
of view, labor,
they input
fuel, and capital to produce public transit service, and obtain economic
labor, fuel, and capital to produce public transit service, and obtain economic benefits after the benefits after the process of
passengers’ consumption. From the passengers’ perspective, they consume
process of passengers’ consumption. From the passengers’ perspective, they consume the public the public transit service to
meet their
transit daily
service totravel
meet requirements.
their daily travel From the local authority’s
requirements. From thepoint localof view, theypoint
authority’s decideof whether
view, they or
not to expand or abolish the transit infrastructure [22]. Moreover, they
decide whether or not to expand or abolish the transit infrastructure [22]. Moreover, they may may provide financial subsidies
to bus operators
provide financialtosubsidies
ensure the regular
to bus production
operators of transit
to ensure service.production
the regular The subsidy of and investment
transit service. The are
involvedand
subsidy as local authority’s
investment input in the
are involved production
as local process.
authority’s input in the production process.
Second, it is worth noting that the exogenous
Second, it is worth noting that the exogenous environment in which environment in which the transit
the public public system
transit
system operated
operated may impact maythe impact the performance
performance of the transitof system.
the transit For system.
example, For example,
population or population
population
or population density are positively correlated with transit ridership,
density are positively correlated with transit ridership, while car ownership has a negative impact while car ownership has a
negative impact [42–44]. According to Banker and Morey [45], the
[42–44]. According to Banker and Morey [45], the comparison among DMUs should be conducted incomparison among DMUs should
abesimilar
conducted in a similar
or harsher or harsher
environment. Onenvironment.
the other hand, On the
the public
other hand,
transitthe publicintransit
system, turn, system,
may have in
turn, may have feedback or externality to the exogenous environment,
feedback or externality to the exogenous environment, such as accidents, emissions, and others. The such as accidents, emissions,
and others.ofThe
externality externality
public of public
transit also has atransit also has
significant a significant
influence on the influence
performance on the performance
evaluation [13].
evaluation measuring
Therefore, [13]. Therefore, measuring the
the performance performance
of the public transitof the publicshould
system transit not
system
onlyshould not only
investigate the
investigate the underlying structure of three different stakeholders
underlying structure of three different stakeholders in the public transit system but also pay in the public transit system but
also pay attention
attention to the interaction
to the interaction betweenbetween
the public thetransit
publicsystem
transitandsystem and its exogenous
its exogenous environment.
environment. Figure
Figure 1 presents the structure of a public transit system with respect to
1 presents the structure of a public transit system with respect to the three perspectives and its the three perspectives and its
interaction with the exogenous urban
interaction with the exogenous urban environment. environment.
Figure
Figure 1.
1. The
The structure
structure of
of the
the public
public transit
transit system.
system.
Finally, unlike ordinary manufacturing enterprises’ production and consumption process, the
consumption process of public transit service occurs simultaneously with the production process.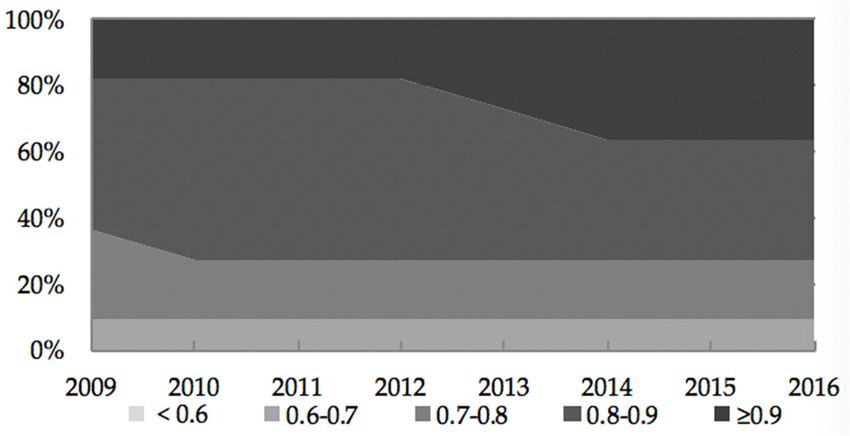
Sustainability 2019, 11, x FOR PEER REVIEW 5 of 21
Finally,
Sustainability unlike
2019, 11, 3555 ordinary manufacturing enterprises’ production and consumption process, 5 of 21the
consumption process of public transit service occurs simultaneously with the production process.
More concretely, the public transit service cannot be stored. Once the public transit service is
More concretely,
produced, it the public
ceases to transit service cannot
exist regardless be stored.it Once
of whether was the public transit
consumed [35]. service is produced,
Therefore, it is quite
it ceases
essential to identify the fact that only a portion of transit service is consumed in to
to exist regardless of whether it was consumed [35]. Therefore, it is quite essential identifyThe
general.
theconsumed
fact that only a portion
service of transit
may differ service
greatly from is the
consumed
produced in general.
service. To Thesolveconsumed service
this issue, Yu may differ[15]
and Fan
greatly from the produced service. To solve this issue, Yu and Fan [15] proposed
proposed production efficiency, service effectiveness, and operational effectiveness to measure the production efficiency,
service
public effectiveness,
transit system’s and operational
production effectiveness
performance,toconsumption
measure theperformance,
public transit and system’s
overallproduction
operational
performance, consumption performance, and overall operational
performance, respectively. Note that the operational effectiveness is obtained by combiningperformance, respectively. Note that
theproduction
operationalefficiency
effectiveness is obtained by
and service effectiveness.combining production efficiency and service effectiveness.
To To
sumsum up, according
up, accordingto ZhaotoetZhaoal. [14],ettheal.operation
[14], theofoperation
public transit involvestransit
of public three stakeholders,
involves three
i.e.,stakeholders,
the local authority
i.e., the local authority provides investment and financial support to thesystem,
provides investment and financial support to the public transit bus
public transit
operators produce the public transit service, and passengers then consume
system, bus operators produce the public transit service, and passengers then consume the public the public transit service.
According to Yu and
transit service. Fan [15] to
According and YuKarlaftis
and Fan and Tsamboulas
[15] and Karlaftis [40], and
in order to eliminate
Tsamboulas [40],the
in effects
order to
of eliminate
the operating environment on the performance of public transit,
the effects of the operating environment on the performance of public transit, it is it is necessary to incorporate
uncontrollable
necessary toenvironmental
incorporate factors into the measurement
uncontrollable environmental model.
factorsAccording
into theto measurement
Kang et al. [13],model.
the
feedback
According fromtopublic
Kang transit to exogenous
et al. [13], the feedback environment,
from publicnamely,transit to externality,
exogenous also has a significant
environment, namely,
impact on the performance measurement. Therefore, we take
externality, also has a significant impact on the performance measurement. Therefore, all perspectives (i.e., local authority,
we take all
busperspectives
operators, passengers, uncontrollable
(i.e., local authority, environmental
bus operators, factors. and
passengers, the externality
uncontrollable of public transit)
environmental factors.
intoand the externality of public transit) into account. Consistent with the discussionfive
account. Consistent with the discussion above, our measurement framework contains parts,our
above,
i.e.,measurement
inputs (the local authority’s
framework inputsfive
contains X1 , parts,
the bus operators’
i.e., inputs (the inputs 2 ), the intermediate outputs
localX authority’s inputs X1, the bus
(public transit service Z), outputs (the number of passengers Y 1 , bus operators’ economic benefits Y2 ),
operators’ inputs X ), the intermediate outputs (public transit service Z), outputs (the number of
2
uncontrollable
passengers Yenvironmental
1, bus operators’ factors
economic E, and the externality
benefits of public environmental
Y2), uncontrollable transit system U. Meanwhile,
factors E, and the
theexternality
measurement framework
of public transit can
systemsimultaneously
U. Meanwhile, capture each public framework
the measurement transit system’s production
can simultaneously
efficiency,
captureservice effectiveness,
each public transit and operational
system’s productioneffectiveness.
efficiency,Finally, the effectiveness,
service measurement framework
and operational of
theeffectiveness.
public transitFinally,
system the is shown in Figure 2.
measurement framework of the public transit system is shown in Figure 2.
Figure 2. The
Figure measurement
2. The framework
measurement of the
framework public
of the transit
public system.
transit system.
3.2.3.2.
Methodology
Methodology
3.2.1. SE-NDEA Model
3.2.1. SE-NDEA Model
Due to the network structure of the above measurement framework, we adopt the network DEA
Due to the network structure of the above measurement framework, we adopt the network
method, proposed by Färe and Grosskopf [46], as the fundamental model in this paper. Meanwhile,
DEA method, proposed by Färe and Grosskopf [46], as the fundamental model in this paper.
given that the advantage of super-efficiency DEA for ranking efficient DMUs further by excluding
Meanwhile, given that the advantage of super-efficiency DEA for ranking efficient DMUs further by
the DMU itself from the sample set [47], we combine these two models and generate super-efficiency
excluding the DMU itself from the sample set [47], we combine these two models and generate
network DEA (SE-NDEA). Moreover, there may be zero inputs in the measurement, for example,
super-efficiency network DEA (SE-NDEA). Moreover, there may be zero inputs in the measurement,
governments do not always provide subsidies to bus operators, so we choose an output-oriented model.
for example, governments do not always provide subsidies to bus operators, so we choose an
Assume that there are N DMUs and the jth DMU (j = 1, 2, . . . , N) uses input quantities Xj =
output-oriented model.
{X1 j , X2 j } to produce intermediate output quantities Zj and final output quantities Yj = {Y1 j , Y2 j }. 1
Assume that there are N DMUs and the jth DMU (j = 1, 2, …, N) uses input quantities Xj = {X j,
X2j} to produce intermediate output quantities Zj and final output quantities Yj = {Y1j, Y2j}. We also
assume that X = (xij)∈RM×N, Z = (zrj)∈RS×N and Y = (yoj)∈RL×N are non-negative. Then, the
output-oriented SE-NDEA model can be described asSustainability 2019, 11, 3555 6 of 21
We also assume that X = (xij )∈RM×N , Z = (zrj )∈RS×N and Y = (yoj )∈RL×N are non-negative. Then, the
output-oriented SE-NDEA model can be described as
max(w1 β1 + w2 β2 )
n
X j λ1j ≤ X j0
P
j = 1, j,j 0
n
Z j λ1j ≥ β1 Z j0
P
j=1, j,j0
DSE−NDEA n (1)
Z j λ2j ≤ β1 Z j0
P
j=1, j,j0
n
Y j λ2j ≥ β2 Y j0
P
j=1, j,j0
λ1 , λ2 ≥ 0, j = 1, 2, . . . , N
j j
where β1 and β2 denote the optimal efficiency score of the production process and consumption process,
namely, production efficiency and service effectiveness, respectively. If β1 ≤ 1, this indicates the DMU
is production-efficient. Otherwise, it is production-inefficient. Similarly, if β2 ≤ 1, this indicates the
DMU is service-effective, otherwise, it is service-ineffective. Note that the larger the β, the lower the
efficiency. λ1 and λ2 are positive intensity variables related to the production process and consumption
process. w1 and w2 are weight coefficients to define the relative importance of the two processes and,
thus, w1 + w2 = 1.
3.2.2. SE-NDEA Model with Undesirable Outputs
The SE-NDEA presented above assumes that all inputs and outputs are desirable, and means that
the more inputs, the more outputs, and more is always preferred to less [18]. However, the performance
measurement of the public transit system does not always abide by this assumption, due to different
measurement contents. For example, the outputs from public transit system operation may include the
number of accidents, noise pollution, and CO2 emissions, all of which are undesirable [12]. To solve this
issue, some other studies have introduced undesirable outputs by using their reciprocals or opposite
number to transform negative outputs into positive ones [38,48,49]. Nevertheless, according to Liu
and Sharp [50], the numerical transformation may distort the results, i.e., the evaluation reference and
the ranking results may depend on the transformation approach adopted. Thus, in this paper, we use a
more general and simpler alternative method proposed by Berg et al. [51], i.e., treating the undesirable
outputs as inputs, namely [INP]. The inequalities for dealing with undesirable outputs are given by
n
X
ZU j λ1j ≤ ZU j0 (2)
j=1, j, j0
n
X
YU j λ2j ≤ YU j0 (3)
j=1, j, j0
where ZU and YU are the quantities of undesirable intermediate outputs and undesirable final outputs,
respectively. If there are undesirable intermediate outputs in the process of production, we use
an inequality constraint (2) to compare the production efficiency by maintaining the undesirable
intermediate outputs of the j0 th DMU as no less than those of the samples. Based on the same idea, if
there are undesirable final outputs in the consumption process, the inequality constraint (3) is used to
compare the service effectiveness.Sustainability 2019, 11, 3555 7 of 21
3.2.3. SE-NDEA Model with Uncontrollable Constraints
As discussed in Section 3.1, uncontrollable environmental factors may have a significant impact
on the performance of public transit systems, such as population and car ownership [43]. Therefore,
in order to overcome limitations, we consider the exogenous factors by imposing constraints on the
consumption activity as follows:
Xn
EP j λ2j ≤ EP j0 (4)
j=1, j,j0
n
X
EN j λ2j ≥ EN j0 (5)
j=1, j,j0
where EP and EN are the quantity of two types of exogenous factors. According to Yu and Fan [15],
if exogenous factors have a positive correlation with the service effectiveness, we can compare a
public transit system’s service effectiveness in the case of keeping the exogenous factors equal to or
better than the circumstance they face by employing the inequality constraint (4). On the contrary, if
exogenous factors have a negative influence on the service effectiveness, an inequality constraint (5)
can be adopted to maximize the potential increase of the final outputs (e.g., the number of passengers)
for public transit system j0 while keeping the exogenous factors no better than the current circumstance
it faces.
3.2.4. SE-NDEA Model with Boundary-Valued Variables
It is worth noting that one may select ratio variables to measure the performance of public transit,
such as the error rate of average headway and passenger satisfaction [11,39]. However, previous studies
do not consider the presence of boundary on these ratio variables. This neglect may overestimate the
efficiency score for output-oriented models and result in misleading improvement projections which
should have contributed to efficiency. To solve this issue, we introduce additional constraints to Model
(1) by taking the following forms:
Xn
ZB j λ1j ≤ 100 (6)
j=1, j, j0
n
X
YB j λ2j ≤ 100 (7)
j=1,j, j0
where ZB and YB are the quantities of boundary-valued intermediate outputs and boundary-valued
final outputs, respectively. In the process of production, we apply an inequality constraint (6) to ensure
intermediate outputs with a ratio value of the j0 th DMU no more than 100, and the inequality constraint
(7) applies to the consumption process.
Ultimately, we develop the final SE-NDEA model as follows. We use ZD , ZU , ZB , YD , YU ,
and YB to respectively represent desirable intermediate outputs, undesirable intermediate outputs,
boundary-valued intermediate outputs, desirable final outputs, undesirable final outputs, and
boundary-valued final outputs, where ZD covers ZB and YD covers YB . It can be seen that constraints
(8)–(11) are the constraints of the original SE-NDEA model represented in Section 3.2.1, and constraints
(12)–(17) are added on the basis of the original model. Specifically, Constraint (8) is used for local
authority and bus operators’ inputs. Constraints (9) and (10) are applicable for desirable intermediate
outputs, such as vehicle kilometers. Constraint (11) applies to desirable final outputs, such as
ridership. Constraints (12) and (13) are used for undesirable outputs. More concretely, Constraint
(12) applies to undesirable intermediate outputs, such as CO2 emissions, death tolls, and Constraint
(13) applies to undesirable final outputs, such as passenger complaints. Constraints (14) and (15) are
used for boundary-valued outputs. Among them, Constraint (14) is applicable for boundary-valued
intermediate outputs, such as punctuality, and Constraint (15) is applicable for boundary-valued finalSustainability 2019, 11, 3555 8 of 21
outputs, such as passenger satisfaction. Constraints (16) and (17) are adopted to eliminate the impacts
of uncontrollable environmental factors. Furthermore, Constraint (16) is applicable for exogenous
factors that have a positive correlation with public transit system patronage, such as urban population,
whereas Constraint (17) is applicable for exogenous factors that have a negative correlation, such as
car ownership.
It should be noted that the network DEA and super-efficiency DEA are both linear programs [46,47],
and the constraints we added are a series of linear inequality constraints, familiar from DEA. Therefore,
the following SE-NDEA model is also a linear program. The added constraints do not increase the
complexity of the model solving. Regarding the linear programming problem, the software of MATLAB
(R2018b, The MathWorks, Inc., US) is a powerful tool due to its ready-made linear programming solver.
Thus, in this paper, we adopted the R2018b version of MATLAB to solve this model.
n
X
max(w1 β1 + w2 β2 ), s.t : X j λ1j ≤ X j0 (8)
j=1, j,j0
n
X
ZD j λ1j ≥ β1 ZD j0 (9)
j=1, j, j0
n
X
ZD j λ2j ≤ β1 ZD j0 (10)
j=1,j, j0
n
X
YD j λ2j ≥ β2 YD j0 (11)
j=1, j,j0
n
X
ZU j λ1j ≤ ZU j0 (12)
j=1,j, j0
n
X
YU j λ2j ≤ YU j0 (13)
j=1, j,j0
n
X
ZB j λ1j ≤ 100 (14)
j=1,j, j0
n
X
YB j λ2j ≤ 100 (15)
j=1, j, j0
n
X
EP j λ2j ≤ EP j0 (16)
j=1, j,j0
n
X
EN j λ2j ≥ EN j0 (17)
j=1, j,j0
λ1j , λ2j ≥ 0, j = 1, 2, . . . , N (18)
Finally, in order to be consistent with previous literature, i.e., the larger the efficiency score, the
higher the efficiency, we introduced the reciprocal of β, namely, θ1 = 1/β1 and θ2 = 1/β2 , to respectively
measure the production efficiency and service effectiveness. Moreover, in this paper, we considered
the production process to be as important as the consumption process, so we set w1 = w2 = 0.5, then
the overall performance of public transit system, i.e., operational effectiveness, is 0.5θ1 + 0.5θ2 .Sustainability 2019, 11, 3555 9 of 21
3.3. Variables Selection
We should not ignore the fact that the DEA scores are highly sensitive to the selection of input
and output variables [37]. Therefore, for the purpose of measuring the performance of the public
transit system more accurately and realistically, we selected inputs and outputs variables based on
the following principles: (a) the acceptance by the national and local department in charge of public
transit, (b) the application in previous studies, and (c) the availability of practitioners and researchers.
Regarding input variables of the local authority, the length of bus lines and subsidies have
often been used in previous literature [22,38,39]. Moreover, the bus prior line is a major measure for
governments to improve transit service (e.g., bus speed), so we used the length of bus prior lines as
the third input variable of the local authority. Regarding input variables of bus operators, we select
employees and vehicles to measure bus operators’ labor and capital. Regarding intermediate output
variables related to transit service, the conventional variable used in the previous network DEA is
vehicle kilometers [15,52]. However, vehicle-km only measures the quantity of public transit service
and does not consider the quality of the transit service. Thus, in addition to vehicle-km, we also
adopt average speed and punctuality to measure the public transit service quality. Regarding output
variables, bus ticket revenue and annual ridership respectively represent the bus operators’ economic
benefits and the number of passengers. In addition, from the passengers’ perspective, ridership
represents the passengers’ objective behavior, so we concurrently capture passenger satisfaction as
another final output for measuring the passengers’ subjective perception [53]. Note that the punctuality
and passenger satisfaction are both variables with boundary values. Regarding externality variables,
because public transit has the positive externality of reducing traffic accidents, we choose the death toll
for measuring the feedback of the public transit system on the external environment. This externality
variable needs to be minimized. At last, regarding uncontrollable environmental variables, population
and car ownership were considered, referring to earlier literature [42–44]. All descriptions and sources
of variables used in this paper are shown in Table 1.
Table 1. Variables used in the super efficiency network data envelopment analysis (SE-NDEA) model.
Variables Description Sources
Subsidies (million RMB), X1 Total annual government subsidies Municipal Bureau of Finance
Bus lines length (km), X2 The length of operating bus lines Local Statistical Yearbook
The length of operating bus prior
Bus prior lines length (km), X3 Local Statistical Yearbook
lines
Employees (one), X4 The number of employed workers Municipal Transport Commission
The number of vehicles in
Vehicles (one), X5 Local Statistical Yearbook
operation
Vehicle-km (10,000 km), ZD 1 Total annual operating kilometers Local Statistical Yearbook
Speed (km/h), ZD 2 Average speed in peak hours Municipal Transport Commission
The ratio of punctual trips to all
Punctuality (%), ZB Municipal Transport Commission
trips
Revenue (10,000 RMB), YD 1 Annual bus ticket revenue Municipal Transport Commission
Ridership (10,000), YD 2 Annual ridership Local Statistical Yearbook
Average score of specified
Passenger satisfaction (%), YB Municipal Transport Commission
questionnaires
Death toll (one), ZU 1 The number of traffic accidents Municipal Transport Commission
Population (10,000), EP The number of habitual residents Local Statistical Yearbook
Car ownership (10,000), EN The number of private cars Local Statistical Yearbook
4. Empirical Study
4.1. Data
In this study, the unit of analysis is the public transit system. Thus, annual data at the city level
are used. Although bus priority policy was put forward in China in 2004, most cities have not been
implemented until 2008. Therefore, we will perform an empirical study with the data correspondingSustainability 2019, 11, 3555 10 of 21
to an eight-year period, from 2009 to 2016. Measure the performance of the public transit system in
this period is meaningful for China.
We collected a set of empirical data from 11 Chinese cities: Shenzhen, Guangzhou, Shijiazhuang,
Suzhou, Jinan, Hangzhou, Hefei, Taiyuan, Urumqi, Haikou, and Yinchuan. These are all exemplary
cities of transit metropolis construction in China. Their public transit performance is representative
to a certain extent. According to the “Notice on Adjusting the Standard of Urban Size” proposed by
China’s State Council in 2014, these cities are divided into three categories based on the populations of
habitual residents, as shown in Table 2. One year in each city is considered as a DMU. Table 3 provides
the variables’ descriptive statistics for the dataset.
Table 2. Decision-making units (DMUs).
Urban Size Population City Name
Super city Equal to or more than ten million Shenzhen, Guangzhou, Shijiazhuang, Suzhou
Mega city Between five million and ten million Jinan, Hangzhou, Hefei
Large city Between one million and five million Taiyuan, Urumqi, Haikou, Yinchuan
Table 3. Descriptive statistics.
Variables Max Median Min Mean Std. Deviation
Subsidies, X1 5190 260.64 26.91 993.62 1425.27
Bus lines length, X2 21462.2 4122.5 420 6526.81 6223.72
Bus prior lines length, X3 957 79.5 10 142.05 199.92
Employees, X4 68562 12505 6730 19111.49 15883.39
Vehicles, X5 17075 5100 1346 6625.23 4740.71
Vehicle-km, ZD 1 130450.6 19627.34 5792.67 34425.06 35365.93
Speed, ZD 2 99.25 71.79 50.6 73.44 11.34
Punctuality, ZB 32.71 20.07 10 21.09 5.09
Revenue, YD 1 871151 82254 13381.06 193245.38 245771.75
Ridership, YD 2 495646 73116 17378 122485.03 124229.47
Satisfaction, YB 94.02 76.68 65.5 77.9 6.77
Death toll, ZU 1 27 7 2 8.36 4.75
Population, EP 1404.35 759 187.85 721.12 367.85
Car ownership, EN 277.58 63.46 11.42 86.47 66.56
4.2. Results
4.2.1. Performance Review
After running the SE-NDEA model using the software of MATLAB, we obtain 11 cities’ production
efficiency, service effectiveness, and operational effectiveness from 2009 to 2016. All scores are presented
in Tables A1–A3 in the Appendix A. Note that if the score of efficiency or effectiveness is equal to or
greater than unity, it is considered “efficient”. If the score is between 0.8 (inclusive) and 1, it is “fairly
efficient”. If the score is less than 0.8, it is “inefficient”. Table 4 summarizes the overall performance
results of all cities and their ranking order. It is worth noting that the overall performance of a city is
calculated by the average score from 2009 to 2016.Sustainability 2019, 11, 3555 11 of 21
Table 4. The average efficiency and effectiveness score for all DMUs.
Production Service Operational
Urban Size DMUs Efficiency Effectiveness Effectiveness
Score Rank Score Rank Score Rank
Shenzhen 1.01 2 0.97 3 0.99 2
Guangzhou 1.06 1 1.04 1 1.05 1
Super city Shijiazhuang 0.76 5 0.7 10 0.74 10
Suzhou 1.01 2 0.83 8 0.92 3
Mean 0.96 I 0.89 II 0.93 I
Jinan 0.73 6 0.94 4 0.84 6
Hangzhou 0.85 4 0.85 7 0.85 4
Mega city
Hefei 0.73 6 0.76 9 0.75 9
Mean 0.77 II 0.85 III 0.81 II
Taiyuan 0.6 11 0.70 10 0.65 11
Urumqi 0.72 9 0.93 5 0.83 8
Large city Haikou 0.74 8 0.93 5 0.84 6
Yinchuan 0.70 10 0.99 2 0.85 4
Mean 0.69 III 0.89 I 0.79 III
As can be seen, these operational effectiveness scores are between 0.65 and 1.05. This shows that
there are great differences in the public transit operation among cities. There was only one city whose
public transit operation was considered effective—Guangzhou. Moreover, Guangzhou was also the
only city that achieved efficient production and effective service at the same time. Meanwhile, nearly
two-thirds of cities have a fairly effective public transit system. They are Shenzhen, Suzhou, Hangzhou,
Yinchuan, Jinan, Haikou, and Urumqi. Finally, public transit operation in Hefei, Shijiazhuang, and
Taiyuan were ineffective. Taiyuan, in particular, had the worst public transit performance among all
cities. This is due to the fact that Taiyuan’s outputs are insufficient compared with other cities. For
example, the passenger satisfaction of Taiyuan is relatively low according to its operational data.
From the overall perspective, super cities tended to perform better than mega cities, and mega
cities tended to perform better than large cities. It is interesting to find that some cities tend to
perform well on one measure and perform badly on the other. For example, Yinchuan has relatively
high service effectiveness (0.99) and low production efficiency (0.70). Further, Figure 3 presents
the service effectiveness versus production efficiency of all DMUs. For super cities, the service
effectiveness was generally lower than the production efficiency, whereas, for large and mega cities,
the service effectiveness was generally higher. These results suggest that, for a number of exogenous
and operational reasons, a city with a large population is more likely to be production-efficient
than service-effective.
The above conclusion raises the question: How are production efficiency and service effectiveness
related? Using the scores of production efficiency and service effectiveness of all DMUs, the correlation
coefficient between the two variables was calculated. The value of Pearson correlation is 0.386, and the
p-value equal to 0.000 is smaller than 0.05 (2-tailed). This implies that service effectiveness has a
significantly positive correlation with production efficiency, i.e., a city that performs well in production
process tends to also perform well in consumption process. This is consistent with the findings by
Karlaftis [35].
From the time dimension, Figure 4 shows the operational effectiveness trends from 2009 to 2016.
In particular, the proportion of operational effectiveness less than 0.7 remains constant (9.09%), and the
operational effectiveness between 0.7 (inclusive) and 0.9 decreased by 18.18%, and the corresponding
operational effectiveness which is equal to or greater than 0.9 increased by 18.18%. Clearly, there has
been a steady increase in the performance of public transit system. This indicates that the bus priority
policy has had a positive effect in China.Mean 0.77 Ⅱ 0.85 Ⅲ 0.81 Ⅱ
Taiyuan 0.6 11 0.70 10 0.65 11
Urumqi 0.72 9 0.93 5 0.83 8
Large city Haikou 0.74 8 0.93 5 0.84 6
Yinchuan
Sustainability 2019, 11, 3555 0.70 10 0.99 2 0.85 4 of 21
12
Mean 0.69 Ⅲ 0.89 Ⅰ 0.79 Ⅲ
1.3
1.2
Service effectiveness
1.1
1.0
0.9
0.8
0.7REVIEW
Sustainability 2019, 11, x FOR PEER 12 of 21
0.6
From the time dimension, Figure 4 shows
Super city the Megaoperational
city effectiveness
Large city trends from 2009 to
2016. In particular, the proportion
0.5 of operational effectiveness less than 0.7 remains constant (9.09%),
and the operational effectiveness0.5 between 0.7 0.7 (inclusive)
0.9 and1.10.9 decreased
1.3 by 18.18%, and the
corresponding operational effectiveness which Production
is equalefficiency
to or greater than 0.9 increased by 18.18%.
Clearly, there has been a steady increase in the performance of public transit system. This indicates
Figure3.3.Service
Figure Serviceeffectiveness
effectivenessversus
versusproduction
productionefficiency.
efficiency.
that the bus priority policy has had a positive effect in China.
The above conclusion raises the question: How are production efficiency and service
effectiveness related? Using the scores of production efficiency and service effectiveness of all
DMUs, the correlation coefficient between the two variables was calculated. The value of Pearson
correlation is 0.386, and the p-value equal to 0.000 is smaller than 0.05 (2-tailed). This implies that
service effectiveness has a significantly positive correlation with production efficiency, i.e., a city
that performs well in production process tends to also perform well in consumption process. This is
consistent with the findings by Karlaftis [35].
Figure 4. Operational effectiveness
Figure 4. effectiveness trends
trends over
over time.
time.
In
In addition,
addition, compared
compared to to conventional
conventional bus, bus, transit
transit rail
rail has
has the
the advantage
advantage of of large
large capacity,
capacity, high
high
speed, greater punctuality and energy saving, and is gradually shouldering
speed, greater punctuality and energy saving, and is gradually shouldering the backbone of urban the backbone of urban
public
publictransit
transitsystems.
systems. Hence,
Hence, an important
an important question needs to
question be answered:
needs Is transit rail’s
to be answered: operational
Is transit rail’s
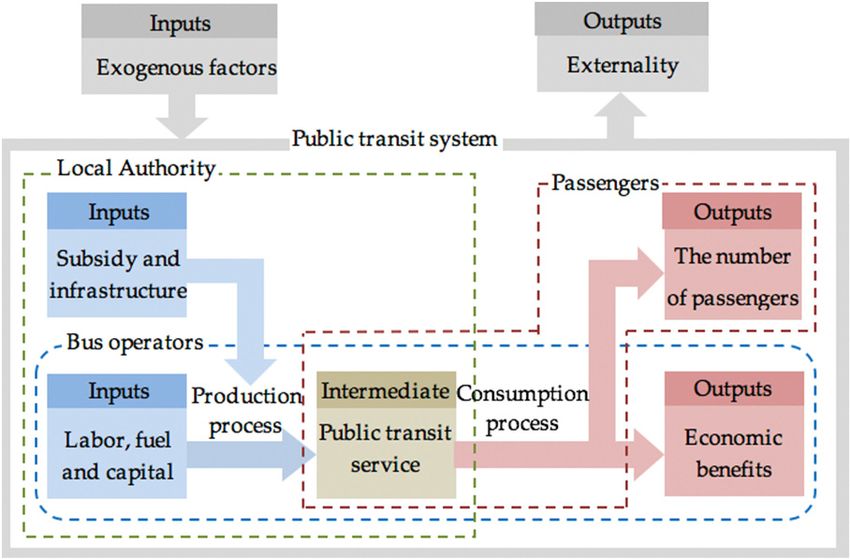
effectiveness higher than that of conventional bus? Figure 5 exhibits
operational effectiveness higher than that of conventional bus? Figure 5 exhibits a comparison a comparison between the two
modes in the four cities that have put transit rail into operation. The figure clearly
between the two modes in the four cities that have put transit rail into operation. The figure clearly reveals that transit rail
has surely
reveals thatmore operational
transit rail has effectiveness than conventional
surely more operational bus. However,
effectiveness even with this
than conventional bus.superiority,
However,
the transit rail does not always have the ability to improve the operational effectiveness
even with this superiority, the transit rail does not always have the ability to improve the operational of the whole
public transit system. For example, Suzhou’s average operational
effectiveness of the whole public transit system. For example, Suzhou’s average operational effectiveness of the whole system is
equal to that ofofconventional
effectiveness the whole system bus (0.92). This implies
is equal to that that Suzhou’s operational
of conventional effectiveness
bus (0.92). This implies has that
not
improved since the transit rail opened. Hangzhou’s operational effectiveness
Suzhou’s operational effectiveness has not improved since the transit rail opened. Hangzhou’s has even descended (0.89
to 0.85). It is remarkable
operational effectiveness that
hasShenzhen and Guangzhou
even descended (0.89 tohave respectively
0.85). put eightthat
It is remarkable andShenzhen
nine rail lines
and
into operation by the time of this study, and Suzhou and Hangzhou have
Guangzhou have respectively put eight and nine rail lines into operation by the time of this study, opened two and three lines,
respectively.
and Suzhou We andinfer that thehave
Hangzhou transit rail network
opened two and scale in alines,
three city may determineWe
respectively. whether the transit
infer that rail
the transit
has
rail anetwork
positivescale
effectinona the
cityoverall operational
may determine effectiveness
whether of the
the transit urban
rail has apublic transit
positive systems.
effect on the That is
overall
to say, in a city with a large-scale transit rail, the transit rail may improve
operational effectiveness of the urban public transit systems. That is to say, in a city with a the city’s overall operational
effectiveness;
large-scale transitotherwise, this transit
rail, the is not the railcase.
may improve the city’s overall operational effectiveness;
otherwise, this is not the case.
1.2 Average operational effectiveness of
1.0 conventional bus
0.8
Average operational effectiveness of
0.6
transit rail
0.4Guangzhou have respectively put eight and nine rail lines into operation by the time of this study,
and Suzhou and Hangzhou have opened two and three lines, respectively. We infer that the transit
rail network scale in a city may determine whether the transit rail has a positive effect on the overall
operational effectiveness of the urban public transit systems. That is to say, in a city with a
large-scale2019,
Sustainability transit rail, the transit rail may improve the city’s overall operational effectiveness;
11, 3555 13 of 21
otherwise, this is not the case.
1.2 Average operational effectiveness of
1.0 conventional bus
0.8
Average operational effectiveness of
0.6
transit rail
0.4
0.2 Operational effectiveness difference
0.0 between conventional bus and transit
-0.2 Shenzhen Hangzhou Suzhou Guangzhou rail
5. Operational effectiveness
Figure 5.
Figure effectiveness comparison
comparison between
between conventional
conventional bus
bus and
and transit
transit rail.
rail.
4.2.2. Exogenous Environment Analysis
To eliminate the impact of exogenous environment on the performance of the public transit
system, we integrated uncontrollable environmental factors and the externality of public transit into
the measurement framework. However, any differences resulting from introduction of these two types
of environmental variables has not yet investigated. Therefore, based on the panel data of 11 cities
from 2009 to 2016, we further calculated other operational effectiveness scores without considering
environmental variables, as shown in Tables A4–A6 in Appendix B. Furthermore, to test whether the
two operational effectiveness scores are significantly different, i.e., Table A3 vs. Table A6, we conducted
a nonparametric test (the Mann-Whitney U test). The Z value of the test is −3.372, and the p-value
equal to 0.001 is smaller than 0.05 (2-tailed). Thus, we reject the null hypothesis at a significance level
of 0.05, suggesting that the operational effectiveness under the two considerations are significantly
different. The exogenous environment has a marked impact on the performance measurement for the
public transit system.
4.2.3. Projecting to Efficiency
An important objective of performance evaluation of the public transit system is to identify
the deficiency in inefficient systems and propose feasible measures to improve their performance.
Specifically, each inefficient DMU needs to be projected onto the efficiency frontier derived from the
SE-NDEA model either by (a) decreasing the current level of inputs while maintaining outputs, or
(b) increasing outputs while maintaining the inputs [18]. Regarding public transit, because of the
great support by central and local governments due to its positive externalities, strategies that involve
decreasing inputs are always inapplicable. Thus, we chose strategies addressing (b) as our primary
measures. That is also one of the reasons why the output-oriented SE-NDEA was adopted in this paper.
Technically, an output-oriented DEA model obtains outputs’ movement quantities by efficiency
scores and slacks generated from the model. The efficiency scores represent the increased proportion
of outputs needed to move onto the efficiency frontier, namely, proportionate movement. The slacks
represent how much the outputs need to be increased before they come to affect their efficiency, namely,
slack movement [41]. In other words, the outputs with slacks equal to zero are the primary “short slabs”
which need to be projected. Based on this idea, we proposed projections that can make inefficient
transit systems achieve efficiency and effectiveness by proportionally increasing outputs whose slacks
are equal to zero and maintaining the current level of inputs. Table 5 presents the projections for seven
cities with an operational effectiveness in 2016 of less than 0.9.Sustainability 2019, 11, 3555 14 of 21
Table 5. Projections to efficiency.
Variables Shijiazhuang Jinan Hefei Taiyuan Urumqi Haikou Yinchuan
Original data
Vehicle-km, ZD 1 21594.38 25000 22914.06 16896 14319.63 8595.67 10353.67
Speed, ZD 2 19.58 16.7 19.5 19.2 21.49 21.99 24.19
Punctuality, ZB 64.8 69.8 71.6 55.3 73.67 74.67 70.94
Revenue, YD 1 69102 80000 73325 58657 114557 25787 31061
Ridership, YD 2 57354.66 78400 84323.75 35194.2 104246.87 24755.52 20500.26
Satisfaction, YB 71.8 94.02 80.1 71.6 75.68 76.18 83.8
Projection
Vehicle-km, ZD 1 28700.89 30840.90 32002.88 27948.22 19437.53 11511.54 14594.97
Speed, ZD 2 19.58 16.7 19.5 19.2 21.49 21.99 34.10
Punctuality, ZB 64.8 69.8 100 91.47 100 100 100
Revenue, YD 1 69102 80000 73325 81923.18 114557 25787 31061
Ridership, YD 2 57354.66 78400 84323.75 35194.2 104246.87 27115.92 20500.26
Satisfaction, YB 100 100 100 100 75.68 83.44 83.8
Movement (difference between projection and original data)
Vehicle-km, ZD 1 7106.51 5840.9 9088.82 11052.22 5117.9 2915.87 4241.3
Speed, ZD 2 0 0 0 0 0 0 9.91
Punctuality, ZB 0 0 28.4 36.17 26.33 25.33 29.06
Revenue, YD 1 0 0 0 23266.18 0 0 0
Ridership, YD 2 0 0 0 0 0 2360.4 0
Satisfaction, YB 28.2 5.98 19.9 28.4 0 7.26 0
Sustainability 2019, 11, x FOR PEER REVIEW 14 of 21
ItIt is
is clear
clear that
that the
the movements
movements required
required for for Taiyuan
Taiyuan to to achieve
achieve operational
operational effectiveness
effectiveness are are
substantially larger than those for other six cities. Consistent with the previous
substantially larger than those for other six cities. Consistent with the previous analysis, this is analysis, this is basically
due to thedue
basically facttothattheTaiyuan
fact thatis Taiyuan
the most isinefficient
the mostand ineffective
inefficient andofineffective
all DMUs.ofThe vehicle-km,
all DMUs. The
punctuality,
vehicle-km, revenue,
punctuality, andrevenue,
passenger satisfaction
and passengerofsatisfaction
Taiyuan’s public transit public
of Taiyuan’s all need to be all
transit improved.
need to
Further,
be improved. in most cities, the
Further, projection
in most cities, values of speed,
the projection revenue,
values and ridership
of speed, revenue, have the samehave
and ridership levelthe
as
their original data, but other variables, i.e., vehicle-km, punctuality,
same level as their original data, but other variables, i.e., vehicle-km, punctuality, and passengerand passenger satisfaction, are
frequently
satisfaction, projected. This illustrates
are frequently the fact
projected. Thisthat these Chinese
illustrates cities,
the fact thatwith inefficient
these Chineseandcities,
ineffective
with
transit system, have a scarcity of transit service and a relatively bad
inefficient and ineffective transit system, have a scarcity of transit service and a relatively subjective impression regarding
bad
the passengers’
subjective perspective.
impression regarding the passengers’ perspective.
Figures
Figures6–8 6–8describe
describe thethe
relationships
relationshipsbetweenbetweenproduction efficiency
production for all public
efficiency for alltransit
publicsystems
transit
and their inputs. We can see the trend that the efficiency scores experience
systems and their inputs. We can see the trend that the efficiency scores experience a process a process of first rising,ofthen
first
declining
rising, then withdeclining
the increase withof subsidies,
the increase bus oflinesubsidies,
lengths, and busemployees.
line lengths, Such a relationship
and employees.suggests
Such a
the efficiency suggests
relationship suffers from thenegative
efficiency impact
suffersdue to annegative
from excess inimpact
public due
transit
to system inputs.
an excess Specifically,
in public transit
the
system inputs. Specifically, the seven DMUs with operational effectiveness in 2016 of less than6–8
seven DMUs with operational effectiveness in 2016 of less than 0.9 are also shown in Figures 0.9
as red points. As can be seen, the inputs of these cities are much less than
are also shown in Figures 6–8 as red points. As can be seen, the inputs of these cities are much less the maximum peak value
derived
than thefrom maximum the 11 peak
Chinesevaluecities, revealing
derived from the the 11fact that a great
Chinese cities,deal of support
revealing and
the fact investment
that a great dealin
public transit are still required for these Chinese cities.
of support and investment in public transit are still required for these Chinese cities.
1.3
R² = 0.663
Production efficiency
1.1
0.9
0.7
All DMUs Inefficient DMUs
0.5
0 1000 2000 3000 4000 5000 6000
Subsidy
Figure 6. Production
Figure 6. Production efficiency
efficiency versus
versussubsidies.
subsidies.You can also read