All-Electric Bus Town - Milton Keynes Council
←
→
Page content transcription
If your browser does not render page correctly, please read the page content below
All-Electric Bus Town

Call for Expressions of Interest
Application Form
Applicant Information

Bidding authority: Milton Keynes Council

Area within authority covered by bid: All Borough

Bid Manager Name and position:                     Brian Matthews, Head of Transport Innovation

Contact telephone number: 07983 256051

Email address: brian.matthews@milton-keynes.gov.uk

Postal address:
Milton Keynes Council
Civic
1Saxon Gate East
Central Milton Keynes
MK9 3EQ

 This Expression of Interest is not intended to and shall not be construed in such a way as to, create any legally
           binding obligation on the Programme Collaborators in respect of what is contained herein.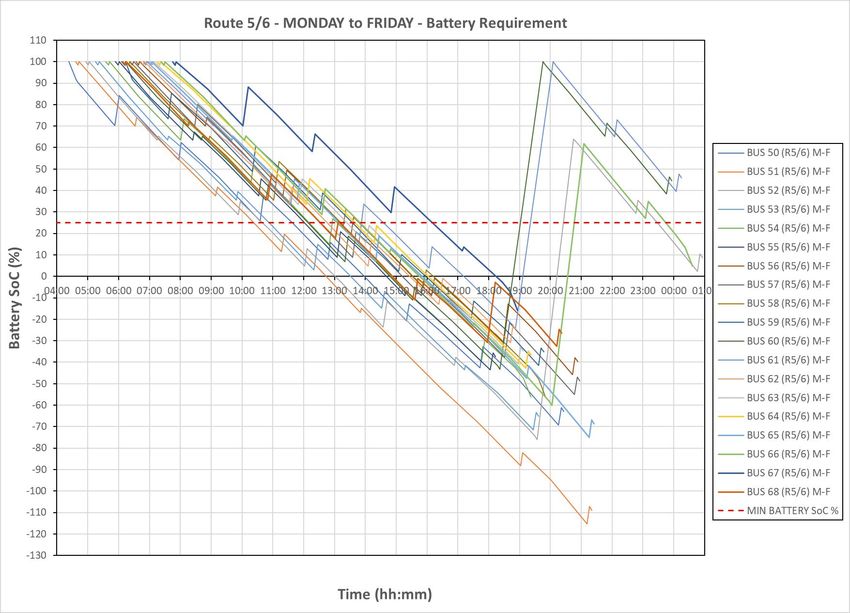
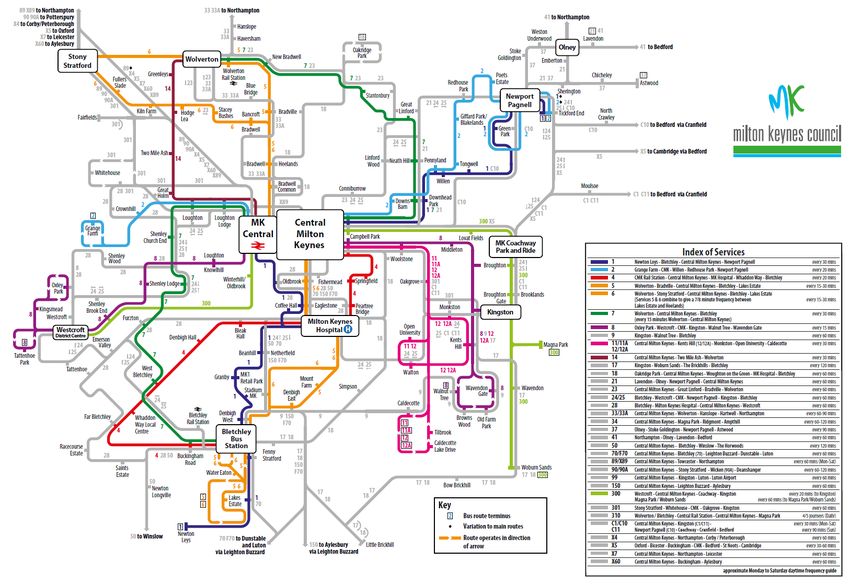
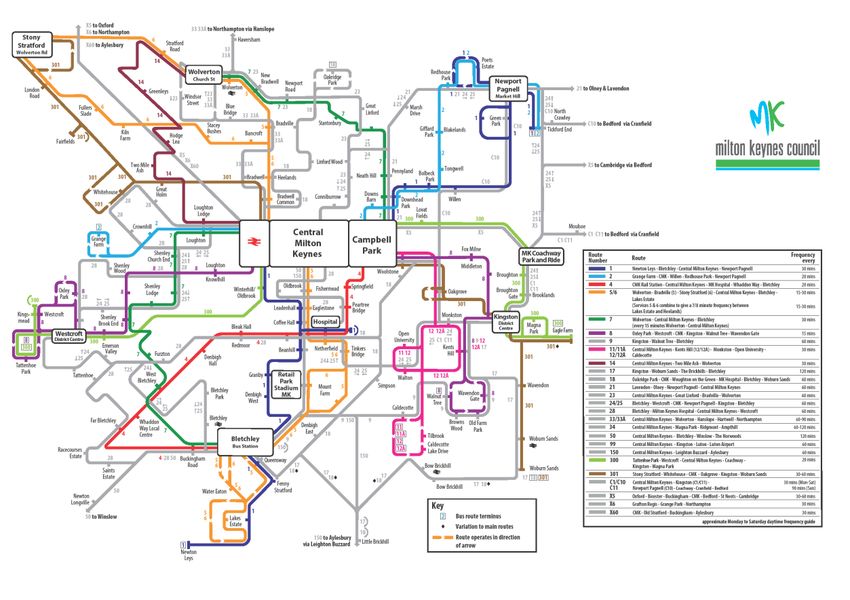
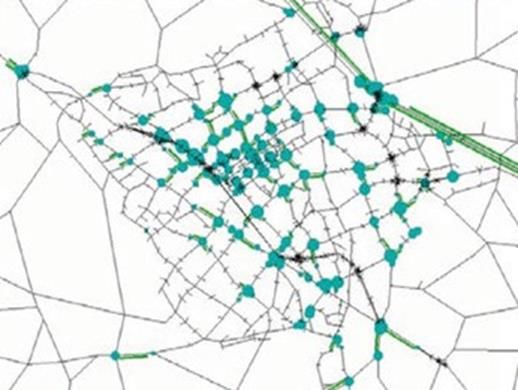
SECTION 1: Defining the place
1.1 Geographical area:

The proposals put forward in this Expression of Interest are designed to bring all-
electric bus services to the entire bus network in Milton Keynes. The network
connections and geographic coverage is shown in the illustrations below.
1.2 List of Local Operators
Milton Keynes bus services are dominated by one major operator (Arriva). Arriva
operate over 83% of bus services, with the balance being served by a variety of local
operators (see table below).

 Operator          Market   Fleet size   Type                             Passengers PA
                   Share    (peak)
                   (%)
 Arriva            83.3     96           Main urban and rural services         7,302,540
 Z&S               6.2      16           Subsidised (off peak/rural)             543,526
 Stagecoach east   3.3      -            Inter urban                             289,300
 Vale Travel       2.8      2            Subsidised (off peak/rural)             245,463
 Redline           1.5      2            Subsidised (off peak/rural)             131,498
 Uno               1.4      9            1 specialised route                     122,731
 Stagecoach        0.9      7            Inter urban                              78,898
 Midlands

Our proposal and its supporting business case is described in Section 4. It is
designed to accommodate all of the above operations. The council is currently
reviewing its approach to future subsidised service contracts, so it is not possible to
define which companies will provide services beyond October 2020. Accordingly, a
letter of support from Arriva is included in an annex to this submission, but no such
letters are available from the other operators.

1.3 Long Distance Routes

Two long-distance routes are served by Arriva from their base in Milton Keynes.
These are included in our proposals. However, long distance subsidised routes are
not included. (Milton Keynes supports longer distance regional routes, but these are
limited in scale and scope. They serve Cambridge to Oxford via MK, Peterborough
via Northampton to MK, and Luton to MK).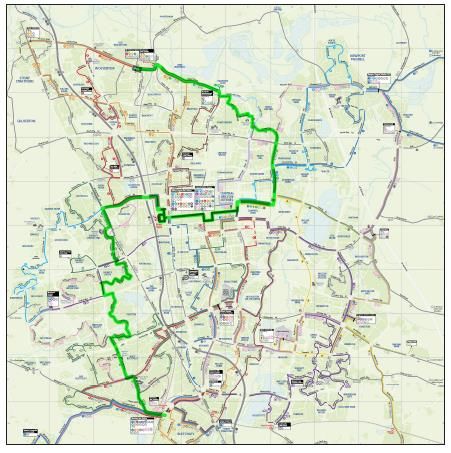
SECTION 2: Setting out the air quality challenge
Milton Keynes is a city with a great but eroding environmental advantage; it was
developed in a rural green field area from an urban plan which incorporated a low
density, low-rise, spatial layout supplemented by large green open spaces and a vast
amount of tree-planting. The result today is a vibrant economically active city of a
quarter of a million people with green urban environment, but with an over reliance on
car a means of transport and relatively low uptake of sustainable modes – and this
has started to create air quality challenges in a number of hot spots and without action
has the potential to affect the city. The city has recognised it is at a tipping point. The
city is committed to addressing this and core to the council plan is to become carbon
neutral by 2030 and carbon negative by 2050. A plan to maintain existing high
standards and address hot spots is essential to the future healthy development of the
city. Specifically, our local assessment has identified increasing concerns with air
quality along the M1 corridor t\which cuts through the borough and city, including
activity nodes at M1 J14 & J13. The challenge in older towns, where public transport
is at its highest, which built as a mixture of Victorian and post war urban design
(Newport Pagnell, Bletchley, Wolverton, Stoney Stratford and Olney) – Olney in
particular is a concern with an AQMA declared in 2008. Most of the focus of current
growth of the city is adjacent to the M1 motorway - the M1 J14 corridor and Newport
Pagnell and A509 route toward Olney and rural area. Failure to address new and
existing areas meeting AQMA concerns could in addition jeopardise the continued
growth and success of Milton Keynes as part of the Oxford Cambridge arc, identified
by the NIC as a key component of UK economic and social policy

Figure 2.1. Forecast congestion hotspots - 2026
The projections for traffic increase over the next two decades are a very important
proxy for the likely degradation of air quality. Travels demand will increase by over
60% in next 20 years (MK Transport Model Assessment, 2016) and as the city
continues its planned move towards a self-contained city, the growth in shorter range
journeys will concentrate local air quality problems through increased congestion,
creating hot spots for poor and potentially dangerous levels of air quality.
The city’s mobility strategy is working to address this. Successful measures are
already in place through the cities OLEV backed Go Ultra Low initiative to accelerate
the private vehicle fleet shift to electric. The city is expanding its cycle and pedestrian
networks and exploring electric scooter and micro mobility schemes. But given the low
density and polycentric nature of the city, these cannot support longer distance travel,
be effective in poor weather condition or support all those in society with mobility
challenges. Modernising and cleaning the bus fleet is now an imperative to complete
the transition to a comprehensive approach to address the current and future threat of
poor Air Quality
2.2 Addressing the air quality challenge
Current analysis of NO2 and PM10 illustrated in the attached graphs, show how we
expect the impact of moving to an all-city all-electric transport fleet will make on key
air quality indicators. These indicators illustrate the opportunity we have to ensure the
city can maintain and reduce the negative impacts of poor air quality. This preventative
approach we believe is the right approach, as to be complacent and allow the situation
to worsen will ultimately be significantly more expensive and more difficult to address.
This approach was discussed with DfT and along with addressing the current AQMA
and the city hotspot delivers significant progress in long term management and
prevention that aligns to the stated strategy of the council to address the carbon
challenge thus delivering positive outcomes for the city’s residents and visitor.

Direct Carbon Savings
The proposal will save around 4,000 tonnes of CO2 per year from the tail pipe
emissions from the bus fleet. This is based on a forecast 4.5 million route miles per
annum, with each bus saving 539gms CO2/km (or approx. 862gms/mile) compared to
its diesel alternative. However, it is the intention of this project to source all electricity
from a Green Energy Tariff (renewable sources). If account is taken of this strategy,
the tailpipe reduction in CO2 emissions jumps to 1163gms/km - yielding a total CO2
reduction of just over 8,000 tonnes per annum.
Leveraged Carbon Savings
Introducing EV buses to Milton Keynes on a large scale is part of a wider strategy to
encourage the take-up of ULEV’s around the city in pursuit of some very ambitious
city-wide carbon reduction targets. High quality EV buses are seen as an excellent
mechanism for influencing public opinion, either by persuading citizens to take the bus
in preference to the car (mode shift), or by influencing citizens to purchase their own
EV car (EV purchase). The mode-shift saving has been calculated by assuming the
new fleet will help meet the city’s target of doubling the patronage for public transport.
Using a cautious estimate, this will reduce car journeys within the city by around 2.5m
per annum, or 20 million vehicle miles. The EV purchase saving has been calculated
by assuming the city will be 50% of the way to achieving its ultimate goal for EV uptake
by the end of this programme (2022).
The carbon benefits to be gained from all sources are summarised in the table
below.

        Source           CO2gms/km savings             kms driven per year   CO2 Reduction
                            per vehicle                                       (tonnes/year)

 Bus Fleet                         1136                       7.2M               8,179
                         (electricity generated from
                             renewable sources)
 Private car journey                160                       32M                5,120
 reduction due to mode
 shift

 Increase in EV car                 140                       26M                3,640
 purchases (2,000
 vehicles/year)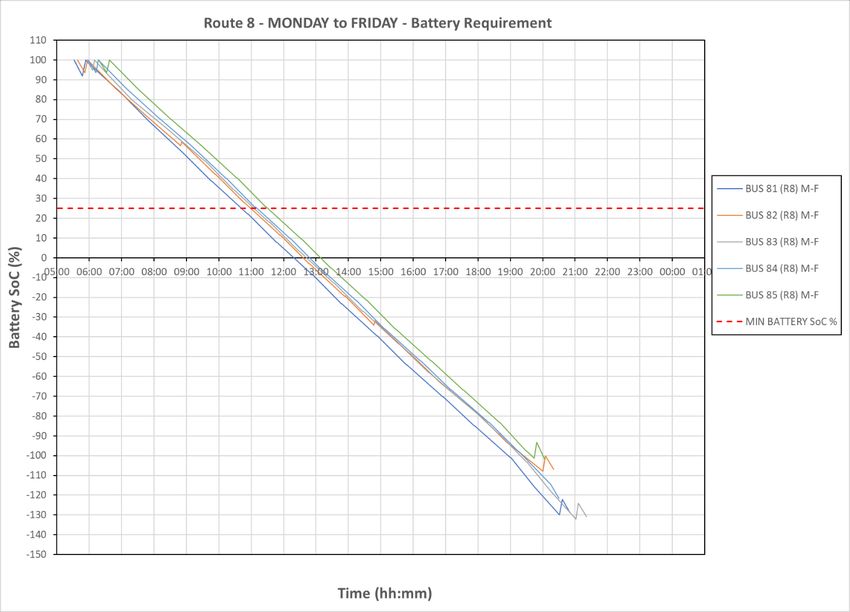
SECTION 3: Ambition
3.1: Vision and ambition for change
Milton Keynes adopted its sustainable strategy in 2019, in this the council gives it clear
commitment to address climate change caused by emissions by stating clearly that it
would be carbon neutral by 2030 and carbon negative by 2050.

‘Milton Keynes is a place where nothing has ever stood still, and innovation is
embraced. We are ambitious for the future of Milton Keynes and recognise that being
a truly sustainable city will require us to work cooperatively with our customers,
businesses and partners, while setting pioneering but achievable goals with a clear
framework on how to accomplish them.
Milton Keynes will strive to be carbon neutral by 2030 and carbon negative by 2050
while creating one of the world’s most truly sustainable economies and models for
growth.
Our three priorities as outlined in this strategy are: a green energy revolution, to ensure
the most efficient and low impact use of our resources, and to create a prosperous
circular economy.
These priorities ensure that as Milton Keynes grows we take advantage of the
opportunity to do so responsibly, creating energy resilience, maximising the use of
renewable energy, reducing our water usage, minimising transport emissions,
ensuring clean air, and an economic system that promotes a sustainable economy
that addresses the challenges of climate change.
                                            MKC Council Leader, Pete Marland, 2019.

The council produces an annual Air Quality Management update, within this report a
comprehensive suite of measures and initiatives are illustrated with commentary on
contributions they make to supporting the ambition set out above. The report identifies
over 30 complimentary measures designed to make a comprehensive and sustained
impact on delivering city wide sustainability.
The city is a world leading exemplar for delivering electric mobility through its Go Ultra
Low programme, delivering effective and innovative measures to make a difference in
accelerating the switch to EV. Our ambition in this field has led to deliver of a first of a
kind experience centre, one of the largest and most effective charging networks and
community-based charging hubs to address home charging. The same passion and
commitment will be applied to the AEBT initiative. The city operates an electric cycle
scheme and soon will deliver an e scooter initiative alongside its autonomous delivery
service via electric robots.
For public transport the council is currently implementing a number of measures to
support this change. Working with OLEV, the council has successfully delivered a
single route all electric bus – route 7 – using the technology and business model
outlined in this EoI for a network wide fleet. Again, working with the LEBS programme
delivered an innovative on demand small vehicle public transport service with partners
Via Van – this introduced services to compliment traditional larger vehicle services.
Currently the council is delivering a UTMC system designed specifically to improve bus reliability through Central Milton Keynes – this part of the national productivity improvement initiative. This will become live in 2021. Working with our Local Enterprise Partnership, SEMLEP we have developed an integrated ticketing platform that has delivered a cross ticketing and information platform to ease access to services. 3.2: Support for all-electric bus town and wider vision Milton Keynes Council, as a Unitary authority, is vested with the appropriate powers to support and take the strategic lead of this initiative. To demonstrate this commitment, we have included a letter of support from the council leader in the annex to this submission. The submission also includes a letter of support and commitment from the major operator in Milton Keynes – Arriva. Milton Keynes has enjoyed a long and productive relationship with Arriva, developing jointly relevant and practical experience of delivering innovative electric powered bus services. This partnership approach includes the visionary wireless bus demonstration project which was delivered by MKC and EFIS (the wider collaboration included Matsui Wrightbus and the local DNO – Western Power Distribution delivered the UKs first inductive charged all-electric bus service (Route 7). This initiative supported by DfT under the green bus fund initiative ran for more than 5 years in Milton Keynes has given us the appetite, confidence and experience to deliver a natural extension to the city electric bus fleet. In addition to this MKC enjoys a productive working relationship with Arriva covering a range of support measures which is backed by a ‘quality partnership’. This includes introducing a multi operator ticketing system via the Moove initiative, infrastructure improvements including a comprehensive programme of bus stop upgrades and moves to contactless payments. The council also worked with Arriva and all the other operators to identify the need for a new Urban Traffic Management Control system which focussed on improving bus journey time and reliability through major congestion hotspots. Collaborative work with Arriva has also included the deployment of real time sensor on buses which can detect seat availability and crowding - provide users with a real time feed designed to support greater bus use Additional stakeholder support has been gained from the local bus user group and business community. Our Local Enterprise Partnership (SEMLEP) supports the council’s initiatives to both improve bus services but also support the local industrial strategy which has a focus on delivering sustainable economic growth- so in terms of linkages to the LEP strategy this initiative address two fundamental priorities – the improvement of accessibility to jobs and business by creating a long term viable bus services, and supports the development of hi tech innovative and sustainable transport operators, and with that associated job creation. Milton Keynes Highways and their main contractors are well placed to support actual infrastructure delivery having installed 3 wireless charging units within MK. The council
through its work on the Go Ultra Low programme has a productive relationship with
the local DNO and through this channel can facilitate the delivery of grid connections.
SECTION 4: Deliverability

4.1 Deliverability plan
In this section, we outline our proposals for programme delivery, and explain our
business model. The business model is critical to the successful delivery of the
programme and our model is well proven in practice. It is based on a partnership
approach to bus fleet electrification that was originally developed by the Council
working with commercial collaborators in 2012. It has been used since then to
administer the Milton Keynes Electric Bus Demonstration Programme (see Appendix
1). The AEBT competition now provides a unique opportunity for the City to build on
the commercial and operational experience gained from that programme and use it to
accelerate the transition to all-electric bus services across the whole city.
The business model proposed here relies on a purpose-created ‘Enabling Company’
which will own all the assets. It will then lease the use of those assets to the various
bus operators in the City. The Enabling Company will also control the interfaces
between the Council, the bus operator, the bus manufacturer, and a raft of sub-
contracted suppliers during the period of programme mobilisation and equipment
procurement/commissioning.
Many of the organisations that collaborated on the previous programme will
collaborate once again to deliver the AEBT programme. The DfT can therefore have
a high level of confidence that the desired outcomes will be delivered successfully.
In the AEBT programme, the business model will be an enhanced version of the
business model conceived in 2012 (for details, see Appendix 2). The original formula
will be enhanced for two reasons:
       1) There has been valuable knowledge gained over the past 5 years of
          commercial operation and it is sensible to take advantage of this. In
          particular, operational experience suggests that annual repair and
          maintenance services should be added to the portfolio of responsibilities
          which are assigned to the Enabling Company.
       2) For AEBT, the model must accommodate multiple bus operators. This is a
          challenging requirement, particularly when some of those operators are
          small businesses/SME’s with a limited capacity to accept risk.
The enhanced business model is built on the recognition of, and response to, two
essential needs:
       •   The need to recognise the financial and operational risks that all-electric
           bus operations represent for each partner in the programme, and the
           assignment of those risks to the party best placed to cover them. (A
           summary of the key risks is included in Appendix 2)
       •   The need to provide a combination of vehicles and charging infrastructure
           which is both technically fit for purpose, and commercially accessible by all
           local bus operators on an even-handed basis.
A purchasing plan has been developed based on an assessment of the performance
requirements for the electric fleet (see Appendix 3 for details). The results have been
discussed with the principal bus service operator (Arriva) and our chosen vehicle
manufacturing partner (Wrightbus). In summary, the city-wide fleet (all operators) will
be just over 100 vehicles. The outline vehicle specification is summarised in Appendix
3. Budget costs and an outline delivery schedule have been identified and agreed in
principle.
The charging infrastructure will comprise a combination of depot-based cable-connect
systems (22kW per bus) and in-route high power ‘Opportunity Charging’ systems
(200kW per charger location).
It is considered that the energy demands of the routes in Milton Keynes represent a
challenging ‘corner case’ within the envelope of UK operational requirements. The
ability to operate these routes without compromise to customer service levels and
affordable operating costs therefore has a particular significance in terms of
developing a national approach to electrification.
The funding requested from DfT to support this programme is £32M.
4.2 Timescale for implementation
Discussions have been held with Wrightbus to establish their ability to supply a fleet
of vehicles which meets our outline specification. Work is already underway at the
company to bring a new family of all-electric buses to market during 2021. The
provisional delivery schedule which has been agreed fits the timeline for the
development and homologation of these new vehicles.
New vehicle delivery is the most influential factor in setting the overall programme (see
table below). Other critical issues which also influence programme delivery are:
1) The time required to authorise and execute legally binding collaboration
documents during the initial period of programme establishment.
2) The time required to complete the technical specifications and formal
processes associated with the issue of purchase orders for vehicles,
chargers, and electricity supply.
3) The lead times associated with connecting the charging units to the local
electricity distribution network. (This will require liaison with the local DNO.
It is a process which is well understood in Milton Keynes, where hundreds
of EV charging points have been installed and commissioned in the public
domain over the past 10 years).
4) The ‘transitional strategies’ which need to be adopted by the bus operators
during the phasing-in of electric vehicles and the displacement of their diesel
counterparts.Milestone Expected
completion date
Funding awarded October 2020
Enabling Company contracted to act on behalf of the December 2020
Council
Purchase Orders placed for electric buses, charging January 2021
equipment, and electricity supply
Charging equipment installations start May 2021
Charging equipment installations completed, connected, December 2021
and commissioned
First batch of electric vehicles delivered March 2022
Last batch of electric vehicles delivered January 2023
4.3 Monitoring and Evaluation
The approach to monitoring and evaluation will be informed by the previous
Demonstration Project in Milton Keynes. In that project, ‘monitoring’ comprised the
collection of multiple channels of real-time data via sensors and data-loggers mounted
on each bus. This data was supplemented by electricity consumption records which
were provided by the energy supplier, and operational records and customer surveys
which were provided by the bus operator (Arriva). ‘Evaluation’ comprised the regular
internal review of operational performance by Arriva, supplemented by periodic
meetings with the Enabling Company. Dissemination was achieved through frequent
presentations of experiences to date at public and professional fora.
Monitoring
An outline of the proposals for data monitoring and collection is presented in the
following table.
Category Source Data Type
Vehicle Monitoring On-board sensors Battery condition
Powertrain component
performance
Ancillary systems (heating,
A/C, PAS, etc)
Charging Infrastructure Meter records Power supplied by energy
Monitoring supplier
Charger system Power delivered to vehicle
records fleet
Operational Efficiency Enabling Company Fleet availability
records Vehicle maintenance
profiles
Bus Operator records
Customer Satisfaction Council surveys/Bus
operator surveys
Evaluation/Future LearningThe data collected via the monitoring programme will be evaluated continuously by the Enabling Company as part of the effort to ensure maximum operating efficiencies are achieved. The Enabling Company will work with DfT to provide wider access to key lessons learned via public and professional meetings, written articles, and any other reasonable mechanisms which DfT might require. 4.4 State Aid The council legal department provides state aid advice for projects such as this. In giving advice they have stated that previously for this type of grant and initiative the granting body may have sought exemption from state aid regulations in creating the fund to address a market failure. This [it is our understanding] has been the case in previous grant allocations in this area]. If this is the case the scheme will be delivered in line with the exemption rationale e.g if the exemption is to support ‘local bus services’ which contribute to addressing a market failure to consider environmental protection then the response will be through the detailed application set out how this scheme adheres to the exemption. This said, the approach advised by legal advisors is to set out the case for not being state aid via the mechanisms within the GBER. For this grant these should centre on mainly two exemptions 1. Addressing environmental protection 2. Delivering Research & Development and innovation. Within each of these GBER, the advice is that the project would need to consider the specifics of the initiative, for example, within the GBER R&D and innovation consider specific application and how this can be applied to the project in term of the percentage of support compared to the investment from the beneficiary of the aid. Advice was also given to consider notifying through OJEU the project and outlining how the project is not considered state aid, and then respond to any challenges that may emerge on specific points. Whilst this approach suggests an element of risk it can assist with getting a level of confirmation that the project does not involve State Aid, and if challenged can focus efforts on addressing where there in not clarity or determine an alternative approach is warranted. Further advice was given to consider tendering through the relevant mechanism some aspects of the project whereby the award of the grant can be allocated using EU procurement procedures, in this case this could apply to the infrastructure elements either as a whole package of by clearly rationalised sub packages, which in themselves may fall in the de minimus category – but care need to be taken to demonstrate the validity of this approach – ie not packaged to avoid state aid. Finally, whilst the position taken by the UK government appears to suggest that the UK will apply the same state aid regulations as currently in force by being part of the EU. Remaining uncertainty around Brexit could mean this position is revised.
ANNEX
Letters of Support
APPENDIX 1
The Milton Keynes Bus Demonstration Project

Summary:
The Milton Keynes Electric Bus Demonstration Project is described. This project was
recently concluded, having run successfully for the intended 5 years. During that
period, around 2 million bus-miles of front line operational experience were logged and
more than 2Tbytes of real-time data was captured and archived.
Introduction

In 2012, Milton Keynes Council worked with Arup and Mitsui to develop a bespoke
business model to fund and operate an all-electric bus demonstration service. The
project involved close collaboration between Arup, Mitsui, the Local Authority, Wright-
bus (the bus manufacturer), and Arriva (the bus operator). It was designed to run for
5 years and involved replacing all 8 diesel buses operating a single key route through
the city (Route 7).

The purpose of the demonstration programme was to explore the ability of an electric
bus fleet to operate to the demands of a regular public service timetable with a relia-
bility and cost profile that would match a conventional diesel fleet.

 Milton Keynes, showing bus route 7 (15 miles single leg journey; 16mph average
speed)

The ‘Enabling Company’
An innovative business model was developed in which multiple parties collaborated to
deliver the programme objectives This was done in order to manage the risks and
assign them to the parties most willing to share them.

At the centre of the arrangement a special-purpose company was created to manage
the programme, control the interfaces between the collaborators, and own the capital
assets (buses and charging infrastructure). This company was identified as ‘The Ena-
bling Company’ and had the formal company name of Electric Fleet Integrated Ser-
vices (eFIS). A diagram of the relationships between eFIS and the various collabora-
tors is shown below.

Programme Initiation

The first stage of the project was to conduct a detailed route analysis and develop a
technical and performance specification for the new electric vehicles. Milton Keynes
has particularly arduous bus duty cycles. The local fleet works 17 hours per day and
each bus covers more than 50,000 miles per year at an average speed of 16 mph (MK
has the fastest average route speeds in the UK for an urban bus service). This made
it particularly important that the energy needs of the route were properly understood
and that a suitable battery capacity could be defined. In 2013, a contract was placed
with Wrightbus for the procurement of an 8-bus fleet of 9.5m vehicles for delivery in
January 2014.

The Need for Opportunity Charging

It was (and is) not possible to provide sufficient on-board battery storage to enable the
buses to run all day without returning to the depot for interim re-charging. (The maxi-
mum vehicle energy requirement is in excess of 500kWh per day). For this reason, a
strategy of ‘Opportunity Charging’ was developed using 120kW wireless chargers
which were installed in the road at each end of the route. This strategy enabled buses
with relatively small, 150kWh, batteries to operate throughout the day without any
need to return to the depot for interim re-charge.

The electric buses running on Route 7 in Milton Keynes utilized high-power (120kW)
 induction power wireless chargers, one unit installed in the road at each end of the
                                       route.

Experience Gained
The demonstration programme ran continuously for 5 years over the period 2014 –
2019 and more than 2M bus-miles of operational experience was accumulated. During
this period, the vehicles were in constant front-line operation and a great deal of
experience was gained in fleet economics, operational organization, driver training,
vehicle maintenance, public relations, and customer perception.
Data Collection
Every day, more than 130 separate channels of information were recorded
continuously on each bus. Over the 5-year period, more than 2Tbytes of data were
collected and analysed.
The parameters logged included real-time records for:
   •   battery condition (state of charge; state of health; cell temperatures; etc),
   •   vehicle location and speed,
   •   motor and inverter input/output power,
   •   driveline torque,
   •   24v system demand, etc, etc.
The illustration below shows one example. It records how the battery state of charge
varies throughout the day on each bus in the fleet during one working week. The saw-
tooth characteristic of ‘Opportunity Charging’ throughout each daily cycle is clearly
evident. Records of electricity consumption from the grid were also kept, enabling
power flows to be compared on both sides of each charging device.
Real-time records of battery state-of-charge for all 8 buses during a particular week.
Note the saw-tooth characteristic associated with ‘Opportunity Charging’.
All the data has been catalogued within a cloud-based repository. The result is an
evidence-base comprising measurements which have been captured at a resolution
of 1Hz (typically) over some 2 million vehicle service miles. This data can now be
interrogated at will. As such, it represents a record of bus performance and battery
condition monitoring which is unique within the industry.APPENDIX 2 All Electric Bus Town - The Business Model Summary: The business model developed for the MK Electric Bus Demonstration Programme will be further developed by MK Council, working with eFIS, Mitsui, Arriva, Wrightbus, Engie and Forsee Power. The special-purpose company (Electric Fleet Integrated Services) will be re-used, but the working arrangements will be adapted to suit the present need. The business model must have sufficient flexibility to accommodate the needs of all the different bus operators which work in the city. For this reason, the model presented in this appendix is described at the level ot principle rather than detail. If this Expression of Interest leads to an invitation to make a 2nd Round bid, the full working details will be developed. It is possible that the finalised business model will be different is some respects to that which is described here.
Introduction

This appendix describes the business model which sits at the heart of our submission.
This model is designed to achieve three important goals:
       1) Remove the need for the local bus operators to make any up-front capital
          expenditure.
       2) Remove operator fears about maintenance, operational reliability, and
          battery life which are perceived to be associated with the new technology
          (this is a particular problem for the small operators)
       3) Achieve an annual cost to each operator which is comparable to the annual
          cost of running a comparable fleet of diesel buses (assuming the route
          timetables remain unaltered).
If these goals can be achieved, many of the barriers to participation by the local bus
operators can be removed.

Operator Barriers to Entry
There are multiple bus operators running local services in Milton Keynes. The
dominant operator is Arriva, with a fleet of nearly 100 buses operating from a single
depot at Wolverton in the north of the city. This commercial operation is supplemented
by a network of subsidised routes which are run by a variety of local bus companies.
Most of these companies are family owned businesses or SME’s.
The principal barriers to entry for all the bus operators are:
   •   The financial risk of investing in a fleet of brand-new new buses. (All of the local
       bus operators, including Arriva, have a policy of purchasing second-hand buses
       for the local service network).
   •   Fleet reliability and maintenance – will the vehicles be reliable and what will it
       cost to re-train maintenance staff and maintain the new fleet?
   •   The risk of the unknown – what if the new technology is reliable but has
       operational limitations (e.g. inadequate range; poor winter heating; etc.)?
In the present climate, bus operators have very limited capacity to take financial and
operational risks of this magnitude. The business model must therefore find a way of
mitigating them as far as possible.

The Business Model
Structure
The business model works by creating an ‘Enabling Company’ which will purchase
and own all the assets (vehicles plus charging infrastructure) for an agreed period –
probably 10 years, in this case. The Enabling Company will arrange installation and
commissioning of the charging equipment, and provide warranties and maintenance
services (working with the equipment suppliers) as appropriate.
The equipment and services will be made available to the local bus operators through
fully-serviced, 10-year, ‘wet’ leases with pre-defined terms. The exact details of each
leasing arrangement will be tailored to the needs of each operator. This will allow all
bus operators to participate in the scheme in a manner which is best suited to their
circumstances.
At the level of principle, the lease arrangements will cover:
• Provision of equipment (buses plus access to charging infrastructure)
• 24x7 vehicle servicing, repair, and maintenance.
• Equipment warranties (backed by the equipment suppliers)
• Fuel (electricity)
The organisational structure is illustrated in the diagram below. The named companies
are the ‘Programme Collaborators’. These organisations have worked together to
create this proposal, and each is committed to making a success of the programme.
The un-named sub-contractors will be appointed at the appropriate time through a
normal process of commercial tendering against a specification of requirements.
Structure of the ‘Enabling Company’ Business Model (with eFIS shown as the
Enabling Company)
Risk and MitigationThe business model enables an attractive lease price to be developed because it
allocates risk to those organisations which are best-placed to manage them. For
example, the organisation best able to assess the reliability and servicing
requirements of a novel bus fleet is the bus manufacturer, not the bus operator. The
organisation best able to manage the price of electricity over the term of the lease is
the electricity supplier. The organisation best able to define and accept revenue risk
on the subsidised routes is the Local Authority, etc, etc. Allocating the risks to those
best able to bear them results in the keenest means of risk-pricing.
The principal technical/financial risks which have been considered in the preparation
of this Expression of Interest are summarised in the table below.
Category Risk Mitigation Strategy Responsible
Party
Finance Cost of capital Work with ‘Blue chip’ eFIS/Mitsui
partners.
Build on previous
experience with Route 7 in
Milton Keynes
Increased PVR Simulation of duty-cycles in eFIS (through
liaison with bus appropriate
manufacturer and contractual
operators. arrangements with
Bus Service Extrapolate from previous the bus operators)
Operating experience with Route 7 in
costs Milton Keynes.
Fuel cost Arrange electricity supply Engie (via eFIS)
fluctuations contract with guaranteed
prices
Maintenance Place vehicle maintenance Wrightbus (via
cost responsibilities with bus eFIS)
uncertainty manufacturer
Reliability Purchase additional Wrightbus (via
Vehicle vehicles/secure eFIS)
Technology performance warranties
Risks Battery life (10 Secure performance Wrightbus/Forsee
years) warranties Power (via eFIS)
Reliability of Purchase additional ‘swap- Equipment
charging in’ units to ensure continuity suppliers (via
equipment of operations in the event of eFIS)
equipment failure. Secure
warranty & maintenance
agreements with suppliers.
Charging Overload of Simulation of system power eFIS/DNO
Infrastructure local demand profiles in liaison
Risks distribution with bus manufacturer and
network DNO. Extrapolate from
previous experience with
Route 7 in Milton Keynes.Single point of Specify charging eFIS
failure infrastructure to have
multiple points of network
connection.
Pricing
The principal components of the cost-base have been combined into pricing calculator.
This has been used to calculate the annual lease-price for each bus, working on the
principle that the annual lease price should be comparable to the annual costs of
running a conventional diesel service. With a grant of £32M, the Collaborating Partners
are confident this objective can be achieved.APPENDIX 3
All Electric Bus Town – Technical Assessment of
Route Requirements
Summary:
The routes operated by Arriva (which represent 85% of the passenger-miles delivered
by the MK bus network) have been analysed in detail. An energy requirement for the
vehicles which will serve each route has been developed.
A baseline vehicle configuration has been identified in which all buses will have an on-
board battery capacity of 450kWh, supplemented by a 200kW ‘Opportunity Charging’
capability. This means that all routes can be serviced without any need for increasing
the combined fleet PVR. (In a small number of cases, however, the service timetables
may need some minor adjustments).
A charging strategy based on a combination of cable-connect charging in the depot,
and ‘Opportunity Charging’ on the routes, is proposed for the following reasons:
• It guarantees that the range requirements for all routes can be met (Milton
Keynes services are an unusual combination of long routes with high average
speeds which are very energy intensive).
• It guarantees that all-electric heating can function properly at all times, even in
the most severe winter conditions.
• It distributes the fleet electricity demand around the city and avoids a
concentration of electric power at a single point on the network (the depot). This
helps the DNO with network balancing, and avoids the possibility of a single
point of failure disabling city-wide bus services.Route Assessments
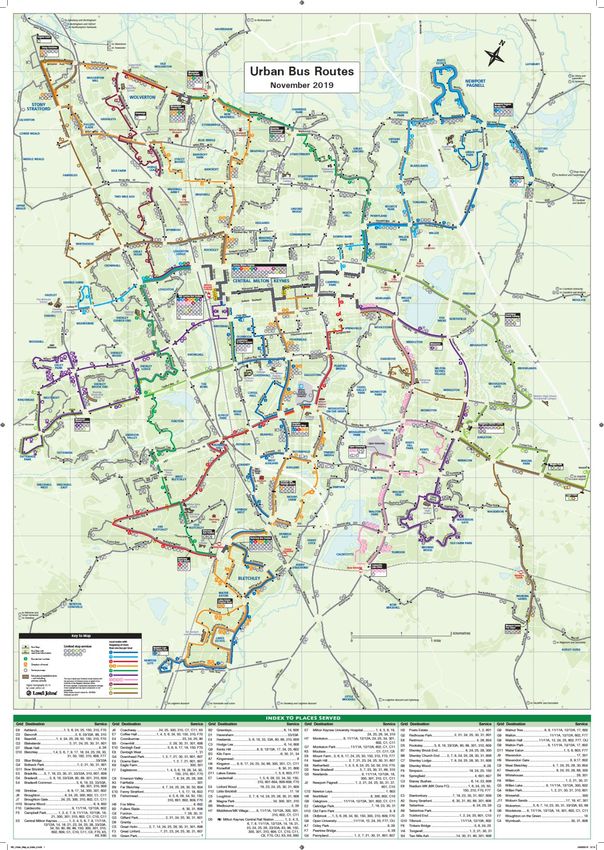
The bus service route map for Milton Keynes is shown in the figure on the following
page. Each Arriva-operated route is evaluated individually in the subsequent pages.
For each route, the analysis is presented as follows:
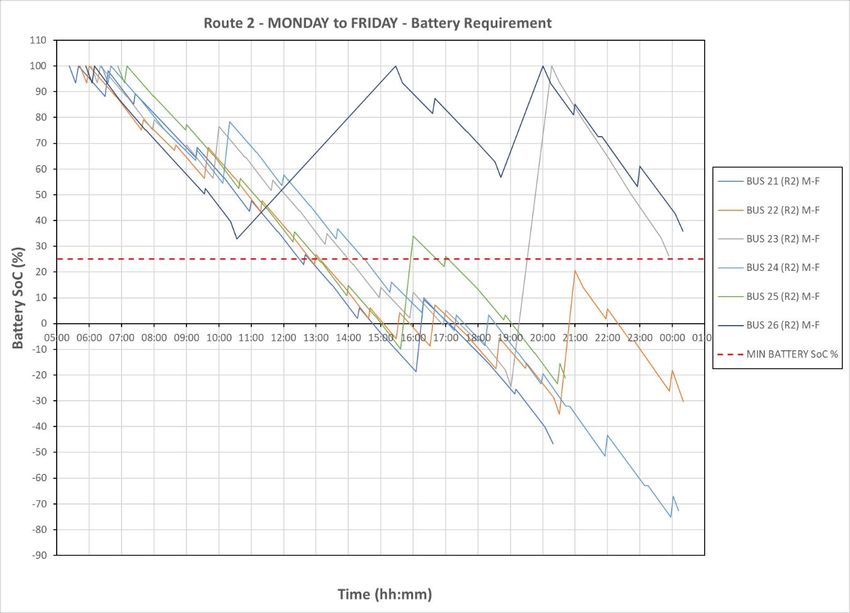
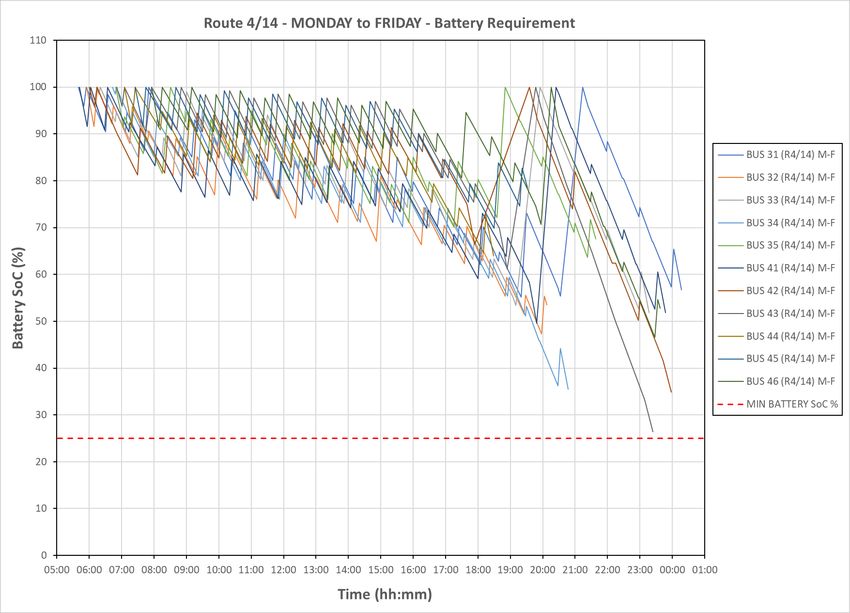
1) First, the battery State-of-Charge (SoC) is presented for each bus on
weekdays, Saturdays, and Sundays. This information has been generated
from the daily bus graphs which were provided by Arriva for each route. The
SoC is presented in graph-form over the period of each working day. (The
graphs have a saw-tooth characteristic because of the assumption that
Opportunity Charging will be used).
2) The key assumptions regarding battery size and charger power on each
route are recorded in the green box which appears immediately after the
SoC graphs. These are:
a. Average bus energy requirement (traction plus heating, measured in
kWh/km)
b. Initial estimate for size of battery (in kWh)
c. Initial estimate for Opportunity Charger power (in kW)
d. Initial estimate of charger efficiency
e. ‘Dwell time loss’ = average reduction in timetabled dwell time for each
bus at each ‘Opportunity Charger’ location over a 24-hour period due
to late arrival or other system deficiency.
3) The calculated battery size requirements are reported in the white box
following the green box. The total route energy requirement is stated for the
bus with the most onerous duty-cycle (excluding heating), and the battery
size required to service this route (with, and without, Opportunity Charging)
is also recorded.Analysis
Bus Energy Requirement (kWh/km) 1
Battery Capacity (kWh) 150
Charger Power (kW) 200
Charger Efficiency (%) 90%
Dwell time loss (min) 1
Routes 1&2
Minimum Battery Size for Minimum Battery Size for Maximum Duty Cycle
Overnight Charging Only Opportunity Charging Distance
(kWh) (kWh) (km/day)
MONDAY-FRIDAY 549.9 350.2 412.4
SATURDAY 502.9 300.8 377.1
SUNDAY 507.5 403.5 380.7
ALL DAYS 549.9 403.5 412.4Analysis
Bus Energy Requirement (kWh/km) 1
Battery Capacity (kWh) 150
Charger Power (kW) 200
Charger Efficiency
(%) 90%
Dwell time loss (min) 1
Routes 4 & 14
Minimum Battery Size Minimum Battery Size Maximum Duty Cycle
for Overnight Charging for Opportunity Charging Distance
Only (kWh) (kWh) (km/day)
MONDAY-FRIDAY 503.3 147.3 377.4
SATURDAY 502.4 153.5 376.8
SUNDAY 488.9 268.8 366.7ALL DAYS 503.3 268.8 377.4
Analysis

Bus Energy Requirement (kWh/km)                   1
Battery Capacity (kWh)                           150
Charger Power (kW)                               200
Charger Efficiency (%)                           90%
Dwell time loss (min)                             1

Routes 5 & 6

                     Minimum Battery Size for Minimum Battery Size for   Maximum Duty Cycle
                     Overnight Charging Only   Opportunity Charging           Distance
                             (kWh)                   (kWh)                    (km/day)

MONDAY-FRIDAY                 558.0                    430.5                   418.5
SATURDAY                      538.0                    214.0                   403.5
SUNDAY                        460.9                    209.4                   345.7

ALL DAYS                      558.0                    430.5                   418.5
Analysis
Bus Energy Requirement (kWh/km) 1
Battery Capacity (kWh) 150
Charger Power (kW) 200
Charger Efficiency
(%) 90%
Dwell time loss (min) 1
Routes 8
Minimum Battery Size Minimum Battery Size Maximum Duty Cycle
for Overnight Charging for Opportunity Charging Distance
Only (kWh) (kWh) (km/day)
MONDAY-FRIDAY 490.2 464.2 367.7
SATURDAY 544.9 460.7 408.6
SUNDAY 562.1 545.3 421.6
ALL DAYS 562.1 545.3 421.6Analysis
Bus Energy Requirement (kWh/km) 1
Battery Capacity (kWh) 150
Charger Power (kW) 200
Charger Efficiency
(%) 90%
Dwell time loss (min) 1
Routes 9
Minimum Battery Size Minimum Battery Size Maximum Duty Cycle
for Overnight Charging for Opportunity Charging Distance
Only (kWh) (kWh) (km/day)
MONDAY-FRIDAY 367.3 141.3 275.5
SATURDAY 262.0 118.0 196.5
SUNDAY 0.0 0.0 0.0
ALL DAYS 367.3 141.3 275.5Analysis
Bus Energy Requirement (kWh/km) 1
Battery Capacity (kWh) 150
Charger Power (kW) 200
Charger Efficiency
(%) 90%
Dwell time loss (min) 1
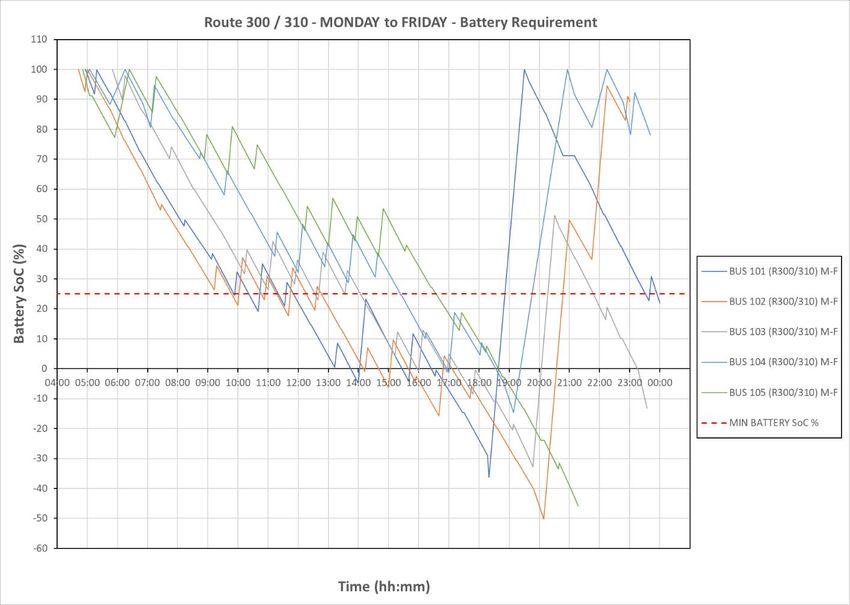
Routes 300 & 310
Minimum Battery Size Minimum Battery Size Maximum Duty Cycle
for Overnight Charging for Opportunity Charging Distance
Only (kWh) (kWh) (km/day)
MONDAY-FRIDAY 640.6 300.6 480.4
SATURDAY 626.7 236.3 470.0
SUNDAY 518.9 292.5 389.2
ALL DAYS 640.6 300.6 480.4X60 Aylesbury (via Buckingham) Route Distance (one way) = 43km Average daily kms (MF) = 344 Max daily kms (MF) = 473 Typical Dwell Time (minutes, each end) = 7,7 Estimated journey energy requirement (@ 1kWh/km) =43kWh Estimated max opportunity charge (200kW; 1 minute lost) = 20kWh Estimated number of daily cycles for 150kWh battery = 5/6 Estimated number of daily cycles for 200kWh battery = 9 X150 Aylesbury via Leighton Buzzard Route Distance (one way) = 30km Average daily kms (MF) = 270km Max daily kms (MF) = 330km Typical Dwell Time (minutes, each end) = 15,10 Estimated journey energy requirement (@ 1kWh/km) = 30kWh Estimated average opportunity charge (200kW; 1 minute lost) = 40kWh Estimated number of daily cycles for 150kWh battery = No limit
You can also read