Climate Change in the Midwest - Projections of Future Temperature and Precipitation - Union of Concerned Scientists
←
→
Page content transcription
If your browser does not render page correctly, please read the page content below
Climate Change in the Midwest
Projections of Future Temperature and Precipitation

Katharine Hayhoe
Dept. of Geosciences, Texas Tech University
ATMOS Research & Consulting, Lubbock, TX

Jeff VanDorn
ATMOS Research & Consulting, San Diego, CA

Vaishali Naik
ATMOS Research & Consulting, Princeton, NJ

Donald Wuebbles
Dept. of Atmospheric Sciences, University of Illinois
Executive Summary

    Climate conditions typicalof the Midwest are already changing in noticeable ways. Average
temperatures have risen, particularly in winter. There have been a number of major heat waves in
recent years, accompanied by a scarcity of cold waves. Ice on lakes and rivers in the region has been
forming later in fall, and melting earlier in spring. The date of the last spring frost has been
progressively advancing earlier and earlier in the year, lengthening the growing season by about a
week over the last century. The frequency of heavy rainfall events has approximately doubled over
that same time, increasing the risk of flooding for states with major rivers including Illinois, Iowa,
and Missouri.
    Recent changes in Midwest climate are consistent with those expected due to increases in
atmosphericgreenhouse gas concentrations.Both global temperatures and temperatures over the
Midwest are expected to warm further over coming decades, as anthropogenic emissions of
greenhouse gases continue. However, the extent of future warming and the impacts that will result
from that warming depend strongly on the magnitude of future emissions. For that reason, in
estimating potential future impacts from climate change, this analysis focuses on two alternative
futures.
    In the IPCC Special Report on Emission Scenario’s A1fi “higher” emission scenario, the world
continues to depend on fossil fuels as the primary energy source, and atmospheric carbon dioxide
levels rise from their present-day levels of 385 parts per million (ppm) to almost 1000 ppm by the
end of the century. Under the B1 “lower” emission scenario, a focus on sustainability and
conservation results in atmospheric carbon dioxide levels of about 550 ppm by the end of the
century. It is important to note, however, that the lower scenario does not represent a lower
boundary on possible futures. It is very probable that timely and aggressive action to reduce
emissions over the next few decades, such as that laid out in the Chicago Climate Action Plan, could
limit climate change to below that projected under the “lower” emissions scenario examined here.
    Given a specific scenario, determining the climate change that would result is still uncertain due
to limitations in scientific understanding of the climate system and how it will respond to
increasing emissions from human activities. In this report, we address scientific uncertainty by
using simulations from three different atmosphere-ocean general circulation models (AOGCMs).
The AOGCMs used here cover the accepted range of how the climate system is likely to respond.
These three models were selected based on several criteria, including their ability to represent the
past climate, particularly over the United States and the Midwest, and the availability of simulations
for the higher and lower emission scenarios used here.
    Beginning with temperature, this analysis shows that the Midwest is likely to experience
substantial increases in annual and seasonal temperatures and extreme heat events, particularly
under the higher emissions scenario. Specifically:
•   Seasonal and annual temperatures are extremely likely to increase over the coming century.
       Over the next few decades, changes on the order of 2.4-2.8oF are likely, depending on the
       state. By the end of the century, under lower emissions, temperature could increase by 5oF;
       under higher emissions, by up to 10oF.
   •   Greater temperature increases are projected for northern Midwest states in winter (likely
       related to feedbacks between reduced snow cover and rising temperatures). For southern
       Midwest states, greater temperature increases are projected for summer (possibly related
       to feedbacks between temperature and soil moisture).
   •   The number of hot days (over 90oF) and extremely hot days (over 100oF) is very likely to
       increase. Looking at 9 urban centers in the Midwest (Chicago, Cincinnati, Cleveland, Detroit,
       Des Moines, Indianapolis, Milwaukee, Minneapolis-St. Paul, and St. Louis), the average
       number of days per year over 90oF are projected to increase 2-3 times by end-of-century
       under lower emissions, and 4-7 times under higher. Proportionally, an even larger increase
       is projected in days over 100oF, with 4-8 times more days by end-of-century under lower
       emissions, and 15-30 more days under higher.
   •   For all 9 urban centers, there is a greater than 50% chance of experiencing at least one heat
       wave with similar characteristics to the Chicago 1995 event (to which almost 700 deaths
       are attributed) before 2040. By the end of the century projected frequency ranges from one
       such event per decade (for Milwaukee, under lower emissions) up to six such heat waves
       each year (for St. Louis, under higher emissions).
   •   The difference between “apparent temperature” (how hot it actually feels due to both
       humidity and temperature) and actual air temperature is likely to increase as the climate
       warms. In other words, hot days could feel even hotter due to increased humidity, creating
       more severe heat stress conditions in the future than suggested by projected increases in air
       temperature alone. Currently, locations in the Midwest experience between 6 and 18 days
       with heat index values greater than 95oF each year. By the end of the century, Great Lake
       states can expect 1.5 to 3 weeks’ worth of such days under lower emissions and up to 6
       weeks’ worth of days under higher emissions. More southern Midwest states can expect 4 to
       6 weeks’ worth under lower emissions and over 12 weeks’ worth each year under higher
       emissions.
     The projected increases in extreme temperatures over the coming century, with more frequent
summer heat waves, could have a number of adverse impacts on human health and welfare.
Extreme temperatures and resulting decreases in air quality can lead to increases in both morbidity
(illnesses) as well as mortality (deaths), although warmer winters would also reduce cold-related
mortality. In particular:
   •   An “analog city” analysis, which transposes the weather conditions from the European Heat
       Wave of 2003 (responsible for 70,000 deaths across Europe), estimates that if a similar heat
       wave were to occur over Chicago, Indianapolis, or Minneapolis, given those cities’ present-
       day infrastructure, demographics, and emergency preparedness, more than ten times the
       annual average number of heat-related deaths in Chicago and Indianapolis and 5 times the
       annual average number of heat-related deaths in Minneapolis would occur in just a few
       weeks.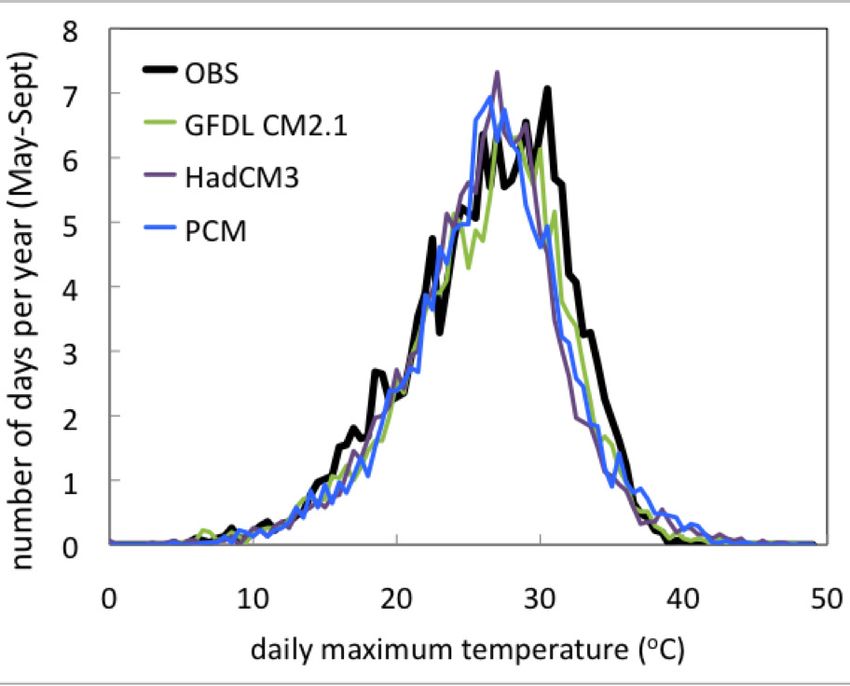
•   Climate projections indicate that anEHW-type eventis likely before 2040, and by the end of
       the century one such event could be occurring as frequently as once a decade, under lower
       emissions, and once every other year, under higher emissions.
   •   The number of days with temperatures below freezing (32oF) are projected to decrease
       significantly; by 3 to 5 weeks under lower emissions and 6 to 8 weeks under higher
       emissions by the end of the century.
    As climate changes, precipitation patterns over the Midwest are also expected to change. These
changes range from shifts in seasonal distributions to changing proportions of rain vs. snow. In
particular:
   •    Although relatively little change in annual average precipitation is expected, relatively large
        seasonal shifts are likely.
    • Winter and spring precipitation is likely to increase, by about 20% by the end of the century
        under lower emissions and 30% under higher.
    • Little change in summer and fall precipitation is expected under lower emissions, but
        summer decreases and fall increases on the order of 10% are expected by the end of the
        century under higher emissions.
    • The frequency of heavy precipitation events—measured in terms of number of days per
        year with more than 2 inches of rain, and annual maximum 24-hr, 5-ady and 7-day rainfall
        totals—is likely to continue to increase, with slightly greater increases for regions closer to
        the Great Lakes.
    • More precipitation will fall as rain and less as snow, particularly in southern Midwest states
        and towards the end of the century, when reductions of 30 to 50% in annual snow days are
        expected under lower emissions, and 45 to 60% under higher. By the end of the century, all
        states can expect no more than an average of 20 snow days per year under lower emissions;
        for Illinois, Indiana, and Missouri, less than 10 snow days per year on average.
    Although some future changes are unavoidable, because of past emissions, the greatest of the
projected changes do not have to happen if prompt action is taken to significantly reduce emissions.
Decisions made by individuals, cities, states, and nations will determine whether we follow a higher
or lower emissions pathway into the future.Through reducing our energy use and preparing for
future change, we can help protect our communities, economy, and ecosystems.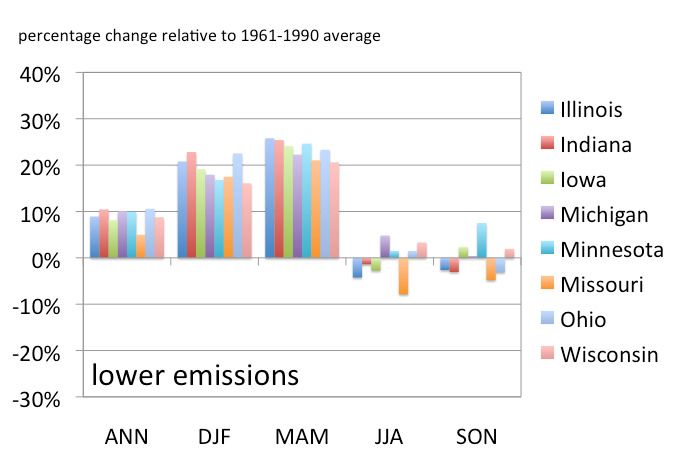
CHAPTER 1
MIDWEST CLIMATE
    Midwest climate conditions are largely determined by the region’s location, in the center of the
North American continent. They are also affected by its relatively flat topography, carved out by the
glaciers that covered the region for thousands of years during the last Ice Age.
    Far from the moderating effects of the oceans, Midwest weather conditions can vary widely
over the course of a year. Sudden changes of weather, large daily temperature ranges, and
unpredictable precipitation patterns are all staples of regional weather.
    The Midwest typically experiences four distinct seasons, although those seasons can be highly
variable and year-to-year variations can be large. In the winter, the absence of significant mountain
barriers to the north allows bitterly cold air masses from the Arctic to move southward into the
region. The polar jet stream is often located near or over the region during the winter, with
frequent storm systems bringing cloudy skies, windy conditions, and precipitation. In contrast,
Midwest summers are characteristically hot and humid due to a semi-permanent high pressure
system in the subtropical Atlantic that draws warm, humid ocean air into the area. Summer also
tends to be the rainiest season, with short-lived rainfall and thunderstorms.

Climate Change in the Midwest
    “Climate” refers to the average conditions in a given location over time scales of decades to
centuries. Year-to-year weather patterns average out to give a picture of what a typical or
“climatological” year might look like. Over longer time scales, however – on the order of centuries
to millennia – climate or “average” conditions in the Midwest have been very different than today.
    Eighteen thousand years ago, for example, when temperatures were an estimated 10 to 15oF
cooler than they are today (Petit et al., 1999), the region was covered by a mile-thick ice sheet. By
10,000 years ago, the climate had warmed and the glaciers retreated, depositing layers of soil and
rock debris that characterize the southern part of the region, and scouring out the many lakes and
rocky shores typical of the more northern states.
    In the past, most large-scale climate variations in the Chicago area and around the world have
been driven by natural causes. These causes include gradual, long-term shifts in the amount of
energy the Earth receives from the Sun, amplified by natural feedbacks within the earth-ocean-
atmosphere system. Climate changes have also been caused by sudden, short-term changes caused
by events such as volcanic eruptions or meteorite collisions.
    Today, however, the story is very different.
    Since the Industrial Revolution, atmospheric concentrations of greenhouse gases such as
carbon dioxide (CO2), methane (CH4) and nitrous oxide (N2O) have been rising because of
increasing emissions from human activities. The primary source of CO2 is the burning of fossil fuels
such as coal, oil, and natural gas. CO2 is also produced by land use changes, including tropical
deforestation. Agricultural activity and waste treatment are important sources of CH4 and N2O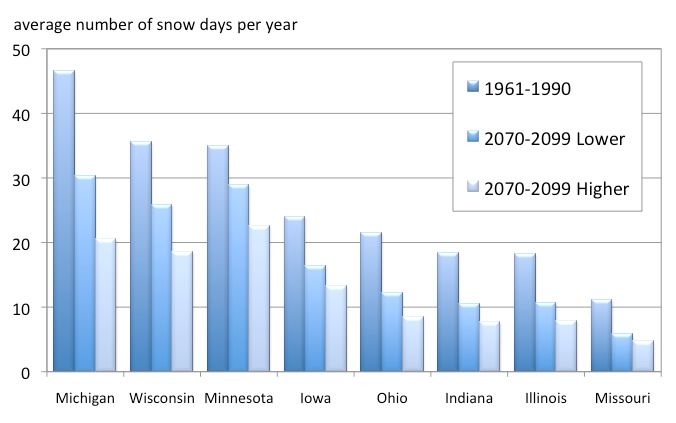
emissions. Atmospheric particles released during fossil fuel combustion, such as soot and sulfates,
also affect climate.
    Atmospheric levels of carbon dioxide are now higher than they have been at any time inat least
the last 800,000 years (Lüthi et al., 2008). Average surface temperatures in the Northern
Hemisphere have risen by 1.3°F over the past 150 years (IPCC, 2007). Based on these and many
other lines of evidence, the Intergovernmental Panel on Climate Change, which represents the work
of thousands of climate scientists around the world, has concluded that it is very likely that most of
the climate changes observed over the last fifty years have been caused by emissions of heat-
trapping or greenhouse gases from human activities (IPCC, 2007).

Indicators of Recent Change
    Although definitive attribution of regional-scale climate change to human causes is still difficult
due to the relatively large year-to-year variability in local climate, changes that are at least
consistent with global, human-induced warming are already under way across the Midwest. Since
1970, the region has been warming at a rate of more than 0.4oF per decade. Winter temperatures
have risen even faster, at a rate of 0.9oF per decade from 1970 to 2000 (Kling et al., 2003). This
warming has been correlated with many noticeable changes (as summarized by Kling et al., 2003;
Hayhoe et al., 2009), including:
    • Increases of 2.6°F in annual average temperatures since 1980, with the greatest increases of
        almost 4oF occurring in winter
    • A scarcity of cold waves during the 1990s, accompanied by several major heat waves,
        particularly those in 1995, 1999, and 2006
    • A progressive advance in the date of last spring freeze, with current dates approximately 1
        week earlier than the beginning of the 1900’s.
    • A lengthening of the growing season, by about one week during the twentieth century
    • An increase in rain days and a doubling in the frequency of heavy rainfall events since the
        early 1900s, increasing the risk of flooding in Iowa, Missouri and Illinois
    • Shifts in the hydrological cycle, with decreasing spring snow cover leading to earlier dates
        for spring melt, peak streamflow, and high lake levels.
    • Later formation of ice on the Great Lakes and inland lakes, and a shorter overall duration of
        winter lake ice, with some years being nearly entirely ice-free
    • An increase in Great Lakes near-shore water temperatures of almost 0.2oF per decade since
        1920(measured at Sault Ste. Marie and Put-In-Bay), accompanied by an increase of more
        than 2 weeks in the duration of summer stratification.
    The recent warmth is comparable in magnitude to the warm periods the Midwest experienced
during the 1930s and 1950s. However, the warm periods in the past were much more regional in
scale and did not display the same large-scale "fingerprint" of recent warming. In contrast, recent
patterns of change are very similar to those seen elsewhere around the globe, strongly suggesting a
connection to human-driven climate change.

Climate Change Over the Coming Century
    The climate of the Midwest - and the rest of the planet - is expected to continue to warm over
the coming century in response to increasing emissions of heat-trapping gases from human
activities. At the global scale, temperature increases anywhere from 2oF up to 13oF are expected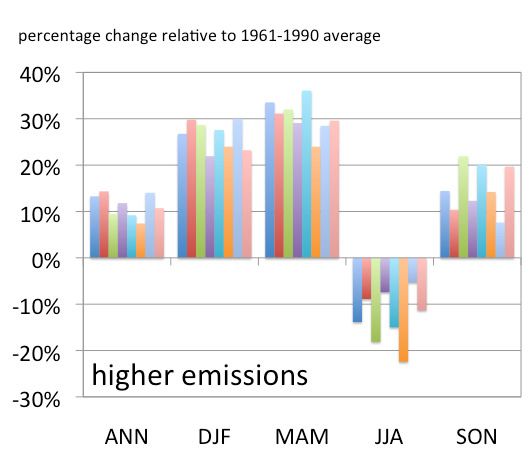
(IPCC, 2007). This range is a function of the uncertainty in predicting future greenhouse gas
emissions and, to a lesser but still important degree, the uncertainty in predicting the response of
the Earth’s climate system to human-induced change.
    Ashuman-induced climate change continues, even more dramatic changes are projected—
changes that have the potential to dramatically alter many aspects of the region’s climate that are
vital to its economy, ecosystems, character, and quality of life. As illustrated in the sections that
follow, however, the extent of this warming and the magnitude of many of the resulting impacts will
be determined by choices that determinefuture emissions of greenhouse gases at both the regional
and the global scale.
    The research results presented here describe the changes that might be expected in the
Midwest over the coming century based on two different emissions scenarios and simulations by
three global climate models. As described in Section 2, model simulations have been downscaled to
the Midwest using two different state-of-the-art statistical methods. Section 3shows how
temperature, precipitation, and related indices are likely to be affected by climate change in the
near future (2010-2039), by mid-century (2040-2069) and towards the end of the century (2070-
2099). Section 4 concludes with a brief summary ofthe impacts of global climate change on
Midwestclimate this century.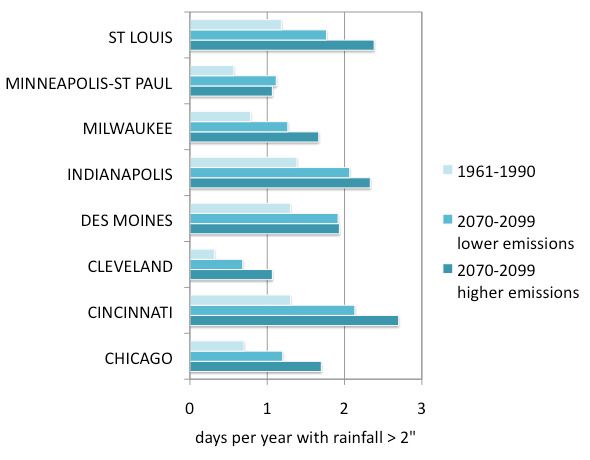
SECTION 2
CLIMATE PROJECTIONS: DATA AND METHODS

To examine future changes in climate, we rely on climate model simulations driven by future
assumptions about population, energy use, and technology. These are known as emission scenarios,
as they quantify emissions of greenhouse gases and other radiatively-active species that would
occur under those assumptions. Emission scenarios are then used as input to multiple global
climate model simulations in order to calculate the changes in temperature, precipitation, and other
aspects of climate likely to result from that set of assumptions. As the spatial resolution of these
global climate models is too coarse to provide valuable information on climate change on scales
smaller than a few hundred kilometers, advanced statistical downscaling methods are applied to
relate projected large-scale changes in climate to local conditions on the ground. Each of these
datasets and methods are described in more detail below.

Historical Simulations
    Historical simulations correspond to the Coupled Model Intercomparison Project’s “20th
Century Climate in Coupled Models” or 20C3M scenarios (Covey et al., 2003). These represent each
modeling group’s best efforts to simulate observed climate over the past century, including changes
in solar radiation, volcanic eruptions, human emissions of greenhouse gases and other radiatively-
active species, and secondary changes in tropospheric ozone and water vapor.
   Although the 20C3M simulations are all intended to represent the same historical total-forcing
scenarios (including both natural variability as well as the effect of human emissions on climate),
simulations by individual modeling groups do not necessarily have identical boundary conditions.
Therefore, some differences between model simulations themselves as well as between simulations
and observations identified here may also be a result of differing input conditions.

Future Emission Scenarios
   Before estimating potential changes in climate during the rest of the century, answers to
questions such as these are needed:
       • How will human societies and economies develop over the coming decades?
       • What technological advances are expected and how will they affect emissions?
       • Which energy sources will be used in the future to generate electricity, power
           transportation, and serve industry?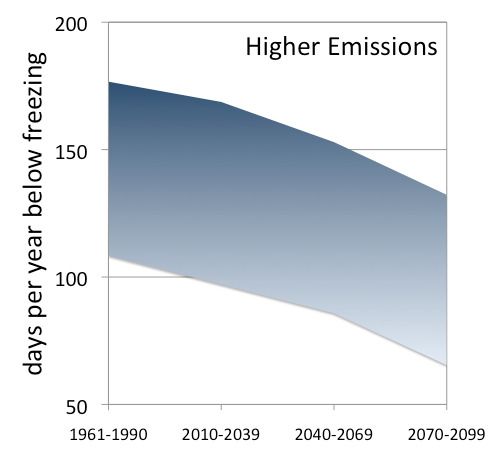
The answers to these questions will affect future
                                                            emissions of greenhouse gases from human
                                                            activities. And these emissions will in turn
                                                            determine future climate change at both the global
                                                            level and in the Midwest.
                                                                To      address     these    questions,      the
                                                            Intergovernmental Panel on Climate Change
                                                            (IPCC) has developed a set of future emissions
                                                            scenarios known as SRES (Special Report on
                                                            Emissions Scenarios, Nakicenovic et al., 2000).
                                                            These scenarios use a wide range of projections
                                                            for future population, demographics, technology,
                                                            and energy use to estimate the greenhouse gas
 Figure 1. Projected future carbon emissions for the SRES   emissions that would result from a variety of
 emission scenarios. Emissions for the higher scenario      possible futures. In doing so, they cover a wide
 (A1fi) corresponds to the red dotted line, while           range of plausible futures that illustrate
 emissions for the lower (B1) scenario are indicated by
 the solid green line.
                                                            differences in the extent and severity of the global
                                                            warming that result from alternative emissions
choices (Figure 1).
     As diverse as they are, the SRES scenarios still do not cover the entire range of possible futures.
At the high end, CO2 emissions today are already on a pathway set to end up higher than any of
these scenarios (Raupach et al., 2007). On the low end, reductions in emissions—on the order of
80% by 2050, as proposed by a number of studies—could reduce CO2 levels below the lowest SRES
emission scenario. Nonetheless, the substantial difference between the SRES higher- and lower-
emissions scenarios used here is sufficient toillustrate the potential range of changes that could be
expected, and how these depend on future emissions.
     This assessment compares projected climate changes under the SRES A1fi (fossil-intensive) and
the B1 scenarios. The higher-emissions scenario (A1fi) represents a world with fossil fuel-intensive
economic growth and a global population that peaks mid-century and then declines. New and more
efficient technologies are introduced toward the end of the century. In this scenario, atmospheric
carbon dioxide concentrations reach 940 parts per million (ppm) by 2100—more than triple pre-
industrial levels.
     The lower-emissions scenario (B1) also represents a world with high economic growth and a
global population that peaks mid-century and then declines. However, this scenario includes a shift
to less fossil fuel-intensive industries and the introduction of clean and resource-efficient
technologies. Emissions of greenhouse gases peak around mid-century and then decline.
Atmospheric carbon dioxide concentrations reach 550 ppm by 2100—about double pre-industrial
levels.

Global Climate Models
    Emissions scenarios are used as input to global climate models, also known as atmosphere-
ocean general circulation models (AOGCMs). These are large, three-dimensional coupled models
that incorporate the latest understanding of the physical processes at work in the atmosphere,
oceans, and Earth’s surface. As output, AOGCMs produce geographic grid-based projections of
precipitation, temperature, pressure, cloud cover, humidity, and a host of other climate variables at
daily, monthly, and annual scales.
Because of the complexity of these models, they
are generally designed and run by large research
teams at supercomputing centers. Models are
constantly being enhanced as scientific
understanding of climate improves and as
computational power increases. Over time, the
number of global climate models has grown. By 2008,
16 international climate modeling teams had
submitted historical and future simulations from 25
different climate models to the Intergovernmental
Panel on Climate Change’s Fourth Assessment
Report.
Some models are more successful than others at
reproducing observed climate and trends over the
Figure 2. Projected future global temperature past century. However, all future simulations agreed
change for the SRES emission scenarios (degreesC). that both global and regional temperatures will
The range for each individual emission scenario increase over the coming century in response to
indicates model uncertainty in simulating the
increasing emissions of greenhouse gases from
response of the Earth system to human emissions
of greenhouse gases. human activities (Figure 2).
In this study, we rely on simulations from three
of these global climate models (see Table 1 below): the U.S. National Atmospheric and Oceanic
Administration’s Geophysical Fluid Dynamics Laboratory (GFDL) CM2.1 (Delworth et al., 2006), the
United Kingdom Meteorological Office’s Hadley Centre Climate Model, version 3 (HadCM3, Pope et
al., 2000), and the National Center for Atmospheric Research’s Parallel Climate Model (PCM,
Washington et al., 2000). These models were chosen based on several criteria, as follows.
First, only well-established models were considered, those already extensively described and
evaluated in the peer-reviewed scientific literature. The models must have participated the Coupled
Model Intercomparison Project or otherwise been evaluated and shown to adequately reproduce
key features of the atmosphere and ocean system. Key features include seasonal circulation
patterns, atmosphere-ocean heat fluxes, El Niño, and other teleconnection patterns affecting
climate in the region (Covey et al., 2003; AchutaRao & Sperber, 2006; Chapman & Walsh, 2007;
Stoner et al., 2009;Vrac et al., 2006).
Second, the models chosen mustencompass the greater part of the range of uncertainty in
climate sensitivity. Climate sensitivity isdefined as the equilibrium temperature change that would
result from a doubling of atmospheric carbon dioxide concentrations relative to pre-industrial
times.Climate sensitivity determines the extent to which temperatures will rise under a given
increase in atmospheric concentrations of greenhouse gases.
Because many of the processes at work in the earth-atmosphere system are not yet fully
understood, these are represented somewhat differently in different AOGCMs. For this reason,
GFDL and HadCM3 have medium to medium-high climate sensitivities, while PCM has a relatively
low climate sensitivity (Tebaldi et al., 2006).Together, these three models span more than two-
thirds of the IPCC’s range of estimated climate sensitivity (IPCC, 2007). The ranges in projected
temperature change and other climate variables presented in this report arise from the different
climate sensitivity of these models.
Lastly, simulations of temperature, precipitation, and other key variables must be available at
daily resolution for both the SRES A1fi and B1 emission scenarios. While all AOGCMs have producedsimulations for the mid-high A2 and lower B1 emissions scenarios, few have done so for A1fi.
Emissions in 2007, however, were already above the highest of the SRES projections for that year. If
present-day growth rates continue,emission will far exceed even the A1fi emissions scenario by the
end of the century. For this reason it is essential to use the highest emission scenario available in
order to avoid massively under-estimating the implications of a “business as usual” scenario for
future climate.Furthermore, many AOGCMs fail to archive the daily outputs of key variables
required for climate analysis and downscaling to the regional scale.
The AOGCMs selected for this analysis are three of the four for which daily output from A1fi and
B1 simulations are available. The fourth A1fi simulation, by the NCAR CCSM3 model, was completed
too late for inclusion in this analysis but will be incorporated into future work.
Horizonal Spatial
Model Host Institution Reference
Resolution
National Ocean and Atmospheric
GFDL CM2.1 Administration, Geophysical Fluid 1.8 degrees Delworth et al., 2006
Dynamics Laboratory (USA)
U.K. Meteorological Office, Hadley
HadCM3 2.5 x 3.75 degrees Pope et al., 2000
Centre (U.K.)
National Center for Atmospheric
PCM 2.8 degrees Washington et al., 2000
Research (USA)
Table 1. Description of the three global climate models used in this analysis.
Statistical Downscaling of Global Model Simulations
The geographic grid cells that form the basis of AOGCMs typically range in size from 100 to 500
miles per side. In general, this type of resolution is too coarse to capture the fine-scale changes
experienced at the regional scale. For this reason, two robust, well-documented statistical
downscaling techniques are used here to transform global climate model output into higher-
resolution projections capable of resolving the impacts of climate change on local conditions.
Statistical downscaling relies on historical instrumental data for calibration at the local scale. A
statistical relationship is first established between AOGCM output for a past “training period,” and
observed climate variables of interest (here, daily maximum and minimum temperature and
precipitation). This relationship is averaged over at least two decades, to remove year-to-year
fluctuations. The historical relationship between AOGCM output and monthly or daily climate
variables at the regional scale is thentested using a second historical “evaluation period” to ensure
the relationship is valid. If so, then the relationship is finally used to downscale future AOGCM
simulations to that same scale.
Unlike regional climate modeling, statistical downscaling assumes that the relationships
between large- and small-scale processes remain fixed over time. This assumption may not always
be justified, particularly for precipitation. However, analysis of 37 stations in the state of Illinois
suggests that this relationship only breaks down for the most extreme precipitation events above
the 99th percentile of the distribution (Vrac et al., 2007). Analyses for the Northeast (Hayhoe et al.,
2008) further indicate that, in areas of variable topography such as mountains and coastlines,
statistical methods trained to match historical spatial patterns may perform better than regionalclimate models that are limited by their convection schemes. In addition, statistical downscaling has
a substantial time and cost advantage; hundreds of years of model simulations can be downscaled
using the same computing resources required to run only a few years of regional-model
downscaling.
For these reasons, two statistical methods were used here to downscale AOGCM-based
temperature and precipitation fields corresponding to the A1fi and B1 emissions scenarios. In the
first method, monthly AOGCM temperature and precipitation fields were statistically downscaled to
daily values across the entire Midwest region with a resolution of 1/8 degrees. This downscaling
approach uses an empirical statistical technique that maps the probability density functions for
modeled monthly and daily precipitation and temperature for the climatological period (1961–
1990; Maurer et al., 2002) onto those of gridded historical observed data, so the mean and
variability of both monthly and daily observations are reproduced by the climate model outputs.
The bias correction and spatial disaggregation technique is one originally developed for adjusting
AOGCM output for long-range streamflow forecasting (Wood et al., 2002; Van Rheenan et al., 2004),
later adapted for use in studies examining the hydrologic impacts of climate change. The method
compares favorably to regional climate model simulations (Wood et al., 2004).
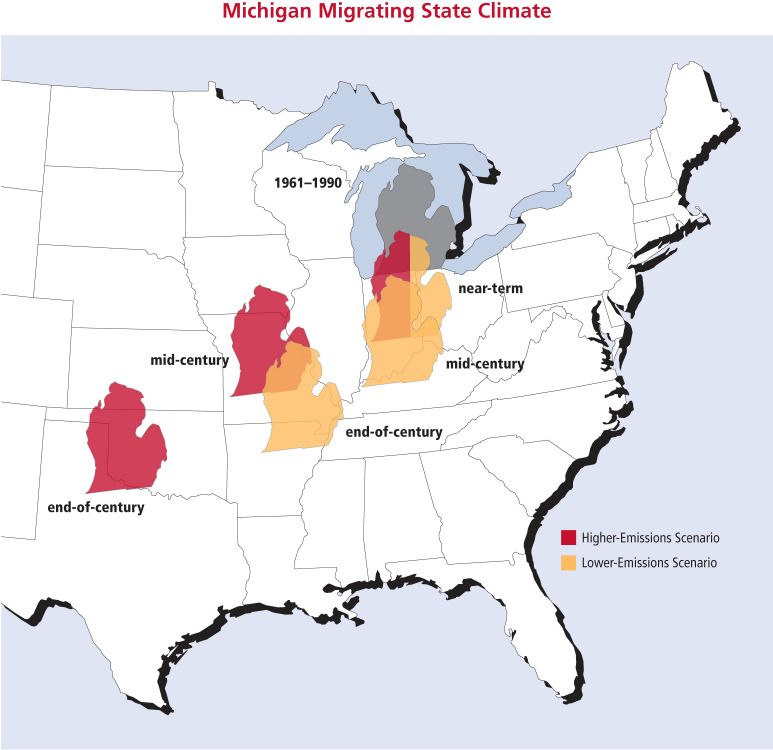
The second method uses an asynchronous regression approach to rescale daily AOGCM
temperature values by individual quantile. AOGCM-simulated time series are first modified so
overall probability distributions of simulated daily values approximate observed probability
distributions of air temperatures at weather stations in each city (as shown for the Chicago Midway
station in Figure 3(a), after Dettinger et al. 2004). The regression relations derived from the
historic observed and model-simulated time series are then applied to future simulations, such that
rescaled values share the weather statistics observed at the selected stations (Figure 3(b)).
Figure 3.(a) Observed (black) and historical simulated distribution of daily maximum summer temperatures by three
AOGCMs for the Chicago Midway station for evaluation period 1980-1999. (b) Observed historical (black) and future
projected daily maximum summer temperature under the SRES higher (red) and lower (orange) emission scenarios.
Values shown are the average of the three AOGCM simulations.SECTION 3
PROJECTED CHANGES INMIDWEST CLIMATE
The Midwest is already experiencing changes consistent with human-induced warming at the
global scale. Annual average temperatures are rising, accompanied by a reduction in snow and ice
cover, a longer growing season, and increased frequency of extreme rainfall events. All of these
changes are expected to continue in the future, with the amount of change depending on future
greenhouse gas emissions as well as on the sensitivity of the Earth’s climate system to human
emissions.
Seasonal and Annual Temperature
Climate change will increase temperatures throughout the region. Temperature changes will be
greater under a higher emission scenario as compared to a lower, and by end-of-century as
compared to earlier time periods.
Over the near term (2010-2039), annual temperature increases of 2.4 to 2.8oF are expected. The
higher end of this range represents the relatively greater increases for the more southerly states of
Illinois, Indiana, Iowa and Missouri, and the lower end represents slightly smaller increases
projected for the more northerly states of Minnesota and Wisconsin. There is no significant
difference between higher vs. lower emissions over this time period.
By the middle of the century, temperatures are projected to rise from 3.8 to 3.9oF under lower
emissions and 6.0 to 6.5oF under higher emissions. By the end of the century, temperatures are
projected to rise 4.9 to 5.1oF under lower emissions and 9.7 to 10.3oF under higher emissions.
Again, temperature increases are larger for southerly states and smaller for northern states.
There are also strong seasonal differences in the projected temperature increases. In particular,
much greater increases are expected in summer as compared to winter and spring. By the end of
the century, for example, summer temperature increases range from 12.5 to 14oF under higher
emissions, while winter temperature increases range from 7.6 to 10.2oF (Table 2) and spring
temperature increases are only 7.2 to 8.6oF.
ANNUAL WINTER (DJF) SUMMER (JJA)
Lower Higher Lower Higher Lower Higher
emissions emissions emissions emissions emissions emissions
2010–2039 2.6 2.6 3.1 3.1 3.3 3.3
2040–2069 3.9 6.2 4.0 5.5 4.8 8.6
2070–2099 5.0 10.0 5.3 8.9 5.7 13.3
Table 2.Projected increases in annual, winter, and summer temperatures projected for the Midwest.
Values shown are the average of three AOGCMs for the SRES higher (A1fi) and lower (B1) emissions
scenario.
Temperature increases for spring, summer and fall are strongest for more southern states. The
opposite pattern is seen in winter, where temperature increases are greatest for northern states
such as Wisconsin and Minnesota. This may be due to the feedbacks between melting snow andtemperature increase. A similar effect has already been observed in the U.S. Northeast, where
winter temperatures are rising at twice the rate of the annual average.
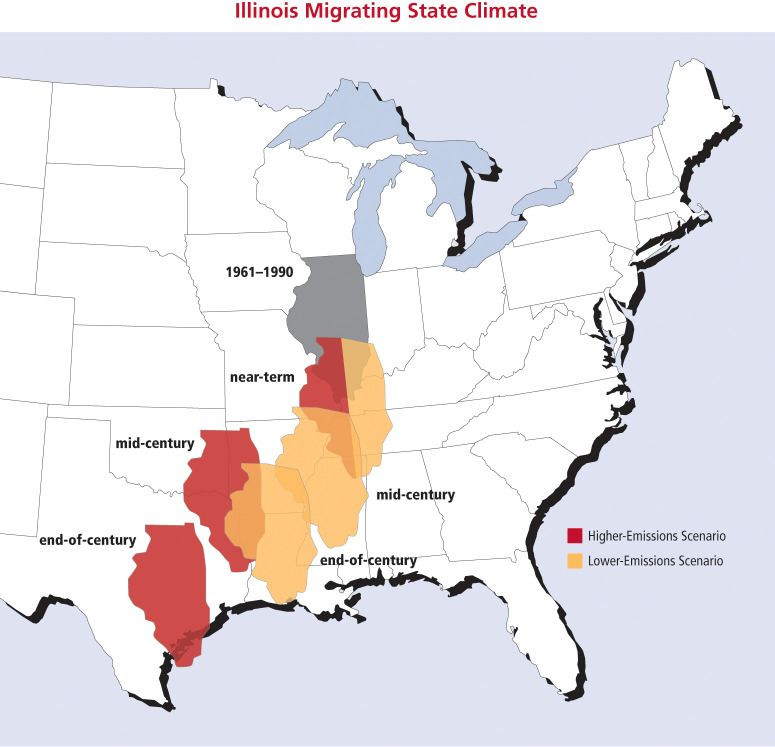
“Migrating” States
A tangible measure of how climate change may affect Midwestern states is provided by a
“migrating state” analysis. First used in an assessment of climate change impacts on the Great Lakes
(Kling et al., 2003), the migrating state analysis consists of quantifying projected future climate
conditions in a given state, then searching for present-day analogues to those conditions in other
states today.
Here, average summer temperature and rainfall are used to characterize Midwest summer
climate conditions. For the Midwest states of Michigan and Illinois, projected changes in average
summer temperature and rainfall are expected to make the states feel as if they are shifting south
and westward over time (Figure 4). Within a decade or two, summer in central Illinois is likely to
feel more like southern Illinois does today, while Michigan summers may feel more like those of
Indiana do today.
Over the rest of the century, both Illinois and Michigan summers are expected to become
progressively hotter and drier, particularly under higher emissions. By the end of the century,
Illinois summers may feel like East Texas does today under higher emissions, and like Arkansas
under lower. Michigan may feel like western Oklahoma does under higher emissions, and like
Missouri under lower.
Figure 4.Projected changes in summer average temperature and rainfall for Illinois and Michigan (shown here)
indicate that summers in these states will feel progressively more like summers currently experienced by states to
their southwest under both higher (red) and lower (yellow) future emissions scenarios. Both states are projected to
warm considerably, and have less summer rainfall.
Care must be taken when interpreting these results, as local climate is also sensitive to regional
topography and other characteristics. Although summer temperature and precipitation may feel
like that of East Texas or Oklahoma, that does not mean that all other characteristics of those states
will automatically transfer. Michigan will still experience the moderating effect of the Great Lakes
on its climate, while Illinois will still own the rich soils that make it part of the nation’s bread
basket. Ecosystems typical of these regions, while sensitive to climate changes, can take decades to
centuries to adjust to climate change. Hence, it is important to acknowledge that this analysis isillustrative of climate conditions only, not of other aspects of the physical environment that
characterize those states.
Extreme Heatand Heatwaves
Climate extremes are also projected to change, with both individual hot days and prolonged
periods of extreme heat, or heat waves, becoming more frequent and severe. Here, three measures
are used to quantify projected increases in extreme heat: (1) average number of days per year with
maximum daily temperature over 90oF and 100oF for 9 urban centers (Table 3); (2) frequency of
severe heat wave events in those same 9 urban areas, with severe heat waves defined as having
meteorological characteristics matching those of the 1995 Chicago heat wave; and (3) average
number of days per year with daily maximum heat index over 95oF and 100oF for 8 Midwestern
states.
Urban Heat Days. Most days with temperatures in the 90s or soaring over 100oF would be
considered hot by Midwest residents. Here, thresholds of maximum daily temperatures at or above
90oF and 100oF are used to define “hot days” and “extremely hot days” for 9 urban centers: Chicago,
Cincinnati, Cleveland, Detroit, Des Moines, Indianapolis, Milwaukee, Minneapolis-St. Paul, and St.
Louis. Currently, these cities experience an average of 7 (Milwaukee) up to 36 (St. Louis) days over
90oF each year, while number of days over 100oF range from one every two years up to an average
of two per year (Figure 5).
The frequency of both types of days are projected to increase in the future, with proportionally
larger increases under higher as compared to lower emission scenarios, by end-of-century as
compared to earlier in the century, and for days over 100oF as compared to days over 90oF. By
2070-2099, the number of days over 100oF is projected to increase by a factor of 4 to 8 times
relative to 1961-1990 values under lower emissions, and 15 to 30 times under higher emissions
(Figure 5a). For days over 90oF,
increases of 2 to 3 times 1961-1990
values are expected under lower
emissions and 4 to 7 times under
higher (Figure 5b).
Severe Heat Waves.In July of 1995,
the city of Chicago experienced a heat
wave unprecedented in its 123-year-
old weather records (Livezey &
Tinker, 1996). Maximum daily
temperatures were equal to or
greater than 90oF for seven
consecutive days, and greater than
100oF for two days at the peak of the
heat wave. Even more importantly,
there was no relief at night, as
Figure 5.Historical simulated and projected future number of days over nighttime minimum temperatures
o o
90 F and 100 F for 9 Midwest urban centers under lower and higher
were over 80oF during the hottest
emissions for 2070-2099. Value shown are the average of 3 AOGCMs.
days. The heat wave is estimated to
have been responsible for at least 700 heat-related deaths (Kaiser et al., 2007).Using these meteorological criteria, it is possible to calculate the frequency of Chicago 1995-like
heat waves for key Midwest urban centers (Table 3). When this is done it is clear that, even for
Chicago, such an event is relatively unusual. The probability of having such an event during the
historical reference period 1961-1990 range from essentially zero (for Milwaukee and Cleveland)
up to 100% (for St. Louis). Within just a few decades however, it is more likely than not that every
city except for Milwaukee and Cleveland will experience at least one such event each decade. By
mid-century, there may be on average anywhere from 1 to 10 such events under lower emissions
and anywhere from 3 to 30 such events each decade under higher emissions, depending on the
city—in other words, from one heat wave every three years to three heat wave events per year. By
the end of the century, only slightly greater numbers of heat waves are expected as compared to
mid-century under lower emissions; under higher emissions, however, projected heat wave event
frequencies range from at least one each decade (for Milwaukee) up to 6such events per year (in St.
Louis).
City 1961-1990 2010-2039 2040-2069 2070-2099
Lower Higher Lower Higher
CHICAGO 0.11 1.33 2.56 11.78 4.22 27.44
CINCINNATI 0.11 0.61 0.67 7.78 1.44 21.44
CLEVELAND 0.00 0.17 0.11 2.78 0.33 11.11
DES MOINES 0.56 2.22 3.11 15.11 4.33 34.44
DETROIT 0.11 0.83 1.00 7.00 1.44 19.33
INDIANAPOLIS 0.22 0.61 1.00 9.78 2.11 24.56
MILWAUKEE 0.00 0.22 0.67 4.44 0.78 12.67
MINNEAPOLIS 0.11 0.50 0.89 7.33 1.89 19.67
ST LOUIS 1.33 6.44 10.11 29.56 11.11 59.89
Table 3.Simulated frequency of Chicago 1995-like heat waves; in units of number of events per decade
for the time period indicated. Values shown are the average of 3 AOGCMs for higher and lower emission
scenarios.
Heat Index.The heat index combines temperature and humidity to calculate how hot it actually
feels. Changes in extreme heat can be quantified through examining projected changes in extreme
heat days, with heat index values greater than 95oF and 100oF.
Currently, the southern Midwest states experience between 6 (Indiana and Iowa) and 18
(Missouri) days per year with a heat index over 95oF. Northern states and states that border the
Great Lakes such as Michigan and Ohio experience less than 3 days per year (Figure 6a). In the
near-term (2010-2039), these numbers are projected to increase by about 3-5 additional days for
Great Lake states and10-24additional days for the southern Midwest states. By mid-century, under
lower emissions the number of days per year is likely to increase by 6 (Michigan) up to 33
(Missouri) additional days as compared to 1961-1990. Under higher emissions, anywhere from 19
(MI) to 59 (MO) additional days per year are expected. These numbers increase further by end of
century. Under lower emissions, Great Lakes states can expect from 10-22 more such days per year
while southern Midwest states could see 26 to 41 such days. Under higher emissions, a total of44
(MI) and 85 (MO) days per year with heat index values over 95oF are expected.Days with a heat index value greater than 100oF are currently very rare. Great Lake states
currently experience only one such day every other (Ohio) to every ten (Michigan, Wisconsin)
years. The southern Midwest states experience anywhere from one (Indiana, Iowa) to 5 (Missouri)
such days each year.
Within the next few decades, every state will begin to experience at least one day per year with
a heat index greater than 100oF (Figure 6b). Some states, such as Illinois and Missouri, could see
over 10 such days each year. By mid-century northern states will see on average 3 days per over
100oF under lower emissions and 13 under higher. Southern states see an average of more than
two weeks’ worth of days over 100oF each year under lower emissions and almost 40 days under
higher. By the end of the century, under lower emissions northern states could experience about 5
days per year, while southern states have about three weeks of such days each year. Under higher
emissions, northern states would see about 30 days over 100oF each year, while southern states
would experience more than double, 63 days per year.
Although projected increases in extreme heat under the lower-emissions scenario are less than
those projected under the higher-emissions scenario, it is important to recognize that the number
of extreme heat days areprojected to be much greater than todayunder either scenario.
o
Figure 6.Projected changes in average number of days per year with heat index values greater than (a) 95 F and (b)
o
100 F. Relatively smaller changes are projected for Great Lake states (Michigan, Minnesota, Ohio and Wisconsin)
while greater changes are expected for southern Midwest states (Illinois, Indiana, Iowa, and Missouri).Impacts of a 2003 European Heat Wave Event on Chicago, Indianapolis, & Minneapolis
Extreme heat and oppressive heat events are known to produce elevated rates of both illness
and death due to heat stress (Schär et al., 2004). In addition to their direct impacts, sustained
extreme heat events exacerbate pre-existing cardiovascular, respiratory, and other conditions
(Kalkstein & Valimont, 1987).
A direct effect of rising temperatures is an increase in the frequency and severity of extreme
heat and heat wave events. As climate changes, very hot days and heat wave events are projected to
become more frequent and severe (Tebaldi et al., 2006). At the same time the risk of severe,
prolonged heat wave events, such as occurred over Chicago in 1995 and Europe in 2003, is also
increasing (Meehl & Tebaldi, 2004).
Excessive heat is currently the leading cause of weather-related deaths across the U.S. Though
some research has suggested an overall decrease in heat vulnerability in recent decades (Davis et
al., 2002), there is still a clear vulnerability to heat, and dramatic mortality episodes have occurred
in the U.S. within the last ten years (Klinenberg, 2002). One recent study indicates that, following a
decline from the 1970s to the early 1990s, heat vulnerability has remained relatively constant since
and may even be increasing in some cities (Sheridan et al., 2008).
During the summer of 2003, western Europe was impacted by a heat wave of historic
proportions (Trigo et al., 2005). The most extreme conditions centered in France where from June 1
through August 31, 2003, maximum temperatures were above average for all but eight days in Paris
and, for at least half of those days, average maximum temperatures were exceeded by 10°F or more.
Minimum daily temperatures were also abnormally high.
Analysis of the 2003 European Heat Wave (EHW) indicates that its duration and magnitude is
beyond that of any similar event that has occurred in the United States or Europe over the last 150
years. Initial estimates of its death toll centered around 30,000 (UNEP, 2004). More recently, a total
of 70,000 excess deaths in 16 European countries have been identified during the summer of 2003
(Robine et al., 2008). Much can be learned regarding the potential impact of climate change on
extreme heat and heat-related health concerns for Midwestern cities by examining the
meteorological conditions leading to these events, and their impact on urban mortality and
morbidity rates.
A heat wave comparable to the EHW in duration and intensity has yet to occur over North
America. At the same time, there is a well-documented pattern of increased mortality in U.S. cities
as a result of extreme heat waves (e.g., St. Louis, 1966, 1980, 2006; New York, 1975, 1984, 2006;
Philadelphia, 1991, 1993; Chicago, 1995, 1999). Given projected future changes in summer
temperatures, it is likely only a matter of time until such an event occurs. For that reason, we first
calculate the impact an EHW-like event would have on heat-related mortality if it were to occur
over Chicago, Minneapolis, or Indianapolis.
Following the methodology described by Hayhoe et al. (2009), an “analog city” approach
developed by Kalkstein et al. (2008) is used to superimpose the meteorological conditions in Paris
during the EHW event on these three Midwestern cities. All other conditions in the cities remain the
same as observed today in those locations, including their demographics, vulnerability, and
infrastructure. No AOGCM projections are required for this analysis; rather, it simply assesses the
potential impact of a single event on Chicago, Indianapolis, or Minneapolis, regardless of when it
might be projected to occur.
Minneapolis Indianapolis ChicagoMetro Population (2000 census) 382,618 781,870 2,836,658
Summer heat-related mortality
Average summer 30 25 94
Hottest historical summer 120 (1988) 98 (1988) 556 (1995)
EHW analog summer 141 282 1073
Summer heart-related mortality per 100,000 population
Average summer 10.6 3.2 3.3
Hottest historical summer 31.6 (1988) 12.5 (1988) 19.6 (1995)
EHW analog summer 36.8 36.1 37.8
Analog percent deaths above hottest historical summer 18% 188% 193%
Table 4.Historical observed heat-related mortality for Chicago, Indianapolis, and Minneapolis and
comparison with estimated heat-related mortality impacts of a 2003 European Heat Wave-like event.
Historical observed heat-mortality relationships for Chicago, Indianapolis, and Minnesota
indicate that these cities experienced their hottest summers in 1995 and 1998, respectively. In
those years, summer mortality rates ranged from 13 to 32 per 100,000 people, as compared to the
average of 3 to 11 per 100,000 (Table 4). Superimposing the meteorological conditions of the EWH
on these cities, however, gives mortality rates of 36 to 38 per 100,000 people—far exceeding that of
even the hottest summer previously on record. To put this into further perspective: during an
average summer in Chicago, about 94 people die from the heat. These numbers are smaller for
Indianapolis and Minnesota; 25 and 30, respectively. Using 2000 census values for urban (not
metro area) populations, if an EHW-like event occurred today, it would incurr 1,073, 282, and 141
deaths in the urban center of Chicago, Indianapolis, and Minnesota, respectively (Table 4). Clearly, a
heat wave of this magnitude would tax the health care system even more than past events.
Projected Frequency of Future EHW-Like Events
The previous analysis only evaluates the likely impacts of an EHW-like event. However, the
mortality characteristics of an EHW-like event (for Chicago, for which year-by-year mortality
estimates were previously developed; Hayhoe et al., 2009b) and the meteorological characteristics
of the EHW (for Indianapolis and Minneapolis, for which year-by-year mortality estimates are not
available) can be used to estimate the likely timing of such an event, and the frequency of an EHW-
type event by mid- and end-of-century under higher and lower emission scenarios.
In terms of mortality characteristics, an EHW-like event is defined as at least 13.4 deaths per
100,000 (in comparison, the 1995 Chicago heat wave had a mortality rate of 11.5 per 100,000). In
terms of meteorological conditions, such a heat wave is defined as occurring during a period of at
least 45 consecutive days where daytime maximum and nighttime minimum temperatures are
above average for at least 43 of those days. A heat wave occurs when at least 10 days exceed
daytime maximum temperature records are exceeded on at least 10 of those days, and minimum
temperature records on at least 11 of the nights.Using the definition of an “EHW-like” event, the
likely frequency of such an event occurring in future
decades can be calculated (Figure 7). Averaging the
results from the three different climate models used
here, historical simulations suggest no such event has
yet occurred – which is, in fact, the case. Over the near
term (2010-2039), however, simulations for both
Chicago and Indianapolis indicate a 100% likelihood of
at least one such event, while the probability is slightly
smaller, at 70%, for Minneapolis-St. Paul.
By mid-century (2040-2069), there are projected to
be another 2 such heat waves under the lower
emissions scenario but anywhere from 6 to 8 under the
higher emissions scenario. By the end of the century,
under lower emissions EHW-like heat waves can be
expected on average once a decade and approximately
every other year under higher emissions.
The fact that an EHW-like summer is projected to
occur within several decades under either the higher or
the lower emissions scenario has important
implications for adaptation, suggesting that even with
stringent mitigation strategies, adaptative measures
should be put in place to deal with such a situation.
Days Below Freezing (states of Missouri, Ohio, Illinois and Indiana, this means there are less than two and a half month’s
worth of days with minimum (nighttime) temperatures below freezing on average, each year.
Figure 8.Projected changes in average number of days per year below freezing. Range shown covers the 8 Midwest
states, with the upper end of the range showing days below freezing for Minnesota and Wisconsin, the mid part of
the range indicative of Iowa, Michigan, and Ohio, and the lower end showing Missouri, Illinois, and Indiana.
Annual and Seasonal Precipitation
Climate change is expected to bring the Midwest no more than slight increases in annual
average precipitation. Projected changes are on the order of 2-5% over the near term, 0-6% by mid-
century, and 5-14% by end-of-century, depending on the state and the climate model used. These
relatively small changes in average precipitation, however, mask much larger shifts at the sub-
annual scale.As shown in Figure 9, climate change is expected to significantly alter the distribution
of seasonal precipitation.
Figure 9.Projected changes in end-of-century average annual and seasonal precipitation, by state. Values shown are
the average of simulations by three AOGCMs under higher and lower emissions for 2070-2099 relative to 1961-1990.
Relatively large increases in winter and spring precipitation are projected to occur for all states,
with larger changes under higher emissions as compared to lower (~+30% vs. ~+20%), and by
end-of-century as compared to closer time periods. Precipitation increases tend to be smaller forMissouri than for other states, but larger for the Midwestern states that lie south of the Great Lakes:
Illinois, Indiana, and Ohio.
In contrast, summer and fall precipitation is expected to show little change under lower
emissions. Under higher emissions, summer precipitation decreases by 5% to 22%, depending on
location, while fall precipitation increases by a similar amount, 8% to 22%.
Snow vs. Rain
This shift in precipitation from summer to winter and spring also has implications for the
number of rain and snow days. Overall, no significant change is expected in the average number of
precipitation days each year. However, warming temperatures means that precipitation on more of
those days will fall as rain, and less will fall as snow.
As winter temperatures have warmed across the region, more precipitation has been falling as rain
and less as snow. Since 1980, almost 3 out of 4 winters have seen below-average snowfall.
Over the next few decades,
little change is expected in the
number of snow days for more
northern states, although more
southern states could lose
between 2 and 4 snow days
each year. By end of century,
though, across the region the
average number of snow days
per year is expected to
decrease. Decreases on the
order of 30 to nearly 50% are
expected under lower
emissions, depending on
Figure 10.Projected change in the average number of snow days per year; 1961-
1990 compared to 2070-2099 average under lower and higher emissions, by state. location, and 45 to 60% under
Values shown are the average of three AOGCM simulations. higher (Figure 10).
Extreme Precipitation Events
Extreme precipitation can damage homes, businesses, public infrastructure, and ecosystems, as
well as disrupteconomic activity. Heavy precipitation that leads to flooding can damage crops and
cause soil erosion, contaminate the water supply, promote infectious disease, disrupt
transportation, and lead to property damage or loss. In urban centers such as Chicago, located near
large bodies of water, extremely heavy precipitation events can lead to storm water discharge of
contaminants into water bodies.
The frequencies of heavy rain events (defined as occurring on average once per year during the
past century) have doubled since the early 1900s (Kunkel et al., 1999). Increases in the number of
individual rainy days, multi-day heavy rain events, and week-long heavy rain events have also been
observed (Changnon & Westcott, 2002; Changnon et al., 2001; Angel & Huff, 1997).
Projected changes in extreme rainfall events can be quantified in multiple ways, including the
metrics used here: (1) the number of days each year with more than 2 inches of rain, and (2) the
maximum annual 24-hr, 5-day, and 7-day precipitation totals.
All measures of extreme rainfall used here are consistent in projecting future increases,
increases that become larger over time, and that in general are slightly higher under higherYou can also read