Social Ties, Mobility, and COVID-19 spread in Japan
←
→
Page content transcription
If your browser does not render page correctly, please read the page content below
Social Ties, Mobility, and COVID-19 spread in Japan
Timothy Fraser ( timothy.fraser.1@gmail.com )
Northeastern University https://orcid.org/0000-0002-4509-0244
Daniel P. Aldrich
Northeastern University https://orcid.org/0000-0002-4150-995X
Research Article
Keywords: COVID-19, social capital, mobility, disaster, resilience, Japan
DOI: https://doi.org/10.21203/rs.3.rs-34517/v1
License: This work is licensed under a Creative Commons Attribution 4.0 International License.
Read Full License
Page 1/18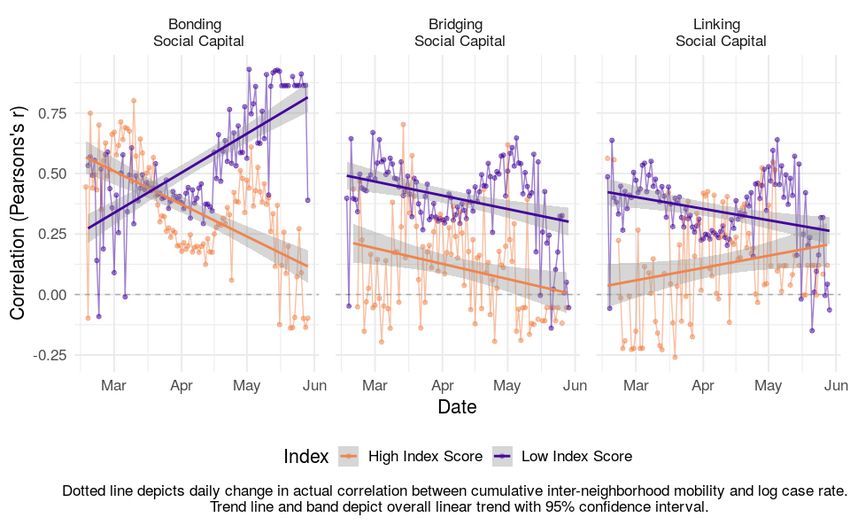
Abstract
Why are some communities documenting higher case loads of COVID-19 infections than others? Past
studies have linked the resilience of communities against crisis to their social vulnerability and to the
capacity of local governments to provide public goods and services like health care. Disaster studies,
which frequently examine the effect of social ties and mobility, may help illuminate the current spread of
COVID-19. We model the occurrence of new cases from February 17 to May 29 using 4841 prefecture-day
observations, paired with daily tallies of aggregate Facebook user movement among neighborhoods.
This preliminary study of Japanese prefectures nds that communities with strong bridging and linking
social ties start out more susceptible to COVID-19 spread, but their rates quickly decrease over time
compared to communities with stronger intra-group ties. These results imply that residents’ participation
in civil society and trust in o cials affect their adoption of new health behaviors like physical distancing,
improving their capacity to respond and adapt to crisis. Though bridging and linking communities
suffered more early on, they adapted better to new conditions, demonstrating greater resilience to the
pandemic. We anticipate this study to be a starting point for broader studies of the effect of social ties
and mobility on response to COVID-19 worldwide, verifying what kinds of social networks we should
invest in to adapt to this pandemic.

Introduction
Why are some communities documenting higher case loads of COVID-19 infections than others? Since
the global pandemic started, scholars have looked at the capacity of health care systems, the spread of
residents, and the social vulnerability of communities to crisis, but social ties, a key factor in disaster
studies, have remained absent from the conversation. This preliminary study of Japanese prefectures
 nds that communities with stronger bridging and linking social ties start out more susceptible to COVID-
19 spread, but quickly see decreasing rates over time compared to communities with stronger intra-group
ties. These results imply that residents’ participation in civil society and trust in o cials affect their
adoption of new health behaviors like physical distancing, improving their capacity to respond and adapt
to crisis.

This study makes three major contributions to the literature on disaster and pandemic response. First,
while past studies have linked social capital and social vulnerability to disaster outcomes (Cutter et al.
2006, Aldrich & Meyer 2015, Fraser et al. 2020), this study applies this to the COVID-19 pandemic. Though
social networks are associated with the spread of infection, this only occurs with contact; instead,
communities with strong social networks can convince family, friends, and neighbors to adopt vital new
behaviors like physical distancing and masks to reduce the spread of the virus.

Second, this study leverages Facebook user mobility data as a key mediating variable to discern the
relationships between social ties and COVID-19 case rates, building on a literature on the role of mobility
in crises (Yabe 2020, Fraser 2020). While geographic mobility has been linked to the spread of the avian
  u and SARS (Bowen & Laroe 2006, Smallman-Raynor & Cliff 2008), as well as COVID-19 (Zhang et al.

                                                  Page 2/18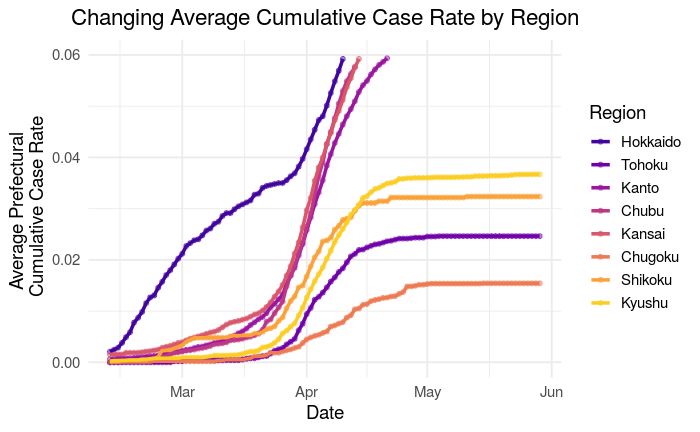
2020, Cowling et al. 2020), communities with higher social capital see lower or decreasing associations
between mobility and COVID-19 spread, as residents learn about how to protect themselves while moving
about.

Third, this study highlights that while health care system capacity is vital to reducing the spread of
pandemics (Schoenbaum et al. 2011), individual citizens and communities’ participation in public health
efforts is vital to ensuring widespread adoption of new health behaviors. This builds on past ndings
from SARS and Ebola (Tai and Sun, 2007; Funk et al., 2009; Vinck et al 2019), highlights that bridging and
linking social ties are especially key, and applies this to Japan. Even after the Japanese government
struggled to respond to the Diamond Princess outbreak and subsequent clusters, this study highlights
that residents and their social networks have made a difference in Japan’s response to COVID-19.

Literature Review
This study examines why some Japanese prefectures saw more new cases of COVID-19 than others.
Recent scholarship highlights that COVID-19 spreads through contact with aerosolized droplets from
persons carrying the virus, facilitated by coughing and sneezing (WHO 2020). On average, it takes 5 days
to develop symptoms, with a range of 1-14 days (Lauer et al. 2020). Tracking infection rates has been
problematic, as some states (such as the US and Japan) were slow to begin testing cases and have
failed to contact trace(Kingston 2020). Further, many people spread the virus asymptomatically (Lavezzo
et al. 2020). Based on infections reported already, we can examine variation in infection rates among
communities.

First, some communities might see higher rates of infection because of citizens’ behaviors and mobility
(Zhang et al. 2020, Cowling et al. 2020). Communities have adopted physical distancing at varying rates;
many Japanese prefectures and religious organizations did not close down key institutions until early
April (Kingston 2020, McLaughlin 2020). For example, the northern prefecture of Hokkaido saw a high
share of cases early on, while Aichi Prefecture in the Chubu Region developed a cluster of infections
gradually (See Figure 1). Communities where residents still move between neighborhoods frequently
might have higher case rates (Bowen & Laroe 2006, Smallman-Raynor & Cliff 2008). Similarly,
communities which already have developed cases are more likely to see spread due to exponential rates
of infection.

However, some communities see especially high rates of infection and death. In the US, African American
neighborhoods with high shares of low-income residents in New York City and the city of Flint, Michigan,
have seen disproportionately high infection rates (Mansoor 2020). These communities have greater
shares of socially vulnerable populations, such as residents who are elderly, women, single parents,
unemployed, in poverty, or racial, religious, or ethnic minorities. These populations tend to see worse
outcomes both from initial disasters and long term recovery processes (Cutter et al. 2006, Fussell et al.
2010), because they are nancially constrained from seeking help and have faced institutionalized
discrimination in the past.

                                                 Page 3/18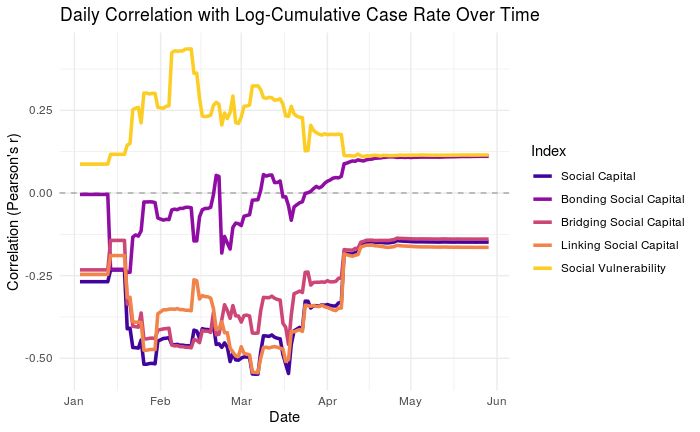
Yet some vulnerable communities manage better outcomes from crisis than others due to the capacity of
governments to provide better quality response (Bollyky et al. 2019, Hallerod et al. 2013, Farag et al.
2012). In the case of COVID-19, some communities had better funded governments that purchased
necessary materials and had more doctors, nurses, hospitals, and clinics available to serve new waves of
patients (Schoenbaum et al. 2011). Meanwhile, others struggled to provide similar levels of care for
populations.

Finally, even vulnerable communities with weak government and health care capacity could respond
better to crisis if they have strong social networks to rely on. Disaster scholars nd that strong social
capital - social ties that residents use for physical, nancial, and social support in times of crisis - are
powerful interventions that boost community resilience (Aldrich & Meyer 2015). Scholars found this after
the 1995 Kobe Earthquake, the 1995 Heat Wave in Chicago, the 2011 disaster in Japan, and after
Hurricanes Katrina, Sandy, and Harvey in the US (Edgington 2010, Klinenberg 2002, Aldrich 2019, Ye and
Aldrich 2019, Aldrich & Crook 2010, Collins et al 2017, Smiley et al. 2018, Metaxa-Kakavouli et al. 2018).

Social capital comes in three forms: bonding, bridging, and linking social ties. Bonding ties connect
members of the same social groups, like family members, neighbors, and members of co-ethnic or co-
religious groups, and help those groups survive crisis, but can lead to hoarding of resources. Bridging ties
connect members of different social groups, like unions, nonpro ts, and volunteer organizations,
facilitating civic engagement (Putnam 2000), reducing ethnic violence (Varshney 2001), and providing
mutual support across different social groups. Finally, linking ties connect residents to local, regional, and
national o cials, helping them access key public goods they might not otherwise receive (Aldrich 2019,
Sretzer & Woolcock 2004, Tsai 2007).

In the case of COVID-19, social networks boost the spread of quality information on how to keep
community members from contracting the virus. Past studies of epidemics found that information from
trusted personal ties is more effective in changing health behaviors than centralized information
campaigns (Tai and Sun, 2007; Funk et al., 2009; Vinck et al 2019). We hypothesize that bonding social
ties, like social vulnerability, might back re, circulating bad information while not providing new, quality
information. In contrast, we hypothesize that bridging and linking social ties might facilitate the spread of
quality information, since residents who trust their o cials and different social groups might trust WHO
guidelines on physical distancing more.

Results
This study modeled daily infection rates of prefectures from Japan’s Ministry of Health, Labor, and
Welfare from February 17 to May 29, compiled by JAG Japan (JAG Japan, 2020). We divided prefecture-
day observations into two datasets. First, we modeled why some prefectures encountered their rst case
using prefectures with 0 or 1 cases. Second, we modeled why some prefectures found additional cases
after their rst case, using prefectures with 1 or more cases. We tested the effect of social capital,
including bonding, bridging, and linking social capital, drawing from new indices (Fraser 2020) and the

                                                   Page 4/18
cumulative movement of residents among different neighborhoods. We assessed mobility using
aggregate level data from Facebook’s Data for Good project. Meanwhile, each model controlled for the
capacity of health care systems, government nances, and social vulnerability of communities, alongside
further demographic controls. Finally, since social processes might change as communities adapt to the
new pandemic, we modeled these infection rates using three time chunks, rst looking from February 17
to April 5 (to include a surge in cases at the start of April), then from February 17 to May 1, and then from
February 17 to May 29. This helps us con rm how long certain trends persist. Our modeling techniques,
including proxies used in these models, are discussed in depth in the Methods section at the conclusion
of this article.
This analysis nds three broad trends, described in Methods Appendix Tables 1, 2, and 3. First, the
models demonstrate several effects as expected. For example, cumulative inter-neighborhood movement
is positively related to increasing case rates, but negatively related to prefectures getting their very rst
case.
Up until April 5, more inter-neighborhood movement was associated with a higher likelihood of getting a
rst case of COVID-19 and getting subsequent cases. But by May 29, greater inter-neighborhood
movement actually became associated with a lower likelihood of rst cases, as cities adapted to the
crisis and adopted masks and some social distancing. This is because cumulative movement helps the
virus grow, but someone has to catch it rst in order to get their rst case. Likewise, the likelihood of virus
spread increases as time passes, while prefectures that spend more on health and keep a better balanced
budget tend to be much less likely to see their rst case or subsequent cases of COVID-19.
Second, we nd that towns with stronger bridging social capital are more likely to receive their rst case
and subsequent cases. Meanwhile, towns with strong linking social capital are less likely to receive their
rst case, but more likely to receive subsequent cases. This is because communities with strong civic
participation and frequent meetings of social groups are excellent places for clusters of infection to take
root, but communities with stronger linking social capital might be more likely to trust recommendations
from local government and health authorities, helping limit the spread of those clusters.
Third, using interaction effects over time, we found that towns with more overall social capital, especially
including bridging social capital, tended to see more cases outright, but fewer new cases over time. These
effects were strongest from February to May, and were more muted after considering cases from May 1
to May 29. This suggests that social capital had a signi cant role in shaping resident responses to the
virus in its rst several months in particular.
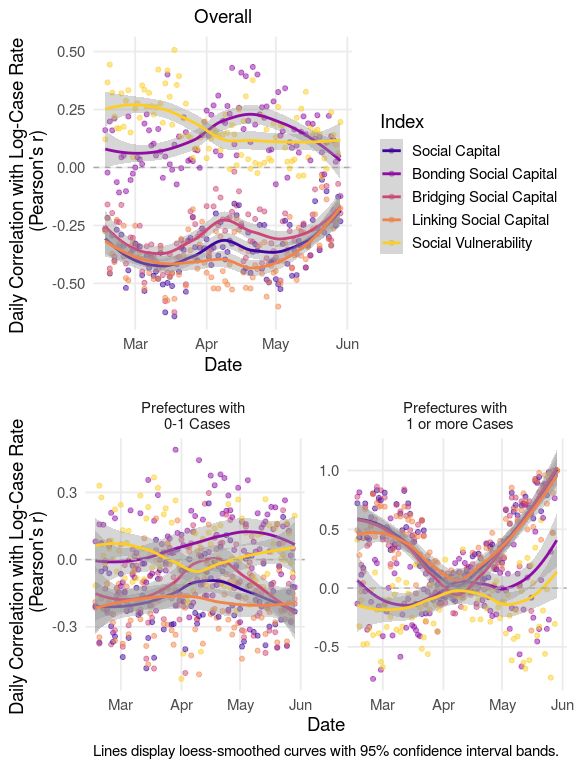
As added evidence, we found a similar bivariate trend between social capital predictors and case rates,
shown in the top panel of Figure 2. We analyzed how the daily correlation between prefectural social
capital and vulnerability with case rates changes over time. This shows that in aggregate, towns with
stronger bridging and linking social capital tend to see lower new case rates of COVID-19, while those
with greater bonding social capital and vulnerability tend to see higher case rates.
Page 5/18Then, in the second row of Figure 2, we compared our set of prefectures with 0 or 1 cases and our set
with 1 or more cases of COVID-19. Then, we used loess regression curves to track the change in these
correlations from February to late May. The right panel shows a much clearer (and stronger) relationship
between case rates and bridging and linking social capital after a prefecture gets its rst case than
before. However, those positive correlations with case rates dropped from February until late April, while
bonding social capital and vulnerability developed increasingly less negative relationships with case
rates over time. A nding of great concern is that bridging and linking capital’s declining relationship with
case rates only lasted until mid-April, after which it sharply increased again. Since late April, case rates
have shown an increasingly positive relationship with all forms of social capital and social vulnerability.
This implies that a tipping point was reached in late April, when some well networked communities began
interacting again, creating new clusters of infections.
When we examine the cumulative case rates in Figure 3, we see that over time, bridging and linking social
capital develop strong negative relationships with cumulative total case rates, even though they initially
had positive relationships with early case rates. This seems to suggest that these communities with
stronger bridging and linking ties are adapting over time, shifting from key sources of spread to key
mitigators of spread. Even though some communities with strong social capital saw new cases in May,
the cumulative pattern suggests that investing in bridging and linking social ties is a powerful grassroots
strategy for adaptation to pandemics.
Finally, to triangulate the effect of social ties on COVID-19 rates, we examined how social capital shapes
COVID-19 spread through mobility patterns. Figure 4 depicts the changing association over time between
case rates and the total cumulative inter-neighborhood mobility of Facebook users, with a line of best t
depicting the overall trend over time. However, each panel displays the relationship between mobility and
case rates separately for towns with social capital above vs. below the median. If social capital had no
effect, then we would expect the plots with high and low social capital to be nearly identical. However, in
several cases, the trend lines are completely reversed, and in others, the correlation differs greatly. This
analysis reveals three ndings.
First, prefectures with low social capital, including boning, bridging, and linking social capital, saw much
higher positive associations between mobility and infection rates than did prefectures with high social
capital. Second, prefectures with high and low social capital both saw the relationship between mobility
and case rates decline, indicating residents’ adaptation and adoption of new behaviors like physical
distancing, staying home, and wearing masks. Third, communities with strong bonding social capital saw
a starkly decreasing correlation in mobility and new cases over time, while those with weak bonding
social capital saw a starkly increasing association over time. Finally, over time, communities with
stronger bridging social ties saw decreasing relationships between mobility and infection, much more so
than those with weak bridging social ties. These ndings highlight that communities with stronger social
networks are adopting new and different mobility patterns and in-so-doing reducing their risk of
contracting and spreading COVID-19. Figure 4’s results are purely descriptive, and do not adjust for social
vulnerability, health care capacity, or other factors, but present strong, clear trends.
Page 6/18Discussion
In summary, we see preliminary evidence that social ties and mobility patterns are shaping the spread of
COVID-19 among Japanese municipalities. While strong bridging and linking ties trend directly with more
cases of infection, these same social resources correlate with declining rates of infection over time and
fewer cumulative infections. This suggests that communities are leveraging their bridging and linking
social ties to adapt to the crisis and helping spread quality information about better health practices. This
in turn may be reducing the infection rates of these highly socially active communities.
One challenge of inferring the effect of social ties on infection is that the Japanese government has been
widely criticized for testing too few residents over the last three months. Critics might argue that we only
observed that bridging and linking ties were related to infection rates because prefectures with stronger
social ties tend to have better quality governance, and those prefectures used those networks to identify
and test more people. However, this explanation is not appropriate. If communities with stronger bridging
and linking ties test more, we would expect the effect of bridging and linking social ties over time to
produce a false positive. However, we nd the opposite. This lends credence to our hypothesis that,
despite limited testing in Japan, bridging and linking social ties are critical to adapting to COVID-19
spread over time.
A second challenge of examining social ties is that communities have changed as COVID-19 unfolded. As
residents spent more time with family, commuted less, and companies reduced normally gruelling hours,
the monthly suicide rate in Japan dropped precipitously by 20% in April (Blair 2020). As a result, overall
models of social behavior during this period eclipse key changing trends over time. However, this study
compensated for changing social conditions by modeling three nested time spans, from February 17 to
April 5, to May 1, and to May 29. The effect of social networks on reducing COVID-19 spread over time
was most pronounced from February 17 to April 5, indicating that communities and local governments
should seek to activate these networks as early as possible.
Further, one advantage of this research is that it controls for the tendency of residents to move among
different neighborhoods, using aggregate tallies of Facebook user movement. Facebook users are a
relatively accurate means of measuring movement, as similar shares of users ages 20 to 59 and male
and female use Facebook. See the Methods appendix for further information on Facebook
demographics. We found that communities with greater cumulative mobility were much more likely to get
their rst infection, but this effect shrunk greatly thereafter, likely as these communities began to adopt
new health practices.
In summary, this study nds that social ties are a vital tool for adapting to and reducing COVID-19 spread,
drawing on the case of Japanese prefectures from February 17 to May 29. In Japan, more vulnerable
communities have seen fewer infections so far, because high earning urban metropolises have been
major vectors for spread instead. Though communities with strong bridging and linking social ties may
have facilitated early spread, over time, they are adapting better and reducing the rate of new infections,
much more than communities with strong bonding social capital. By investing in residents’ ties with their
Page 7/18broader community and with their elected o cials, we can improve our capacity to respond not just to
disasters but also pandemics.
Methods
This preliminary study examines why some Japanese prefectures saw more new cases of COVID-19 than
others. Using data from the Ministry of Health, Labor, and Welfare, this aggregate-level study analyses
how social ties shape the spread of COVID-19, while adjusting for the effects of human mobility,
cumulative infections, social vulnerability to crisis, health care capacity, governance capacity, and
demographics. Because the process that leads a prefecture to develop its rst case of infection is likely
quite different from the processes that lead a prefecture to develop its third, fourth, and four-hundredth
cases, we modeled these processes separately. Drawing from 4841 prefecture-day observations, we used
a logit model to explain why in 3683 cases, prefectures either saw zero or one reported new cases of
COVID-19. Then, we use a gamma model to explain why in 1632 cases, prefectures saw increasingly
positive case rates. In the logit models, the outcome is the count of new cases (0 or 1), controlling for
population as a predictor, while in the gamma models, we use the population-controlled case rate. This
data stretches from February 17 to May 29.
We repeated our analyses across three time frames to account for changing social processes as the
pandemic progresses. First, we analyzed cases from February 17 to April 5, to account for the high spread
of cases at the start of April. Second, we analyzed cases from February 17 to May 1, to account for the
decreasing rate of cases in late April. Third, we analyzed cases from February 17 to May 29 to account
for the stagnation of case rates in May. This three-pronged approach helps contextualize when key social
processes affect COVID-19 spread the most.
1. Key Variables
This analysis employs several key predictors. To model social capital and social vulnerability, we use new
indices modeled after the indices by Kyne & Aldrich (2019) & Cutter et al. (2003), aggregated to the
prefectural level. As an initial analysis, we model just social capital, while subsequent analyses replace
the social capital index with subindices for bonding, bridging, and linking social capital. All indices range
from 0 to 1, where 1 denotes the most social capital or vulnerability, and 0 signi es the least. Next, we
control for time using the number of days passed in the dataset. Next, to represent mobility, we calculated
the total cumulative number of Facebook users who moved between neighborhoods within or between
prefectures since the start date of the analysis, lagged by 5 days. This is to account for the fact that it
takes on average 5 days for COVID-19 spread to result in symptoms and new cases. This data was
provided by Facebook’s Data for Good project.
This study never had any contact with individual level Facebook user data, but instead uses aggregated
data provided by Facebook. Any user data was collected by Facebook Data for Good according to
Facebook's Data Use Policy, then aggregated to the neighborhood level to maintain individuals’ privacy,
so that researchers never had contact with individual level data. This aggregate level data is regularly
Page 8/18provided to humanitarian NGOs and research teams with data sharing agreements, and does not involve
any sensitive data nor user data. This analysis is an observational study of aggregate-level data, so no
Institutional Review Board protocol was necessary.
Finally, we also add as a predictor the cumulative case rate of a prefecture ve days prior. We might
expect that prefectures with greater population movement or more cases ve days prior might see more
new cases in the present. Facebook users are a decent approximation of movement in the population;
similar shares of users across age groups and gender use Facebook. According to a survey by Japan’s
Ministry of Internal Affairs and Communications (MIAC) in 2019, 32.8% of Japanese reported using
Facebook, compared with 17% of teens, 47% of users ages 20-29, 49% of users ages 30-39, 37% of users
ages 40-49, 29% of users ages 50-59, and 14% of users ages 60-69. Rates of use among men and women
were identical (33%). This gives us a highly detailed glimpse of movement within or between prefectures,
helping us assess the effect of this movement on spread rates.
2. Controls
This analysis also applied several control variables. First, the logit models use population as a control
variable (while population is already incorporated in the gamma model outcome variable, which is the
rate of cases per 1000 persons). Next, to represent overall health conditions, we use the life expectancy of
a prefecture. If we were modeling death rates, it would be more important to control for additional health
conditions, but since we are just modeling spread rates, we do not. Instead, we control for health care
capacity, because communities with better health care capacity might identify, quarantine, and treat
affected patients faster. This Health Care Capacity Index is a simple index of my own design that
combines the proportion of doctors, nurses, hospitals, and clinics per 1000 residents, transforms each
into a z-score, and then averages them together to make a single index. It is better to combine these as a
single predictor than to apply them as separate predictors, because communities with more nurses but
fewer doctors, for example, could still contain the spread of COVID-19 just as ne as communities with
more doctors but fewer nurses. Next, we also control for total municipal and prefectural expenditures on
health, as well as the health of municipality budgets, represented by the ratio of revenues to expenditures.
Finally, we control for several demographic traits. First, demographic vulnerability has already been
represented in this model by the social vulnerability index, which represents overall trends in age, gender,
income, education, employment, and health based vulnerability. Even so, we controlled for speci c key
traits of vulnerability as able, including the median age, unemployment rate, employment in the
secondary sector (manufacturing), and population.
Several demographic traits could not be added to the model, because they were highly correlated with
other demographic traits. Since there are only 47 prefectures, each demographic trait only has 47 unique
values over all prefecture-day observations; adding these variables led to high multicollinearity in models,
and so they were removed to ensure accurate estimated effects with no multicollinearity problems. For
example, in our dataset, the median age, income per capita, and the college education population are all
correlated with a Pearson's r of +/- 0.65 or above. Including any of these causes the variance in ation
Page 9/18factor to spike upwards of 7, which leads us to question the veracity of such a model. Similarly, health
conditions like heart disease and hypertension and even traits like population and gender are all strongly
correlated with the median age of a prefecture. Appendix Figure 1 shows a correlation matrix for all
variables in both models, shaded blue to signify strong positive correlations and red for strong negative
correlations. These re ect a substantial degree of correlation among control variables. To avoid these
multicollinearity issues, we employed a social vulnerability index, which already incorporates age, income,
occupation, and gender-based vulnerability (Fraser 2020). Similarly, we consider conditions like heart
disease and hypertension already controlled for because they are so collinear with age. Since COVID-19
case rates are only available at the prefectural level, this is the highest level of detail available, but future
studies may improve on this if municipal level case rates become available.
3. Models
For each time frame, we generated eight models in total, including four logit models and four gamma
models, resulting in 24 models total (See Methods Appendix Tables 1-3). For logit and gamma models,
the rst model used social capital as a predictor, while the second model included bonding, bridging, and
linking social capital instead. The third and four models applied interaction effects with time, testing
whether the effect of social capital indices and social vulnerability indices change over time. Each model
in the period between February 17 and April 5 explained at least 67% of the variation in new cases of
COVID-19. As the pandemic progressed, this decreased to 40% by May 1 and 25% by May 29 as
prefectures developed new social processes and behaviors in response to the pandemic. Based on chi-
squared intercept tests, all models t better than an intercept model, with a statistically signi cant t (p <
0.001).
Multicollinearity problems were abated by keeping the average variance in ation factor below 3.5 (except
for interaction models, which are naturally collinear). Bridging and linking social capital indices generated
the highest VIF scores, at 5.5. This is because bridging and linking social capital are related concepts.
While this score is higher than the gold standard of 2.5, it is nowhere near 10, a problematic level of
multicollinearity, meaning that it does not affect the validity of the model.
Finally, these models showed considerable heteroskedasticity, as shown by the Breusch-Pagan statistic
and p-values in Methods Appendix Tables 1, 2, and 3. This is because the same prefectures across days
tended to have similar outcomes, and so we used robust standard errors to calculate more conservative
estimates of statistical signi cance. Each model depicts the standardized coe cients, which describe the
log-odds of new cases given an increase of one standard deviation in a predictor. As a result, the size of
effects can be compared across different variables to show which variable has the largest estimated
effect on the outcome.
Declarations
Competing Interests: The authors declare no competing interests.
Page 10/18Correspondence: Correspondence and requests for materials should be addressed to Timothy Fraser at
timothy.fraser.1@gmail.com
Data availability: All code necessary for replicating this study is available for replication on the Harvard
Dataverse (https://doi.org/10.7910/DVN/LA2VWS).
Ethics Statements: All methods were carried out in accordance with relevant guidelines and regulations.
This study never had any contact with individual level Facebook user data, but instead uses aggregated
data provided by Facebook. Any user data was collected by Facebook Data for Good according to
Facebook's Data Use Policy, then aggregated to the neighborhood level to maintain individuals’ privacy,
so that researchers never had contact with individual level data. This aggregate level data is regularly
provided to humanitarian NGOs and research teams with data sharing agreements, and does not involve
any sensitive data nor user data. This analysis is an observational study of aggregate-level data, so no
Institutional Review Board protocol was necessary.
References
Aldrich, D. P., & Crook, K. (2008). Strong Civil Society as a Double-Edged Sword: Siting Trailers in Post-
Katrina New Orleans. Political Research Quarterly 61(3), 379–389.
https://doi.org/10.1177/1065912907312983
Aldrich, D. P., & Meyer, M. A. (2015). Social capital and community resilience. American Behavioral
Scientist 59(2), 254-269.
Aldrich, D.P. (2019). Black Wave: How Connections and Governance Shaped Recovery from Japan’s 3.11
Disasters. Chicago: University of Chicago Press.
Blair, Gavin. (2020, May 14). Japan suicides decline as Covid-19 lockdown causes shift in stress factors.
The Guardian. Accessed May 29, 2020. https://www.theguardian.com/world/2020/may/14/japan-
suicides-fall-sharply-as-covid-19-lockdown-causes-shift-in-stress-factors
Bollyky, T. J., Templin, T., Cohen, M., Schoder, D., Dieleman, J. L., & Wigley, S. (2019). The relationships
between democratic experience, adult health, and cause-speci c mortality in 170 countries between 1980
and 2016: an observational analysis. The Lancet 393, 1628–1640. doi: 10.1016/ S0140-6736(19)30235-
1.
Bowen, John T., & Laroe, Christian. (2006). Airline Networks and the International Diffusion of Severe
Acute Respiratory Syndrome (SARS). The Geographical Journal 172(2), 130-144.
Collins, J., R. Ersing, & A. Polen. (2017). Evacuation Decision-Making during Hurricane Matthew: An
Assessment of the Effects of Social Connections. Weather, Climate, & Society 9, 769–776.
Page 11/18Cowling, B.J., Ali, S.T., Ng, T.W.Y, Tsand, T.K., Li, J.C.M., Fong, M.W., et al. (2020), April 17. Impact
assessment of non-pharmaceutical interventions against coronavirus disease 2019 and in uenza in
Hong Kong: an observational study. Lancet Public Health 5, e279-88. https://doi.org/10.1016/S2468-
2667(20)30090-6
Cutter, S. L., Emrich, C. T., Mitchell, J. T., Boruff, B. J., Gall, M., Schmidtlein, M. C., Burton, C. G., & Melton, G.
(2006). The long road home: race, class, and recovery from Hurricane Katrina. Environment 48(2), 8-20.
Cutter, Susan L., Boruff, Bryan J., and Shirley, Lynn W. 2003. Social Vulnerability to Environmental
Hazards. Social Science Quarterly 84 (2), 242-261. DOI: 10.1111/j.1539-6924.2009.01341.x
Cyranoski, David. 2020, May 4. Pro le of a killer: the complex biology powering the coronavirus
pandemic. Nature. Accessed 5 May 2020. https://www.nature.com/articles/d41586-020-01315-7
Edgington, David W. (2010). Reconstructing Kobe: The Geography of Crisis and Opportunity. Vancouver,
CA: University of British Columbia Press.
Fraser, Timothy, Aldrich, Daniel P., & Small, Andrew. (2020). Connecting Social Capital and Vulnerability: A
Citation Network Analysis of Disaster Studies. Northeastern University Global Resilience Institute Working
Paper.
Fraser, Timothy. (2020). Japanese Social Capital and Social Vulnerability Indices: Measuring Drivers of
Community Resilience 2000-2017. Northeastern University Aldrich Resilience Lab Working Paper.
Fraser, Timothy. (2020). The Road More Traveled: Evacuation Networks from 10 disasters in the US and
Japan. Northeastern University Aldrich Resilience Lab Working Paper.
Farag, M., Nandakumar, AK, Wallack S., Hodgkin, D, Gaumer G, Erbil C. (2012). Health expenditures, health
outcomes and the role of good governance. Int J Health Care Finance Econ 13(1):33-52. doi:
10.1007/s10754-012-9120-3. Epub 2012 Dec 25.
Funk, S., Gilad, E., Watkins, C., & Jansen, V. A. (2009). The spread of awareness and its impact on
epidemic outbreaks. Proceedings of the National Academy of Sciences, 106(16), 6872-6877.
Fussell, E. Sastry, N., & VanLandingham, M. (2010). Race, socioeconomic status, and return migration to
New Orleans after Hurricane Katrina. Population & Environment 31(1-3), 20-42.
Halleröd, B., Rothstein, B., Daoud, A., & Nandy, S. (2013). Bad Governance and Poor Children: A
Comparative Analysis of Government E ciency and Severe Child Deprivation in 68 Low- and Middle-
income Countries. World Development 48, 19–31.
J.A.G. Japan. (2020). Ministry of Health, Labor, and Welfare COVID19 cases for Japanese prefectures.
Accessed May 5, 2020. https://gis.jag-japan.com/covid19jp/
Page 12/18Klinenberg, Eric. (2002). Heat Wave: A Social Autopsy of Disaster in Chicago. Chicago: University of
Chicago Press.
Kingston, J. (2020, April 1). Abe prioritized Olympics, slowing Japan's pandemic response. Asia Paci c-
Journal Japan Focus 18, no. 5 (article 5387), 1-9. https://apjjf.org/-Jeff-Kingston/5387/article.pdf
Kyne, D. & Aldrich, D. P. (2019). Capturing Bonding, Bridging, and Linking Social Capital through Publicly
Available Data. Risk, Hazards, & Crisis in Public Policy. DOI: 10.1002/rhc3.12183
Lauer S.A., Grantz, K.H., Bi, Q, et al. (2020). The Incubation Period of Coronavirus Disease 2019 (COVID-
19) From Publicly Reported Con rmed Cases: Estimation and Application. Ann Intern Med 172:577–582.
[Epub ahead of print 10 March 2020]. doi: https://doi.org/10.7326/M20-0504
Lavezzo, E., Franchin, E., Ciavarella, C., Cuomo-Dannenburg, G., Barzon, L., Del Vecchio, C., et al. (2020).
Suppression of COVID-19 outbreak in the municipality of Vo, Italy. medRxiv 2020.04.17.20053157; doi:
https://doi.org/10.1101/2020.04.17.20053157
Mansoor, S.. (2020, April 5). Data Suggests Many New York City Neighborhoods Hardest Hit by COVID-19
Are Also Low-Income Areas. Time Magazine. Accessed 5 May 2020. https://time.com/5815820/data-
new-york-low-income-neighborhoods-coronavirus/
Metaxa-Kakavouli, D., Maas, P., & Aldrich, D. P. (2018). How social ties in uence Hurricane Evacuation
Behavior. Proceedings of the ACM on Human-Computer Interaction 2 (122).
Ministry of Internal Affairs and Communications. 2019. Survey on time and information behavior of
information and communication media. Accessed 1 May 2020.
https://www.soumu.go.jp/main_content/000644166.pdf
McLaughlin, Levi. (2020, May 1). Japanese Religious Responses to COVID-19: A Preliminary Report. Asia
Paci c Journal Japan Focus 18, no. 3 (article 5394), 1-23. https://apjjf.org/-Levi-
McLaughlin/5394/article.pdf
Putnam, Robert D. (2000). Bowling Alone: The Collapse and Revival of American Community. Simon &
Schuster.
Schoenbaum, Stephen C., Schoen, Cathy, Nicholson, Jennifer L, & Cantor, Joel C. 2011. Mortality
amenable to health care in the United States: The roles of demographics and health systems
performance. Journals of Public Health Policy 32 (4), 407-429.
Smallman-Raynor, Matthew, & Cliff, Andrew D. 2008. The Geographical Spread of Avian In uenza A
(H5N1): Panzootic Transmission (December 2003-May 2006), Pandemic Potential, and Implications.
Annals of the Association of American Geographers, Vol. 98, No. 3, pp. 553-582.
Page 13/18Smiley, K., Howell, J., & Elliot, J. (2018). Disasters, Local Organizations, and Poverty in the USA, 1998 to
2015. Population and Environment 40 (2): 115–35.
Szreter, S, & Woolcock, M. (2004) Health by association? Social capital, social theory, and the political
economy of public health. International Journal of Epidemiology 33 (4), 650–667,
https://doi.org/10.1093/ije/dyh013
Tai, Z., & Sun, T. (2007). Media dependencies in a changing media environment: The case of the 2003
SARS epidemic in China. New Media & Society 9(6), 987-1009.
Tsai, L. (2007). Solidary Groups, Informal Accountability, and Local Public Goods Provision in Rural
China. American Political Science Review 101(2), 355-372.
Varshney, A. (2001). Ethnic Con ict and Civil Society: India and Beyond. New Haven, CT: Yale University
Press.
Vinck, Patrick, Phuong N Pham, Kenedy K Bindu, Juliet Bedford, and Eric J Nilles (2019). Institutional trust
in misinformation in the response to the 2018-19 Ebola outbreak in North Kivu, DR Congo: A population-
based survey. The Lancet Infectious Diseases.
World Health Organization. (2020, April 17). Q&A on Coronaviruses (COVID-19). Accessed 5 May 2020.
https://www.who.int/news-room/q-a-detail/q-a-coronaviruses
Yabe, T, Tsubouchi, K, Fujiwara, N, Sekimoto, Y, Ukkusuri, SV. (2020). Understanding post-disaster
population recovery patterns. Journal of Royal Society Interface 17(163), doi: 10.1098/rsif.2019.0532.
Ye, Maoxin, and Aldrich, Daniel P. (2019). Substitute or complement? How social capital, age and
socioeconomic status interacted to impact mortality in Japan's 3/11 tsunami. Social Science and
Medicine: Population Health. Vol 7 https://doi.org/10.1016/j.ssmph.2019.100403
Zhang, J., Litvinova, M., Liang, Y., Wang, Y., Wang, W., Zhao S., Wu, Q., Merler, S., Viboud, C., Vespignani, A.,
Ajelli, M., & Yu, H. (2020, April 29). Changes in contact patterns shape the dynamics of the COVID-19
outbreak in China. Science. eabb8001 DOI: 10.1126/science.abb8001
Appendices
Appendix Table 1: Daily New Cases among Japanese Prefectures, Feb 17 - April 5
Appendix Table 2: Daily New Cases among Japanese Prefectures, Feb 17 - May 1
Appendix Table 3: Daily New Cases among Japanese Prefectures, Feb 17 - May 29
Appendix Figure 1: Correlation Matrix for Logit and Gamma Models
Page 14/18Figures
Figure 1
Changing Average Cumulative Case Rates by Region
Page 15/18Figure 2
Bridging and Linking Social Ties Associated with Lower Case Rates
Page 16/18Figure 3
Cumulative Case Rate, Social Capital & Vulnerability
Page 17/18Figure 4
Social Capital’s Intervening Effect on Mobility and COVID-19 Spread
Supplementary Files
This is a list of supplementary les associated with this preprint. Click to download.
appendixtable1.png
appendixtable2.png
appendixtable3.png
appendix gure1.png
Page 18/18You can also read