On the best locations for ground-based polar stratospheric cloud (PSC) observations
←
→
Page content transcription
If your browser does not render page correctly, please read the page content below
Atmos. Chem. Phys., 21, 505–516, 2021
https://doi.org/10.5194/acp-21-505-2021
© Author(s) 2021. This work is distributed under
the Creative Commons Attribution 4.0 License.

On the best locations for ground-based polar stratospheric cloud
(PSC) observations
Matthias Tesche1 , Peggy Achtert2 , and Michael C. Pitts3
1 Leipzig
        Institute for Meteorology (LIM), Leipzig University, Stephanstrasse 3, 04103 Leipzig, Germany
2 MeteorologicalObservatory Hohenpeißenberg, German Weather Service (DWD), Germany
3 NASA Langley Research Center, Hampton, Virginia 23681, USA

Correspondence: Matthias Tesche (matthias.tesche@uni-leipzig.de)

Received: 3 September 2020 – Discussion started: 29 September 2020
Revised: 26 November 2020 – Accepted: 27 November 2020 – Published: 15 January 2021

Abstract. Spaceborne observations of polar stratospheric         for ground-based lidar observations of PSCs are Summit and
clouds (PSCs) with the Cloud-Aerosol LIdar with Orthogo-         Villum in the Arctic and Mawson, Troll, and Vostok in the
nal Polarization (CALIOP) aboard the Cloud-Aerosol Lidar         Antarctic.
and Infrared Pathfinder Satellite Observations (CALIPSO)
satellite provide a comprehensive picture of the occurrence
of Arctic and Antarctic PSCs as well as their microphysical
properties. However, advances in understanding PSC micro-        1   Introduction
physics also require measurements with ground-based instru-
ments, which are often superior to CALIOP in terms of, for       The existence of polar stratospheric clouds (PSCs) is of crit-
example, time resolution, measured parameters, and signal-       ical importance for stratospheric ozone depletion during po-
to-noise ratio. This advantage is balanced by the location of    lar winter. They provide the surface for heterogeneous reac-
ground-based PSC observations and their dependence on tro-       tions which transform stable chlorine and bromine species
pospheric cloudiness. CALIPSO observations during the bo-        into their highly reactive ozone-destroying states (Lowe and
real winters from December 2006 to February 2018 and the         MacKenzie, 2008; Solomon, 1999). PSC formation requires
austral winters 2012 and 2015 are used to assess the effect      low temperatures that support the condensation of strato-
of tropospheric cloudiness and other measurement-inhibiting      spheric water vapour and nitric acid vapour onto the available
factors on the representativeness of ground-based PSC ob-        stratospheric aerosol particles. These conditions are gener-
servations with lidar in the Arctic and Antarctic, respec-       ally found from December to February in the Arctic and be-
tively. Information on tropospheric and stratospheric clouds     tween late May and early October in the Antarctic (Pitts et
from the CALIPSO Cloud Profile product (05kmCPro ver-            al., 2018).
sion 4.10) and the CALIPSO polar stratospheric cloud mask           Since the early 1990s, airborne and ground-based lidar
version 2, respectively, is combined on a profile-by-profile     remote-sensing observations of PSC optical properties have
basis to identify conditions under which a ground-based li-      been used to classify PSCs into different types according
dar is likely to perform useful measurements for the anal-       to their size, shape, and chemical composition (Achtert and
ysis of PSC occurrence. It is found that the location of a       Tesche, 2014). Detailed observations of PSC occurrence and
ground-based measurement together with the related tropo-        composition are also available from passive remote-sensing
spheric cloudiness can have a profound impact on the derived     observations with the Michelson Interferometer for Passive
PSC statistics and that these findings are rarely in agreement   Atmospheric Sounding (MIPAS) instrument (Spang et al.,
with polewide results from CALIOP observations. Consider-        2018). Today, there is consensus that PSC particles consist
ing the current polar research infrastructure, it is concluded   of supercooled liquid ternary solution (STS), nitric acid tri-
that the most suitable sites for the expansion of capabilities   hydrate (NAT) crystals, or water ice (ice) and that PSCs are
                                                                 made up of different mixtures of those three components.

Published by Copernicus Publications on behalf of the European Geosciences Union.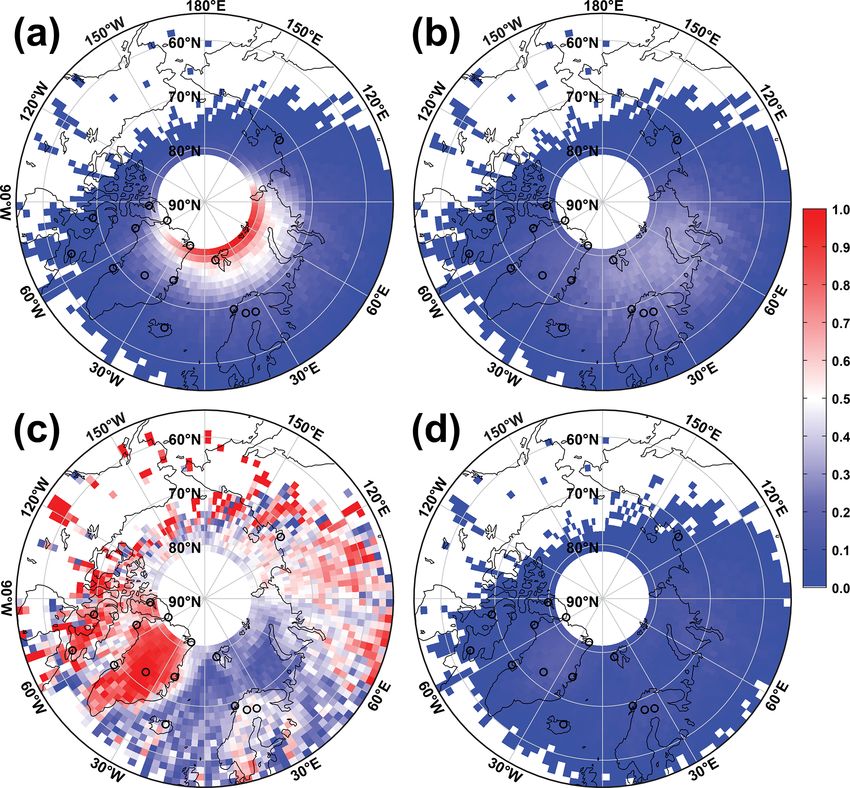
506                          M. Tesche et al.: Representativeness of ground-based polar stratospheric cloud observations

   Ground-based lidar observations of PSCs are generally
performed at the mercy of tropospheric clouds. Since its
launch in June 2006, the Cloud-Aerosol LIdar with Orthogo-
nal Polarization (CALIOP) aboard the Cloud-Aerosol Lidar
and Infrared Pathfinder Satellite Observations (CALIPSO)
satellite (Winker et al., 2009) has been providing a polewide
view of Arctic and Antarctic PSCs that is unaffected by tro-
pospheric cloudiness. The initial CALIPSO PSC classifica-
tion scheme employs light-scattering calculations that con-
sider spherical and non-spherical particle shapes to relate sets
of optical parameters to microphysical properties (Pitts et
al., 2009, 2013). Recently, the CALIPSO polar stratospheric
cloud mask version 2 was introduced to correct deficiencies
of the initial CALIPSO PSC classification and to improve
composition discrimination (Pitts et al., 2018).
   Traditionally, two approaches are used to match ground-
based lidar measurements to spaceborne observations. Either
statistics from a time series of ground-based measurements
are compared to those obtained from averaging spaceborne
observations for a specific grid box around the ground station
or individual ground-based observations are matched to the
data of the closest CALIPSO approach (Snels et al., 2019).
Both methods can introduce biases as a result of imperfect
temporal or spatial collocation. In addition, ground-based
and spaceborne lidar observations of PSCs are often anal-
ysed with customised retrieval algorithms that can vary in
their definition of different PSC types (Achtert and Tesche,
2014). The combined data set of CALIPSO cloud observa-
tions in the troposphere and stratosphere during the Arc-
tic winters from December 2006 to February 2018 and the
Antarctic winters 2012 and 2015 presented here allows for an
assessment of the effect of tropospheric cloudiness and other
measurement-inhibiting factors on the representativeness of
ground-based lidar measurements of PSCs in a novel way.
This paper starts with a description of the data and methods
in Sect. 2. Results are presented and discussed in Sect. 3, and
conclusions are drawn in Sect. 4.
                                                                   Figure 1. Locations of research stations in (a) the Arctic and (b) the
                                                                   Antarctic and their respective abbreviations as listed in Table 1. Red
2     Data and methods                                             open circles mark stations with atmospheric lidar measurements,
                                                                   while red filled circles refer to stations with published PSC mea-
2.1    Ground stations                                             surements. Other stations of potential interest for ground-based PSC
                                                                   observations are marked by blue open circles.
Figure 1 and Table 1 provide an overview of the Arctic and
Antarctic research stations considered here. The sites were
selected because they are accessible, manned year-round, and       al., 2001); McMurdo (Adriani et al., 2004; Snels et al., 2019);
assumed to provide the necessary infrastructure for ground-        and Syowa (Shibata et al., 2003) in the Antarctic. Also high-
based lidar measurements. Sites are also selected to min-          lighted are stations with a record of lidar measurements that
imise overlap with other research stations. Emphasised are         are not specifically dedicated to PSC observations: Alomar
the established PSC observatories Esrange, Sweden (Blum            (Langenbach et al., 2019), Iqualuit, and Summit (Neely et
et al., 2005); Eureka, Canada (Donovan et al., 1997); Ny           al., 2013) in the Arctic and Davis in the Antarctic.
Ålesund, Svalbard (Massoli et al., 2006); and Sodankylä,
Finland (Müller et al., 2001) in the Arctic and Belgrano
II (Córdoba-Jabonero et al., 2013); Concordia (Snels et al.,
2020); Dumont d’Urville (David et al., 1998; Santecesaria et

Atmos. Chem. Phys., 21, 505–516, 2021                                                   https://doi.org/10.5194/acp-21-505-2021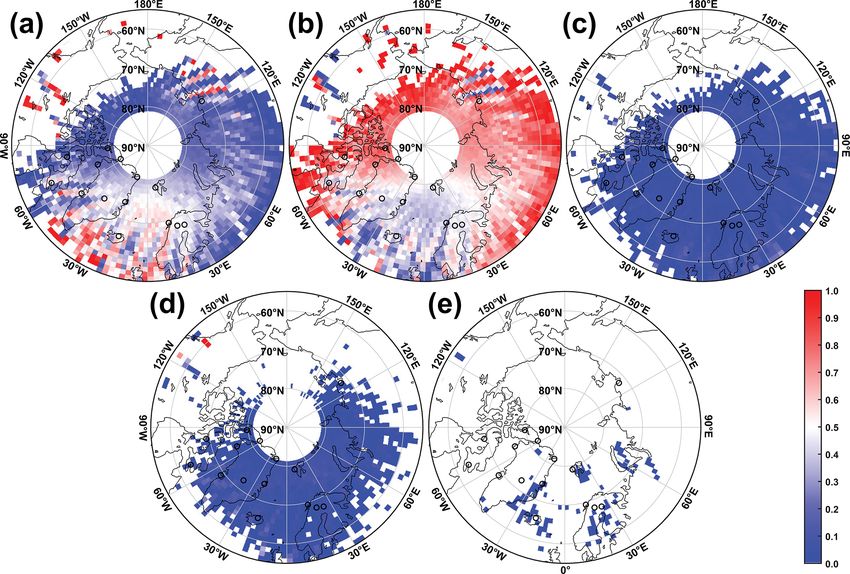
M. Tesche et al.: Representativeness of ground-based polar stratospheric cloud observations                                                                     507

Table 1. Overview of the location of Arctic and Antarctic research stations. Station abbreviations in the first and fifth columns are used to
mark the corresponding sites in Figs. 1 and 8. R gives the ratio of PSC height bins for tropospheric cloudiness that relates to the data coverage
of a ground-based (cloud-free and transparent clouds) and a spaceborne lidar (all sky).

        Arctic station                                    Location              R          Antarctic station                           Location          R
        AL       Alert, Canada                            82◦ N, 62◦ W          0.59       BE        Belgrano II, Coats Landb          78◦ S, 35◦ W      0.57
        AM       Alomar, Norwaya                          69◦ N, 16◦ E          0.42       CA        Casey, Vincennes Bay              66◦ S, 111◦ E     0.60
        ES       Esrange, Swedenb                         68◦ N, 21◦ E          0.51       CO        Concordia, Antarctic Plateaub     75◦ S, 123◦ E     0.99
        EU       Eureka, Canadab                          80◦ N, 86◦ W          0.74       DA        Davis, Princess Elizabeth Landa   69◦ S, 78◦ E      0.71
        IG       Igloolik, Canada                         69◦ N, 82◦ W          0.71       DU        Dumont d’Urville, Aélie Landb     66◦ S, 140◦ E     0.70
        IQ       Iqaluit, Canadaa                         64◦ N, 69◦ W          0.92       JB        Jang Bogo, Terra Nova Bay         75◦ S, 164◦ E     0.74
        MY       Myvatn, Iceland                          66◦ N, 17◦ W          0.46       MR        Marambio, Marambio Island         64◦ S, 57◦ W      0.43
        NA       Ny Ålesund, Svalbardb                    79◦ N, 12◦ E          0.29       MW        Mawson, Mac Robertson Land        68◦ S, 63◦ E      0.83
        QE       Qeqertarsuaq, Greenland                  69◦ N, 54◦ W          0.51       MM        McMurdo, Ross Islandb             78◦ S, 167◦ E     0.71
        SO       Sodankylä, Finlandb                      67◦ N, 27◦ E          0.42       MI        Mirny, Davis Sea                  67◦ S, 93◦ E      0.85
        SS       Summit Station, Greenlanda               73◦ N, 39◦ W          0.99       NM        Neumayer III, Atka Bay            71◦ S, 8◦ W       0.60
        TU       Thule, Greenlanda                        77◦ N, 69◦ W          0.73       SM        San Martín, Barry Island          68◦ S, 67◦ W      0.45
        TI       Tiksi, Russia                            72◦ N, 129◦ E         0.52       SY        Syowa, Queen Maud Landb           69◦ S, 40◦ E      0.58
        VI       Villum, Greenland                        82◦ N, 17◦ W          0.54       TR        Troll, Queen Maud Land            72◦ S, 3◦ E       0.85
        ZA       Zackenberg, Greenland                    75◦ N, 21◦ W          0.73       VO        Vostok, Antarctic Ice Sheet       78◦ S, 106◦ E     1.00
      a Stations with a deployment of atmospheric lidar instruments. b Stations with existing PSC data sets.

2.2      Cloud Profile data                                                                   Table 2. Number of considered CALIPSO profiles with PSC obser-
                                                                                              vations for different tropospheric cloudiness in the Arctic (Decem-
Information on tropospheric clouds is taken from the                                          ber 2006 to February 2018) and the Antarctic (winters of 2012 and
CALIPSO level 2 version 4.10 Cloud Profile product (05km-                                     2015). The sum of cloud-free conditions and profiles with transpar-
CPro.v4.10), which provides information on the vertical ex-                                   ent clouds makes up the view of a ground-based lidar.
tent of different cloud types as well as profiles of the opti-
cal properties of clouds with a resolution of 5 km along the                                             Tropospheric cloudiness       Arctic     Antarctic
CALIPSO ground track and 30 m height bins below 8.2 km                                                   All sky                   1 000 572    1 676 986
height (60 m height bins between 8.2 and 20.2 km height).                                                Cloud free                  218 553      402 630
The extracted parameters are time, latitude, longitude, and                                              Transparent                 225 600      740 952
the cloud type as provided in the Vertical Feature Mask prod-                                            Ground based                444 153    1 143 582
uct.
   Features that are identified as clouds in the CALIPSO re-
trieval are further classified into eight cloud types (Liu et
al., 2009): (i) low overcast, transparent; (ii) low overcast,                                 NAT mixture, ice, NAT enhanced, and wave ice. The polar
opaque; (iii) transition stratocumulus; (iv) low, broken cumu-                                stratospheric cloud mask product has an along-track resolu-
lus; (v) altocumulus (transparent); (vi) altostratus (opaque);                                tion of 5 km, identical to the tropospheric CALIPSO prod-
(vii) cirrus (transparent); and (viii) deep convective (opaque).                              ucts, and a vertical resolution of 180 m. The new CALIPSO
Ground-based equivalent CALIPSO observations are those                                        polar stratospheric cloud mask corrects known deficiencies
that show an absence of tropospheric clouds or only transpar-                                 in previous versions (Pitts et al., 2009, 2013) and is described
ent clouds for which a human operator would likely consider                                   in detail in Pitts et al. (2018). A first evaluation with ground-
performing a ground-based measurement, i.e. transparent al-                                   based measurements at Antarctica is presented in Snels et al.
tocumulus, cirrus, or a combination of the two. An overview                                   (2019).
of the number of considered CALIPSO profiles with PSC ob-                                        While all boreal winters from December 2006 to February
servations for different tropospheric cloudiness is presented                                 2018 are considered in the analysis of Arctic PSCs, only the
in Table 2.                                                                                   austral winters of 2012 and 2015 are included in the analysis
                                                                                              of Antarctic PSCs. However, the generally higher occurrence
2.3      Polar stratospheric cloud mask version 2                                             rate of Antarctic PSCs means that a larger number of individ-
                                                                                              ual PSC profiles was observed during the 2 Antarctic winters
The CALIOP version 2 PSC detection and composition                                            compared to the 12 considered Arctic winters (see Table 2).
classification algorithm (CALIPSO polar stratospheric cloud                                      Because of CALIPSO’s top-down viewing geometry, pro-
mask v2) separates stratospheric cloud features into STS,                                     files start with the uppermost height bin (bin 1) down to the

https://doi.org/10.5194/acp-21-505-2021                                                                             Atmos. Chem. Phys., 21, 505–516, 2021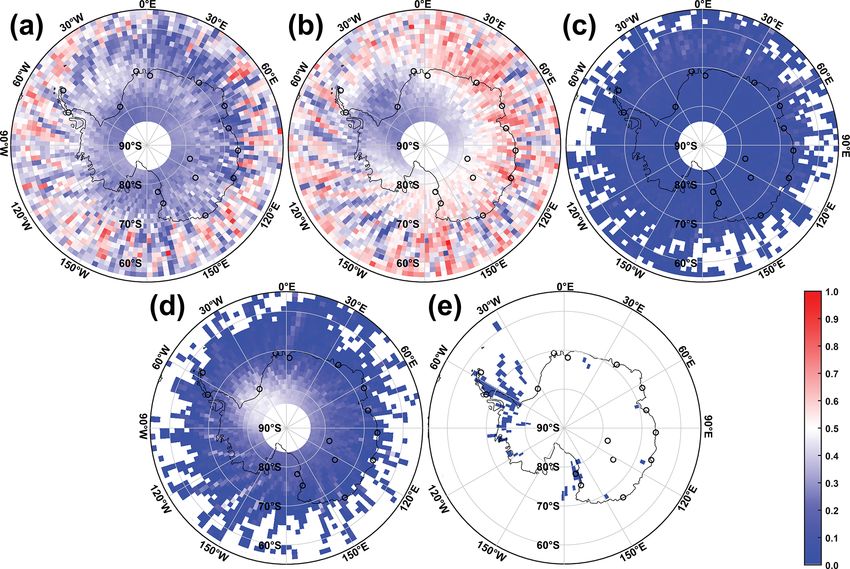
508 M. Tesche et al.: Representativeness of ground-based polar stratospheric cloud observations
lowermost height bin (bin 583). Profiles in the CALIPSO is applied to emulate the likely conditions for meaningful
polar stratospheric cloud mask v2 product extend down to ground-based PSC measurements in the CALIPSO data set.
8.2 km. They can therefore contain contributions of upper- Specifically, we assume that a ground-based lidar would only
tropospheric cirrus, as visualised in Figs. 13 and 20 of Pitts et provide meaningful results during conditions with no clouds
al. (2018). To exclude the contribution of such cirrus clouds or only transparent clouds that would not already attenuate
from our analysis, only height bins above 14.9 km (smaller the laser beam before it can reach PSC altitudes. This is re-
than bin 85) and 13.1 km (smaller than bin 96) are consid- ferred to as the ground-based view of the CALIPSO data set.
ered to represent Arctic and Antarctic PSC, respectively. It provides sampling that is dependent on the CALIPSO re-
turn rate and must not be confused with actual ground-based
2.4 Data analysis measurements that can provide localised PSC observations
in the time range from hours to weeks.
Information on cloud type from the Vertical Feature Mask in We subsequently separate the ground-based view of the
the 05kmCPro.v4.10 Cloud Profile product is used to sum up CALIPSO data set into two scenarios for which (i) all cases
the number of height bins with different tropospheric cloudi- of the ground-based view are considered and (ii) one-third
ness for each CALIPSO profile. This information is used to of the profiles of the ground-based view was randomly se-
identify cloud-free conditions (a total of zero counts for each lected. The first scenario corresponds either to a continu-
of the eight cloud types) and situations with only transpar- ously operating lidar or a manually operated system that is
ent tropospheric clouds that would still enable meaningful active during every single CALIPSO overpass with possi-
PSC observations with a ground-based lidar, i.e. altocumu- ble downtime in between without any interference by tropo-
lus (transparent), cirrus (transparent), or a combination of the spheric clouds or measurement-inhibiting factors. The sec-
two. In addition, all sky refers to the use of all profiles inde- ond scenario also refers to CALIPSO-synchronous measure-
pendent of tropospheric cloudiness. ments with the caveat that interfering factors reduce the num-
The CALIPSO polar stratospheric cloud mask v2 is pro- ber of measured lidar profiles to one-third of what would
cessed analogous to the Vertical Feature Mask for tropo- ideally be possible. This latter scenario is much more real-
spheric clouds by accumulating the number of height bins istic as (i) most ground-based lidar instruments are operated
with different PSC composition for each CALIPSO profile. manually and on campaign basis; (ii) the decision to start a
PSCs that extend over just one height bin are excluded from measurement, i.e. the assessment of tropospheric cloudiness,
the analysis. A CALIPSO profile is referred to as contain- is made subjectively by the operator; and (iii) infrastructural
ing a certain PSC composition (e.g. STS-containing or ice- challenges (e.g. system downtime, logistical problems, and
containing profiles) if the respective component is identified lack of personnel) affect the operation of a ground-based li-
in at least one of the PSC height bins. dar at a remote location and under harsh conditions.
To enable a combined analysis of cloudiness in the po- To assess the representativeness of ground-based PSC
lar troposphere and stratosphere, the data extracted from measurements, PSC statistics are obtained for boxes of 2◦
the 05kmCPro.v4.10 and polar stratospheric cloud mask v2 latitude by 2◦ longitude around the sites in Fig. 1 and Ta-
products are temporally matched and reduced to only those ble 1.
profiles with detected PSCs. The data set is then filtered
according to the occurrence of (i) tropospheric clouds and
(ii) PSCs with different composition. The filtered data are 3 Results and discussion
gridded into cells of 1.25◦ latitude by 2.50◦ longitude for vi-
sualisation of PSC occurrence. Maps of the occurrence of 3.1 Arctic observations
the accumulated number of height bins related to different
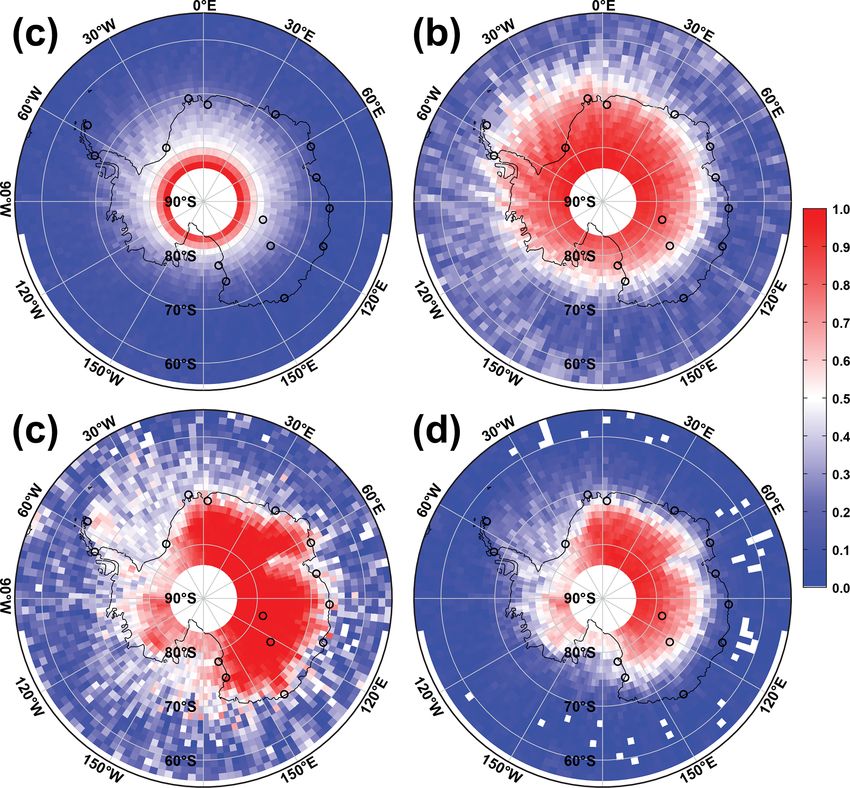
PSC compositions are normalised by the total number of PSC The absolute number of observed PSC profiles (normalised
height bins per considered grid box (see Figs. 2, 3, 5, and 6). to a maximum count of 2478) and the PSC occurrence rate
The matched observations of tropospheric and strato- (the ratio of observed CALIPSO PSC profiles versus all
spheric clouds allow for a direct comparison of individual CALIPSO profiles) are shown in Fig. 2a and b, respectively.
PSC profiles as well as long-term PSC statistics as seen from The absolute number of PSC observations is largest at high-
ground and space independent of the considered instruments. est latitudes due to the high CALIPSO return rate at those
Specifically, the same profile can be evaluated from two per- locations. The effect of the return rate is compensated for in
spectives, i.e. from space as well as from the point of view the PSC occurrence ratio in Fig. 2b. Overall, Arctic PSCs are
of a ground-based instrument. In that context, the latter per- most abundant between 30◦ W and 90◦ E and north of 70◦ N.
spective translates to a CALIPSO-synchronous measurement The pattern of the CALIPSO-derived PSC occurrence rate re-
protocol at a ground station. True PSC statistics unaffected sembles the MIPAS-based findings in Fig. 6b of Spang et al.
by tropospheric cloudiness, i.e. during all-sky conditions, at a (2018). Note that Pitts et al. (2018) derived PSC occurrence
certain location can only be obtained with a spaceborne lidar. frequencies for fixed altitudes of 2 = 500 K (around 20 km)
In contrast, filtering with respect to tropospheric cloudiness and that the PSC area in their Fig. 24 is thus smaller than in-
Atmos. Chem. Phys., 21, 505–516, 2021 https://doi.org/10.5194/acp-21-505-2021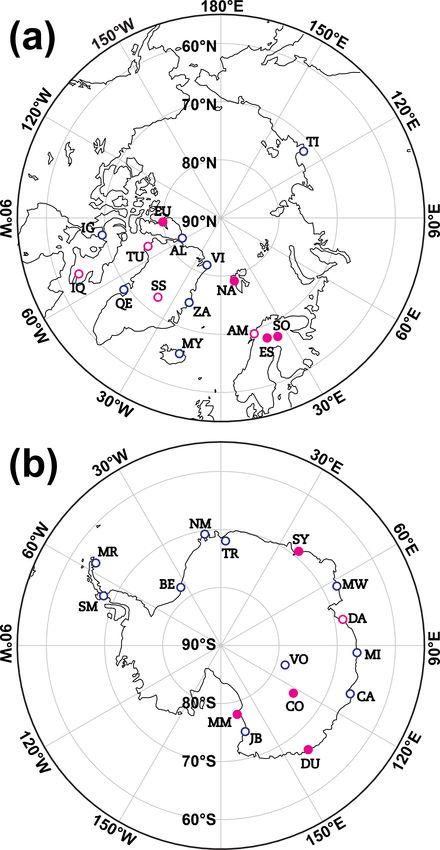
M. Tesche et al.: Representativeness of ground-based polar stratospheric cloud observations                                         509

Figure 2. Normalised number of CALIPSO profiles with PSCs detected over the Arctic (a, scaled to maximum count of 2478), ratio of
CALIPSO profiles with PSCs detected versus all CALIPSO profiles (with and without PSCs detected) for the same time period (b, PSC
occurrence rate), ratio of CALIPSO profiles with favourable tropospheric cloud conditions for ground-based lidar measurements (no or only
transparent clouds) and PSCs detected versus all CALIPSO profiles with PSCs detected for the same time period (c), and ratio of CALIPSO
profiles with favourable tropospheric cloud conditions for ground-based lidar measurements and PSCs detected versus all CALIPSO profiles
for the same time period (d). Black circles mark the locations of lidar ground stations shown in Fig. 1 and listed in Table 1.

ferred from considering all PSC height levels as done here.            vide much easier access than the other more remote loca-
Figure 2a and b also shows that the geography of the Arctic            tions. Tiksi is a station that could potentially provide infor-
means that most ground stations are located in areas of rela-          mation on PSCs over the Siberian Arctic.
tively low PSC occurrence. This is levelled by the normalised             The occurrence rate of PSCs with different chemical com-
occurrence rate of suitable conditions for ground-based ob-            positions in the Arctic for all-sky conditions is shown in
servations presented in Fig. 2c and d. The difference between          Fig. 3. Here and in the following closer look at Arctic PSCs,
the two displays is that Fig. 2c is normalised to the number of        normalisation is done with respect to all CALIPSO pro-
all PSC-containing CALIPSO profiles, while Fig. 2d is nor-             files that contain PSCs (analogous to Fig. 2c) rather than
malised to all CALIPSO profiles. The region of highest PSC             all CALIPSO profiles (as in Fig. 2b and d). Figure 3 reveals
occurrence rate over the northern Atlantic coincides with the          that STS and NAT mixture are most abundant with a region
highest occurrence of opaque tropospheric clouds. While Ny             of maximum STS occurrence over the northern Atlantic and
Ålesund could potentially observe the most PSCs in the Arc-            southern Greenland. The occurrence rates of NAT enhanced
tic, the occurrence rate of good conditions for ground-based           and ice are well below 10 % and neither shows an area of pro-
lidar measurements is much lower than at the other Arctic              nounced occurrence. The distribution of wave ice in Fig. 3e
stations. In contrast, sites on Greenland and in the Canadian          shows that this composition is restricted regionally to south-
Arctic show almost no opaque clouds but – with the excep-              eastern Greenland, around Iceland, southern Svalbard, the
tion of Villum – also feature a low occurrence rate of PSCs. A         Scandinavian mountain range, and Novaya Zemlya.
similar situation though with a generally lower rate of suit-             Figure 4 provides a local quantification of the Arctic-wide
able conditions for ground-based observations is found for             display in Fig. 3 for the selected Arctic sites in Table 1 in
Alomar, Esrange, and Sodankylä. However, these sites pro-              the form of the occurrence rate of different PSC composi-

https://doi.org/10.5194/acp-21-505-2021                                                    Atmos. Chem. Phys., 21, 505–516, 2021
510                         M. Tesche et al.: Representativeness of ground-based polar stratospheric cloud observations

Figure 3. Normalised occurrence rate of CALIPSO height bins that contain (a) STS, (b) NAT mixture, (c) NAT enhanced, (d) ice, and
(e) wave ice for all-sky conditions in the Arctic.

tions as seen by a spaceborne instrument (all-sky conditions,      Fig. 3. Alert and Eureka in the Canadian Arctic and Summit,
same as in Fig. 3), a ground-based lidar with CALIPSO-             Thule, and Villum on Greenland, where the conditions for
synchronous measurement protocol operated during every             ground-based observations are best (see Fig. 2c), show lit-
single CALIPSO overpass (no or only transparent clouds are         tle difference between the spaceborne and the ground-based
present in the troposphere), and a CALIPSO-synchronously           view. Differences in PSC statistics at those sites would more
operated ground-based instrument that is affected by cloudi-       likely be related to the imperfect sampling of a ground-based
ness and other measurement-inhibiting factors (one-third of        instrument related to cloudiness and other measurement-
randomly selected CALIPSO profiles in the presence of no           inhibiting factors (ground-based scenario 2). The smallest
or only transparent clouds). For the entire Arctic, the space-     amount of observed CALIPSO PSC profiles is found for
borne view gives a smaller fraction of NAT mixture com-            Igloolik (183), Iqualuit (249), Myvatn (918), Qeqertarsuaq
pared to the ground-based view, because the regional mini-         (848), and Tiksi (326) compared to the other sites where this
mum in the occurrence rate of NAT mixture (Fig. 3b) covers         number ranges from 2080 for Esrange to 7573 for Ny Åle-
the location of most of the considered ground stations. This       sund. Consequently, PSC statistics at these sites are much
is balanced by a larger fraction of STS for the entire Arc-        more sensitive to cloudiness and further sub-sampling. A
tic compared to most ground stations. The occurrence rates         considerable difference between the spaceborne and ground-
of NAT enhanced, ice, and wave ice are marginal with a to-         based view is found in the European Arctic, particularly at
tal contribution of less then 10 % of all observed PSC height      Myvatn and Sodankylä. The occurrence rate of STS (ice) is
bins. Tropospheric cloudiness would allow for ground-based         underestimated (overestimated) at Esrange, Myvatn, and So-
observations in only about 42 % of all Arctic CALIPSO PSC          dankylä, while the opposite is found at Alomar and Ny Åle-
profiles. This causes the slight difference between the three      sund. The ratio of the number of PSC height bins represent-
bars related to Arctic-wide observations in Fig. 4.                ing the ground-based versus the spaceborne view is given in
   The localised view for 15 ground stations in the Arc-           the third column of Table 1 and allows for the ranking of the
tic reveals the impact of tropospheric cloudiness on the           ground stations with respect to the occurrence rate of suitable
statistics on PSC microphysical properties as expected from        conditions for ground-based measurements.

Atmos. Chem. Phys., 21, 505–516, 2021                                                 https://doi.org/10.5194/acp-21-505-2021
M. Tesche et al.: Representativeness of ground-based polar stratospheric cloud observations 511
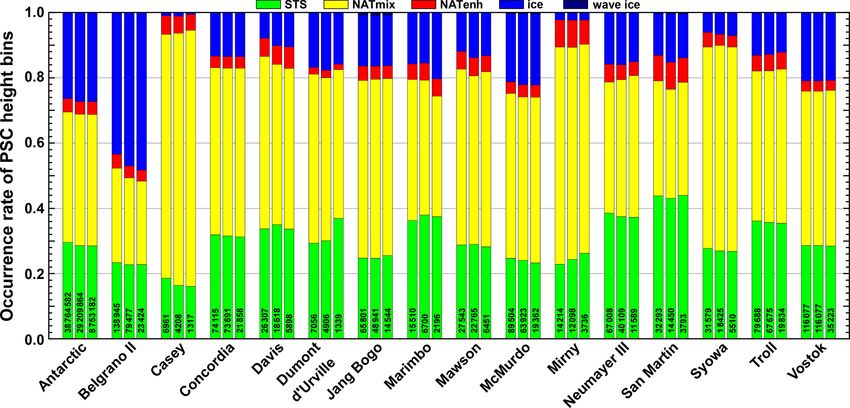
Figure 4. Occurrence rate of STS (green), NAT mixtures (yellow), NAT enhanced (red), ice (blue), and wave ice (dark blue) for the entire
Arctic as well as for the Arctic ground stations listed in Table 1. The three bars per site refer to (i) all-sky conditions in the troposphere
(the view of a spaceborne lidar, left, not possible with ground-based instruments), (ii) conditions with no tropospheric clouds or transparent
clouds only (the view of a ground-based lidar with CALIPSO-synchronous measurement protocol operated during every single CALIPSO
overpass, middle), and (iii) one-third of randomly selected profiles from observations with no tropospheric clouds or transparent clouds only
(the view of a CALIPSO-synchronously operated ground-based instrument that is affected by cloudiness and other measurement-inhibiting
factors, right). Numbers refer to the total number of considered PSC height bins per configuration.
Apart from the different effect of tropospheric cloudiness, land Ice Sheet, the elevation of the better part of Antarc-
Fig. 4 also reveals that statistics of PSC microphysical prop- tica translates into a complete absence of low-level clouds
erties can vary with location. Alert, Eureka, and Thule show – the biggest antagonist to atmospheric lidar measurements.
STS (NAT mixture) occurrence rates below (above) the Arc- Cloudiness is largest upwind from the Antarctic Peninsula.
tic mean of about 30 % (60 %), while the opposite is the case The final column in Table 1 confirms that the lowest occur-
at Alomar, Esrange, Iqaluit, Myvatn, Ny Ålesund, and Sum- rence rate of favourable conditions for ground-based lidar
mit where the occurrence rate of STS exceeds 40 % and that measurements of PSCs is found at Marimbio (43 %) and San
of NAT mixture stays below 40 %. The highest and lowest Martín (45 %), which are located on the Antarctic Peninsula.
occurrence rates of NAT enhanced are found at Igloolik and The opposite, i.e. an occurrence rate of unity, is true for Con-
Alomar, respectively. The other sites show values that are cordia and Vostok on the Antarctic Plateau.
mostly in line with the Arctic mean. Ice is most abundant The maps of the occurrence rates of different PSC com-
at Myvatn, Qeqertarsuaq, Sodankylä, and Zackenberg and positions in the Antarctic during all-sky conditions in Fig. 6
rarely observed at Alert, Alomar, Eureka, Thule, and Tiksi. show that STS and NAT enhanced are rather homogeneously
Contributions of wave ice are noticeable only at Myvatn, So- distributed. A regional minimum in the occurrence of NAT
dankylä, and Zackenberg (see Fig. 3e) and negligible at the enhanced is found over the West Antarctic Ice Sheet, the
other sites. Weddell Sea, and parts of Queen Maud Land. This is com-
pensated by higher occurrence rates of ice. As in the Arctic,
3.2 Antarctic observations wave ice occurs more locally and is restricted to the Antarctic
Peninsula and the border between the Ross Sea and Victoria
Figure 5a and b show that CALIPSO PSC profiles in the Land. Despite their layer-based approach on PSC occurrence
Antarctic are nearly equally distributed around the pole with frequency, Fig. 19 in Pitts et al. (2018) presents similar find-
a higher occurrence rate at higher latitudes. The same is ings regarding the distribution of STS, NAT, and ice.
found in the MIPAS climatology (Spang et al., 2018). Tropo- The statistics of Antarctic PSC microphysical properties
spheric cloudiness related to conditions that support ground- are shown in Fig. 7 and vary with location. There are, how-
based lidar measurements (Fig. 5c and d) is most abundant ever, two noticeable differences compared to the situation
inland, whereas the majority of Antarctic stations is located in the Arctic. Firstly, there is generally little difference in
at the coast to keep logistics manageable. As for the Green- the statistics related to the spaceborne and ground-based
https://doi.org/10.5194/acp-21-505-2021 Atmos. Chem. Phys., 21, 505–516, 2021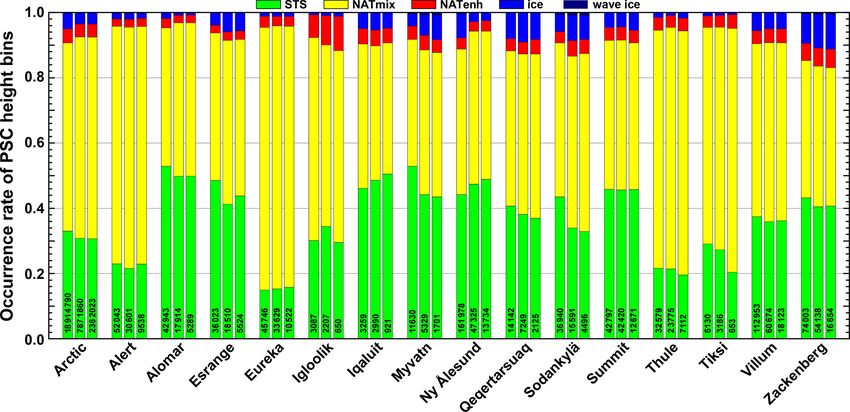
512                            M. Tesche et al.: Representativeness of ground-based polar stratospheric cloud observations

Figure 5. Same as Fig. 2 but for the Antarctic. The display in (a) is scaled to a maximum count of 2001.

view. This is because opaque clouds are less abundant in                3.3   Location assessment
the Antarctic compared to the Arctic. It is therefore more
likely to find reasonable agreement between ground-based
an spaceborne PSC observations at Antarctic stations (Snels             Figure 8 combines the information on the absolute and rel-
et al., 2019) and to observe the same long-term statistics for          ative occurrence of PSCs with the occurrence rate of tro-
Antarctic PSCs from ground and space. Secondly, sites such              pospheric conditions that support PSC observations with
as McMurdo and Vostok show statistics that resemble those               ground-based lidar. This display helps to assess the like-
obtained for the entire Antarctic. The largest occurrence rates         lihood for obtaining suitable amounts of data for studying
of STS are found at Marimbio, Neumayer III, San Martín,                 PSCs from ground-based lidar observations at the sites con-
and Troll. However, these values do not exceed those for the            sidered in this study. For the sites to the left of the dashed line
entire Antarctic by more than 10 percentage points. The low-            that marks 2000 available CALIPSO PSC profiles, the num-
est occurrence rate of STS is found at Casey with a difference          ber of PSC profiles in combination with the PSC occurrence
of also about 10 percentage points compared to the Antarctic            rate is too low to consider the establishment of a new lidar
mean. Casey is also the station with the highest occurrence             station for PSC observations. To the right of the dashed line,
rate of NAT mixture followed by Mirny. In addition, these               further separation is provided by the grey line that represent
two stations show almost no ice PSCs. The lowest rate of                a scaled PSC coverage. The most suitable stations for PSC
NAT mixture and the highest rate of ice (45 %–50 %) is found            observations from ground can be found to the right of this
at Belgrano II, as this is the only site located in the regional        line, because they combine a high PSC occurrence rate and
minimum (maximum) of the occurrence rate of NAT mixture                 a large number of identified PSC profiles with a high rate of
(ice) revealed in Fig. 6. All other sites show ice occurrence           favourable conditions for PSC observations from ground (up-
rates below the Antarctic average. Wave ice is found only at            per right corner). Of the established PSC observatories only
Jang Bogo (1 %) and McMurdo (0.5 %).                                    Concordia, Eureka, and McMurdo fall into this category. At
                                                                        Ny Ålesund, the large number of PSC profiles together with

Atmos. Chem. Phys., 21, 505–516, 2021                                                       https://doi.org/10.5194/acp-21-505-2021
M. Tesche et al.: Representativeness of ground-based polar stratospheric cloud observations 513 Figure 6. Same as Fig. 3 but for the Antarctic. Figure 7. Same as Fig. 4 but for Antarctic observations. https://doi.org/10.5194/acp-21-505-2021 Atmos. Chem. Phys., 21, 505–516, 2021
514 M. Tesche et al.: Representativeness of ground-based polar stratospheric cloud observations
4 Summary and conclusions
There is a rich literature on airborne and ground-based PSC
measurements going back to the 1980s. The thus collected
time series have been used to obtain statistics of microphys-
ical properties of PSCs in the Arctic and Antarctic. While
the impact of using different PSC classifications schemes has
been assessed in the past (Achtert and Tesche, 2014), there
has not yet been an evaluation of the comparability and the
representativeness of the available time series and statistics
of ground-based PSC observations. Here, CALIPSO lidar
observations of clouds in the troposphere and stratosphere
are used to compare statistics of PSC microphysical proper-
ties as observed (i) from space and ground and (ii) at different
ground stations. The data set shows a strong dependence of
PSC microphysical statistics on the location of a ground sta-
tion in both the Arctic and the Antarctic. In the Arctic, there
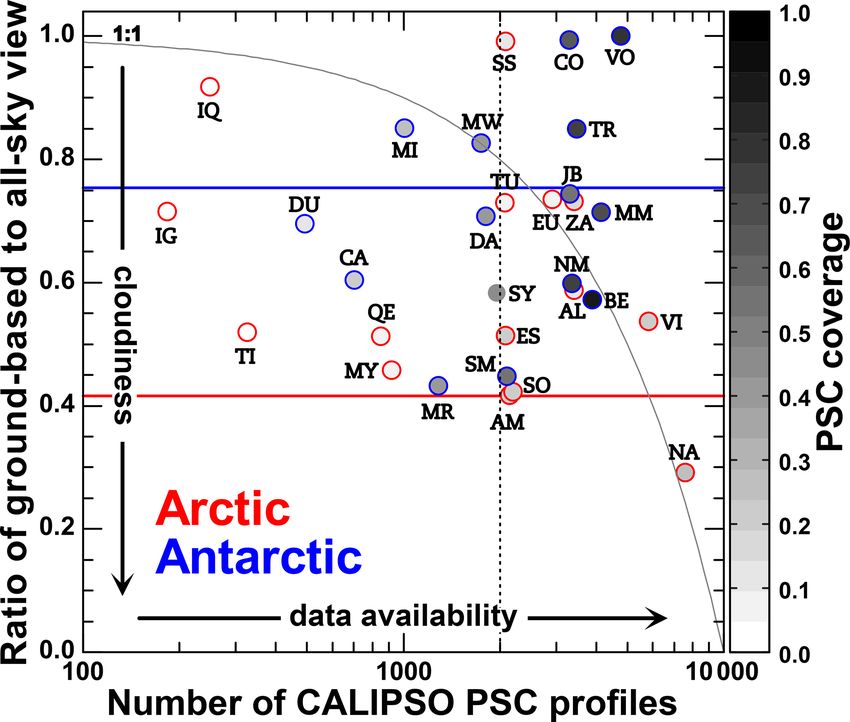
Figure 8. Number of CALIPSO PSC profiles in the 4◦ × 4◦ grid is the additional combined effect of the inhomogeneous dis-
box centred around the Arctic (red) and Antarctic (blue) ground tribution in the occurrence of both PSCs and tropospheric
stations listed in Table 1 versus the ratio of PSC height bins as ob- clouds on the representativeness of ground-based PSC ob-
served by a ground-based and a spaceborne lidar (third and sixth servations with respect to all-sky conditions.
columns in Table 1). The colour coding refers to PSC coverage (ra- The combination of the occurrence rate of PSCs and of
tio of PSC-containing profiles to all profiles) as shown in Figs. 2b suitable conditions for ground-based PSC observations al-
and 5b. Horizontal lines mark the values for the entire Arctic and lows us to assess the suitability of a ground station for long-
Antarctic, respectively. The vertical dashed line separates stations term lidar measurements of PSCs. This suitability is related
with more than 2000 CALIPSO PSC profiles from those with fewer
solely to atmospheric conditions and does not consider chal-
observations. The grey line marks a scaled PSC coverage defined as
lenges with respect to logistics, personnel, or training. Ac-
(10 000 − x)/10 000. Stations to the right of this line show a com-
bination of tropospheric cloudiness and PSC coverage that indi- cording to this definition, measurements at more suitable
cates favourable conditions for ground-based lidar measurements. sites will require less measurement effort to obtain a data set
Stations abbreviations and markings for sites with published PSC that can be used to infer statistically significant PSC data.
climatologies are given in Table 1. This knowledge is important as ground-based lidars are gen-
erally more advanced than spaceborne instruments and allow
researchers to independently retrieve backscatter and extinc-
the high PSC occurrence rate (see Fig. 2a and b, the PSC tion coefficients as well as the particle linear depolarisation
coverage of 0.29 at Ny Ålesund is the largest of all Arctic ratio at multiple wavelengths and at a better signal-to-noise
station) balances the measurement-inhibiting effect of a high ratio. Their measurements are therefore invaluable for a bet-
occurrence rate of tropospheric clouds. Note that the assess- ter understanding of processes related to PSC formation and
ment in Fig. 8 is based entirely on atmospheric conditions persistence.
and does not consider infrastructural challenges such as the Of the established PSC observatories only Concordia, Eu-
accessibility, power supply, or availability of facilities at the reka, McMurdo, and Ny Ålesund are found to fall into a
respective sites; or the training and work load of the stationed category that provides a good balance between PSC occur-
personnel. It is because of this that most of the established rence and tropospheric cloudiness. Dumont d’Urville is at
PSC observatories fall into a region that could be considered the lower end of available PSC observations, while Esrange,
less suitable for establishing a ground station for PSC obser- Sodankylä, and Syowa all show only about 1000 CALIPSO
vations. Nevertheless, the trade-off between PSC occurrence PSC profiles during conditions for ground-based measure-
and tropospheric cloudiness at those sites still creates condi- ments. The occurrence rate of PSCs in the Arctic is much
tions that allow for meaningful amounts of PSC observations, lower than in the Antarctic. Hence, the assessment presented
as witnessed by the available literature. If new PSC obser- here is particularly important for Arctic sites. Considering
vatories were to be established, the most suitable choices – only atmospheric conditions, it is found that Villum, Sum-
based solely on atmospheric conditions – would be Villum, mit, Zackenberg, Thule, and Alert would be the best choices
Summit, Zackenberg, Thule, and Alert in the Arctic and Vos- for establishing new PSC observatories with state-of-the-art
tok, Troll, Jang Bogo, Belgrano II, and Neumayer III in the lidar instruments in the Arctic. In the Antarctic, this is the
Antarctic. case for Vostok, Troll, Mawson, Jang Bogo, Belgrano II, and
Neumayer III.
Atmos. Chem. Phys., 21, 505–516, 2021 https://doi.org/10.5194/acp-21-505-2021M. Tesche et al.: Representativeness of ground-based polar stratospheric cloud observations 515
The strong dependence of PSC formation on tempera- Academic Exchange Service (DAAD), funded by the German Min-
ture suggests a crucial role of processes that enhance lo- istry of Education and Research.
cal cooling (Carslaw et al., 1998; Teitelbaum et al., 2001).
These include synoptic or mesoscale events that are gener-
ally linked to specific types of tropospheric cloudiness. It is Review statement. This paper was edited by Farahnaz Khosrawi
therefore reasonable to expect a connection between tropo- and reviewed by Vincent Noel and one anonymous referee.
spheric cloudiness and the occurrence of PSCs and maybe
even PSCs of different chemical composition. Initial stud-
ies focussing on individual winters in the Arctic (Achtert et References
al., 2012) and Antarctic (Wang et al., 2008; Adhikari et al.,
2010) show that particularly high and deep-convective cloud Achtert, P. and Tesche, M.: Assessing lidar-based classification
systems have a strong effect on PSC formation. This indi- schemes for polar stratospheric clouds based on 16 years of mea-
cates that tropospheric meteorology might be an important surements at Esrange, Sweden, J. Geophys. Res., 119, 1386–
driver for the interannual variability in PSC formation and 1405, https://doi.org/10.1002/2013JD020355, 2014.
ozone hole recovery. While CALIPSO is operational since Achtert, P., Karlsson Andersson, M., Khosrawi, F., and Gumbel,
J.: On the linkage between tropospheric and Polar Stratospheric
2006, there has not yet been a thorough assessment of the
clouds in the Arctic as observed by space–borne lidar, At-
dependence of the occurrence of different PSC composi- mos. Chem. Phys., 12, 3791–3798, https://doi.org/10.5194/acp-
tions on tropospheric cloudiness. In the future, the combined 12-3791-2012, 2012.
CALIPSO data set of clouds in the troposphere and strato- Adhikari, L., Wang, Z. and Liu, D.: Microphysical properties of
sphere presented here will be used to investigate this con- Antarctic polar stratospheric clouds and their dependence on
nection. In addition, the methodology presented here can be tropospheric cloud systems, J. Geophys. Res., 115, D00H18,
easily adapted to assess the effect of low-level clouds on tro- https://doi.org/10.1029/2009JD012125, 2010.
pospheric observations. For instance, it can be used to find Adriani, A., Massoli, P., di Donfrancesco, G., Cairo, F., Mori-
locations for measurement campaigns or long-term observa- coni, M., and Snels, M.: Climatology of polar stratospheric
tories at which the measurement-inhibiting effect of opaque clouds based on lidar observations from 1993 to 2001 over
clouds has a minimum impact on the observational cover McMurdo Station, Antarctica, J. Geophys. Res., 109, D24211,
https://doi.org/10.1029/2004JD004800, 2005.
of mid-level or high clouds and elevated tropospheric and
Blum, U., Fricke, K. H., Müller, K. P., Siebert, J., and Baumgarten,
stratospheric aerosol layers.
G.: Long-term lidar observations of polar stratospheric clouds at
Esrange in northern Sweden, Tellus B, 57, 412–422, 2005.
CALIPSO Cloud Profile data: Date were obtained from the
Data availability. CALIPSO Cloud Profile data were obtained ICARE Data and Services Center, available at: https://www.
from the ICARE Data and Services Center (https://www.icare. icare.univ-lille.fr/, last access: 8 January 2021.
univ-lille.fr/, last access: 8 January 2021, CALIPSO Cloud Profile Carslaw, K. S., Wirth, M., Tsias, A., Luo, B. P., Dornbrack, A.,
data, 2021). CALIPSO polar stratospheric cloud mask v2 data are Leutbecher, M., Volkert, H., Renger, W., Bacmeister, J. T.,
available from Michael C. Pitts upon request. Reimers, E., and Peter, T. H.: Increased stratospheric ozone de-
pletion due to mountain-induced atmospheric waves, Nature,
391, 675–678, 1998.
Author contributions. MT and PA conceived the study, developed Córdoba-Jabonero, C., Guerrero-Rascado, J. L., Toledo, D., Par-
the methodology, and analysed the data. CALIPSO polar strato- rondo, M., Yela, M., Gil, M., and Ochoa, H. A.: Depolarization
spheric cloud mask v2 data were provided by MCP. All authors ratio of polar stratospheric clouds in coastal Antarctica: compari-
contributed to the discussion of the data and the preparation of the son analysis between ground-based Micro Pulse Lidar and space-
article. borne CALIOP observations, Atmos. Meas. Tech., 6, 703–717,
https://doi.org/10.5194/amt-6-703-2013, 2013.
David, C., Bekki, S., Godin, S., Mégie, G., and Chipperfield,
Competing interests. The authors declare that they have no conflict M. P.: Polar Stratospheric Clouds climatology over Dumont
of interest. d’Urville between 1989 and 1993 and the influence of vol-
canic aerosols on their formation, J. Geophys. Res., 103, 22163–
22180, https://doi.org/10.1029/98JD01692, 1998.
Acknowledgements. We thank the CALIPSO Science Team for pro- Donovan, D. P., Fast, H., Makino, Y., Bird, J. C., Carswell, A. I.,
viding CALIPSO data for tropospheric clouds. Davies, J., Duck, T. J., Kaminski, J. W., McElroy, C. T., Mitter-
meiter, R. L., and Pal, S. R.: Ozone, column ClO, and PSC mea-
surements made at the NDSC Eureka observatory (80 N, 86 W)
during the spring of 1997, Geophys. Res. Lett., 24, 2709–2712,
Financial support. This work was supported by the Franco-
1997.
German Fellowship Programme on Climate, Energy, and Earth Sys-
Kogure, M., Nakamura, T., Ejiri, M. K., Nishiyama, T., Tomikawa,
tem Research (Make Our Planet Great Again – German Research
Y., Tsutsumi, M., Suzuki, H., Tsuda, T. T., Kawahara, T. D.,
Initiative, MOPGA-GRI, grant number 57429422) of the German
and Abo, M.: Rayleigh/Raman lidar observations of gravity
https://doi.org/10.5194/acp-21-505-2021 Atmos. Chem. Phys., 21, 505–516, 2021516 M. Tesche et al.: Representativeness of ground-based polar stratospheric cloud observations
wave activity from 15 to 70 km altitude over Syowa (69◦ S, Santecesaria, V., MacKenzie, A. R., and Stefanutti, L.: A cli-
40◦ E), the Antarctic, J. Geophys. Res.-Atmos., 122, 7869–7880, matological study of Polar Stratospheric Clouds (1989–1997)
https://doi.org/10.1002/2016JD026360, 2017. from LIDAR measurements over Dumont d’Urville (Antarc-
Langenbach, A., Baumgarten, G., Fiedler, J., Lübken, F.-J., tica), Tellus B, 53, 306–321, https://doi.org/10.1034/j.1600-
von Savigny, C., and Zalach, J.: Year-round stratospheric 0889.2001.01155.x, 2001.
aerosol backscatter ratios calculated from lidar measurements Shibata, T., Sato, K., Kobayashi, H., Yabuki, M., and Shiobara, M.:
above northern Norway, Atmos. Meas. Tech., 12, 4065–4076, Antarctic polar stratospheric clouds under temperature perturba-
https://doi.org/10.5194/amt-12-4065-2019, 2019. tion by non-orographic inertia gravity waves observed by mi-
Liu, Z., Vaughan, M., Winker, D., Kittaka, C., Getzewich, B., cropulse lidar at Syowa Station, J. Geophys. Res., 108, 4105,
Kuehn, R., Omar, A., Powell, K., Trepte, C., and Hostetler, C.: https://doi.org/10.1029/2002JD002713, 2003.
The CALIPSO lidar cloud and aerosol discrimination: Version Snels, M., Scoccione, A., Di Liberto, L., Colao, F., Pitts, M.,
2 algorithm and initial assessment of performance, J. Atmos. Poole, L., Deshler, T., Cairo, F., Cagnazzo, C., and Fierli,
Ocean. Tech., 26, 1198–1213, 2009. F.: Comparison of Antarctic polar stratospheric cloud observa-
Lowe, D. and MacKenzie, A. R.: Polar stratospheric cloud micro- tions by ground-based and space-borne lidar and relevance for
physics and chemistry, J. Atmos. Sol.-Terr. Phys., 70, 13–40, chemistry–climate models, Atmos. Chem. Phys., 19, 955–972,
https://doi.org/10.1016/j.jastp.2007.09.011, 2008. https://doi.org/10.5194/acp-19-955-2019, 2019.
Massoli, P., Maturilli, M., and Neuber, R.: Climatology of Arctic Snels, M., Colao, F., Shuli, I., Scoccione, A., De Muro, M., Pitts,
polar stratospheric clouds as measured by lidar in Ny-Ålesund, M., Poole, L., and di Liberto, L.: Quasi-coincident Observa-
Spitsbergen (79◦ N, 12◦ E), J. Geophys. Res., 111, D09206, tions of Polar Stratospheric Clouds by Ground-based Lidar and
https://doi.org/10.1029/2005JD005840, 2006. CALIOP at Concordia (Dome C, Antarctica) from 2014 to 2018,
Müller, M., Neuber, R., Beyerle, G., Kyrö, E., Kivi, R., Atmos. Chem. Phys. Discuss., https://doi.org/10.5194/acp-2020-
and Wöste, L.: Non-uniform PSC occurrence within the 972, in review, 2020.
Arctic Polar Vortex, Geophys. Res. Lett., 28, 4175–4178, Solomon, S.: Stratospheric ozone depletion: A review of concepts
https://doi.org/10.1029/2001GL013799, 2001. and history, Rev. Geophys., 37, 275–316, 1999.
Neely, R. R., Hayman, M., Stillwell, R., Thayer, J. P., Hardesty, Spang, R., Hoffmann, L., Müller, R., Grooß, J.-U., Tritscher, I.,
R. M., O’Neill, M., Shupe, M. D., and Alvarez, C.: Polarization Höpfner, M., Pitts, M., Orr, A., and Riese, M.: A climatology
Lidar at Summit, Greenland, for the Detection of Cloud Phase of polar stratospheric cloud composition between 2002 and 2012
and Particle Orientation, J. Atmos. Ocean. Tech., 30, 1635–1655, based on MIPAS/Envisat observations, Atmos. Chem. Phys., 18,
https://doi.org/10.1175/JTECH-D-12-00101.1, 2013. 5089–5113, https://doi.org/10.5194/acp-18-5089-2018, 2018.
Pitts, M. C., Poole, L. R., and Thomason, L. W.: CALIPSO polar Teitelbaum, H., Moustaoui, M., and Fromm, M.: Explor-
stratospheric cloud observations: second-generation detection al- ing polar stratospheric cloud and ozone minihole for-
gorithm and composition discrimination, Atmos. Chem. Phys., 9, mation: The primary importance of synoptic-scale flow
7577–7589, https://doi.org/10.5194/acp-9-7577-2009, 2009. perturbations, J. Geophys. Res., 106, 28173–28188,
Pitts, M. C., Poole, L. R., Lambert, A., and Thomason, L. W.: https://doi.org/10.1029/2000JD000065, 2001.
An assessment of CALIOP polar stratospheric cloud com- Wang, Z., Stephens, G., Deshler, T., Trepte, C., Parish, T.,
position classification, Atmos. Chem. Phys., 13, 2975–2988, Vane, D., Winker, D., Liu, D., and Adhikari, L.: Associa-
https://doi.org/10.5194/acp-13-2975-2013, 2013. tion of Antarctic polar stratospheric cloud formation on tro-
Pitts, M. C., Poole, L. R., and Gonzalez, R.: Polar stratospheric pospheric cloud systems, Geophys. Res. Lett., 35, L13806,
cloud climatology based on CALIPSO spaceborne lidar mea- https://doi.org/10.1029/2008GL034209, 2008.
surements from 2006 to 2017, Atmos. Chem. Phys., 18, 10881– Winker, D. M., Vaughan, M. A., Omar, A. H., Hu, Y., Pow-
10913, https://doi.org/10.5194/acp-18-10881-2018, 2018. ell, K. A., Liu, Z., Hunt, W. H., and Young, S. A.:
Overview of the CALIPSO Mission and CALIOP Data Pro-
cessing Algorithms, J. Atmos. Ocean. Tech., 26, 2310–2323,
https://doi.org/10.1175/2009JTECHA1281.1, 2009.
Atmos. Chem. Phys., 21, 505–516, 2021 https://doi.org/10.5194/acp-21-505-2021You can also read