DATING AND INTERPRETATION OF RECENT CLASTIC SEDIMENTS IN AN URBAN CAVE
←
→
Page content transcription
If your browser does not render page correctly, please read the page content below
Evan A. Hart. Dating and interpretation of recent clastic sediments in an urban cave. Journal of Cave and Karst Studies, v. 83, no. 1, p. 20-28.
DOI:10.4311/2019ES0141
DATING AND INTERPRETATION OF RECENT CLASTIC SEDIMENTS IN AN
URBAN CAVE
Evan A. Hart1
Abstract
Capshaw Cave functions as a major stormwater runoff channel for the city of Cookeville, Tennessee, receiving inputs
from several large sinkholes. Sediments deposited in the cave reflect the history of erosion and runoff from the city as
it grew over the last century. At various locations in the cave, 1 m thick sequences of flood-deposited, laminated fine
sediments were observed along the modern stream. Alternating laminations observed in the upper 40 cm of the sed-
iment profile varied between 0.5 cm thick (10Y 7/6 yellow, fine sand) and 2.0 cm thick (10Y 3/2 very dark grayish brown
silty sand) layers. Based on measurements of 137Cs activity, the upper 35 cm of sediment was deposited between 1963
(the peak year of 137Cs fallout from nuclear testing) and 2013 (the year samples were collected), at an average rate of
0.7 cm y1. A total of 23 alternating pairs of layers indicate an average flood recurrence interval of 2.2 years between
1963 and 2013. Total Pb concentrations measured in cave sediments showed a peak at the 45 cm depth, suggesting
that sediments above this level were deposited after the decline in Pb emissions in the 1970s, and showing general
agreement with the timing of deposition suggested by 137Cs. Below 40 cm, the dark silty sand layers were fewer in
number and increased in thickness (up to 10 cm), possibly due to changes in cave hydrology or sediment erosion from
the surrounding watershed. These findings suggest that, before the 1960s, sedimentation rates were higher and floods
were less frequent. After the 1960s, sedimentation rates decreased and floods became more common, probably as a
result of urbanization in the watershed.
INTRODUCTION
Cave deposits are important paleo-environmental records and include 1) chemical deposits (speleothems); 2) clastic
sediments (fine-grained infill); 3) breakdown (Bosch and White, 2004); and 4) biologic accumulations (e.g., bat guano)
(Onac et al., 2015). The potential of speleothems as paleo-environmental records is well-established (Spötl and Mangi-
ni 2002; Drysdale et al., 2006; Meyer et al., 2008; Asmerom et al., 2010; Boch et al., 2011; Badertscher et al., 2014), also
see excellent reviews in McDermott (2004), Sasowsky and Mylroie (2007), and White (2007). However, clastic cave
sediments have received less attention in the scientific literature and their potential as paleo-environmental proxies
remains under-utilized. Clastic cave sediments may be derived from external (allogenic) sources or may originate from
within the cave itself (autogenic). The protected environment inside caves may preserve intact sequences of clastic
sediment, which are not typically well-preserved outside caves, for example on floodplains. Some caves contain clas-
tic sediment sequences deposited by main valley rivers that overflow into them or simply by cave streams that bring
sediment through the karst system. Clastic cave sediments have been dated using cosmogenic isotopes and paleo-
magnetism to estimate long-term river incision rates (Sasowsky et al., 1995, Granger et al., 2001, Stock et al., 2004).
Estimating river incision rates is usually done by dating sediments found in caves along valley walls some height above
the modern stream level, and then comparing the age of these sediments to younger sediments preserved in caves at
lower elevations.
Studies of more recent clastic sediments have sought to better understand sediment transport in caves and to iden-
tify allogenic sediment pollution sources (Mahler et. al 1998; Mahler and Lynch, 1999; Modrá et al., 2017). Dogwiler and
Wicks (2004) estimated that up to 85 % of stream substrates in some Missouri and Kentucky caves can be transported
during flows having relatively short return periods (1 year). Other work has focused on the lithology, grain size, and
roundness of clastic sediments in caves and related these to sediment provenance (Bull, 1978, 1981; Brinkman and
Reeder, 1995). Gillieson (1986) showed that clastic sediments formed diamictons in some New Guinea caves, and that
these sediments originated as debris flows from allogenic source areas.
Paleoclimate and paleoenvironmental studies have successfully applied several dating methods to cave sediments
including U-Th dating of speleothems (Thompson et al., 1976), paleomagnetism of clastic sediments (Sasowsky et al.,
1995), magnetic susceptibility (Šroubek et al., 2001; Šroubek et al., 2007), cosmogenic isotope analysis of cave gravels
(Stock, et al., 2004), OSL (optically stimulated luminescence) (Clark-Balzan, et al., 2012), 14C (Surić, et al., 2016), as well
as pollen and 13C analysis of organic material extracted from bat guano (Onac et al., 2015). For younger cave sediments
deposited over the last few centuries, a suite of other dating methods were tested. Feist (2017) used the isotope 210Pb
to date recent (100 years) sediments contaminated with heavy metals in Hidden River Cave, Kentucky. Very recent
sedimentation (two to three months) in caves has been traced using 7Be (Broderick et al., 2017).
1
Department of Earth Sciences, Tennessee Tech University, Cookeville, TN 38505; ehart@tntech.edu
20 • Journal of Cave and Karst Studies, March 2021
Hart

    The fallout nuclide 137Cs, generated by atomic testing in the mid-1900s, has been used to date cave sediments
deposited since that period (Stanton et al., 1992; Klimchouk and Gudzenko, 1996; Curry, 2003). Cesium-137 is a radio-
active isotope and fission byproduct, having a half-life of 30.17 years (Poreba, 2006). Atomic testing beginning in the
1950s released radioactive 137Cs into the atmosphere around the globe (Walling and He, 1999). The resulting fallout
of 137Cs was incorporated into surface soils and water bodies throughout most of the world, reaching a peak in 1963
(Zhang, et al., 2016). Cesium-137 has been used widely to date lake sediments by assuming that the peak 137Cs activity
in a lake sediment core is equivalent to the year 1963, the peak year of atomic testing.
    In the United States, Pb emissions, mostly from leaded gasoline vehicles, reached a peak in the 1970s and declined
after being phased out of use (USEPA, 2000). The peak and decline of Pb emissions can be seen in Pb concentrations
measured in lake sediments (Callender and Van Metre, 1997; Juracek and Ziegler, 2006). In this study, 137Cs and total
Pb are used to investigate the timing of flood-deposited sediments in an urban cave system. Whatever method is used
to date cave sediments, care should be taken to assure that site-specific conditions are consistent with the assumptions
of the technique. For example, Schiegl et al. (1996) found that waterlogging may lead to significant chemical alteration
of cave sediments, making dating and interpretation problematic.
STUDY AREA
   The study area is located on the East Highland Rim, a low plateau (280−340 m.a.s.l.) located west of the Cumber-
land Plateau escarpment in central Tennessee (Fig. 1, inset), and underlain by carbonate and siliclastic rocks of Mis-
sissippian age. That portion of the Highland Rim underlain by the St. Louis limestone typically forms a well-developed

Figure 1. Map of Capshaw Cave showing sampling location S-4. Other sites with similar deposits are shown but were not sampled. The
East Highland Rim, Tennessee (inset).

sinkhole plain, mantled with residual, clay-rich soils, and crossed by only a few surface streams. However, areas un-
derlain by the siliclastic-carbonate Warsaw unit support a fluviokarst drainage network, with numerous sinking streams
and resurgences. This study focuses on the stream in Capshaw Cave within the city limits of Cookeville, Tennessee
(Fig. 1). The cave is formed in the middle portion of the Warsaw unit, has a 6.6 km total surveyed length, and consists
of a borehole-type passage with diameters ranging from 4 m to 7 m. Capshaw Cave ends in the downstream direction
at a sump and apparent cave constriction. Dye tracing at the sump in Capshaw Cave showed a direct connection to
a resurgent spring about 0.5 km downstream. The sump and the resurgence were also recently connected by a suc-
cessful cave dive, which revealed that the cave constricts to a height of approximately 1.5 m at a point just downstream
from the sump.
   The watershed contributing to Capshaw Cave covers an area of approximately 8 km2 and was originally covered
with hardwood forest before European settlement. After 1800, cropland and pasture began to replace forest cover. The
population of Cookeville grew from 1848 in 1910 to 23,923 by 2000, which growth changed the watershed by increasing
peak runoff from roads and parking lots, as well as introducing contaminants from roads and industry. A coal-burning
powerplant was built in the watershed in 1929 and remained in operation until 2017. The Capshaw Cave watershed
consists of approximately 39 percent impervious surfaces and thus has very flashy lag times, generally less than
one hour, resulting in cave-filling floods (Hart, 2006). The cave is directly connected to the overlying watershed by
a series of large swallets, some with conduit openings through which large amounts of sediment move into the cave
during floods (Fig. 2) (Hart and Schurger, 2005). Capshaw Cave serves as the de-facto stormwater drain for the city of
Cookeville, thus trash and debris from the city is commonly found in the cave.

                                                                        Journal of Cave and Karst Studies, March 2021 • 21
Hart

                                                                                                   Piles of fine sediment ap-
                                                                                               proximately 1 m above the
                                                                                               modern stream are found in at
                                                                                               least six locations in Capshaw
                                                                                               Cave, mostly in protected bed-
                                                                                               rock alcoves (Fig. 3), the loca-
                                                                                               tions of which are indicated in
                                                                                               Figure 1. Each time after vis-
                                                                                               iting Capshaw Cave between
                                                                                               flooding events, it was noticed
                                                                                               that a layer of light-colored
                                                                                               sand was deposited on top of
                                                                                               a darker, more fine-grained
                                                                                               layer at all sites shown on
                                                                                               Figure 1. This alternation be-
                                                                                               tween dark- and light-colored
                                                                                               layers appeared to continue
                                                                                               down into the profile. Our aim
                                                                                               was to sample sediments at
                                                                                               one of these sites to better un-
                                                                                               derstand the timing of depo-
                                                                                               sition as it relates to flooding
                                                                                               in the cave. One of these six
                                                                                               locations (site S-4, shown in
                                                                                               Fig. 1 and Fig. 2), with espe-
                                                                                               cially good preservation of
                                                                                               laminations, and a deep pro-
                                                                                               file (140 cm), was chosen for
                                                                                               detailed study.
                                                                                               METHODS
                                                                                                     Samples were collected
                                                                                                 from site S-4 by excavat-
                                                                                                 ing a fresh surface vertical-
                                                                                                 ly through the deposit to a
                                                                                                 depth of approximately 1.4 m,
                                                                                                 at which point channel grav-
                                                                                                 el was encountered. Plastic
                                                                                                 sample boxes were inserted
                                                                                                 horizontally into the sediment
                                                                                                 profile and removed carefully
                                                                                                 to preserve the laminations.
                                                                                                 In the lab, we attempted to
Figure 2. Aerial photograph of Cookeville, TN in 2017 showing location of Capshaw Cave and major separate the light and dark
swallets that drain into the cave. Cave stream runs from north to south, with sump at south end. laminations to test these inde-
Sampling location S-4 shown.                                                                     pendently for particle size dis-
                                                                                                 tribution, however, most of the
laminations were too thin to be collected separately without mixing. It was possible to sample individually three of the
thicker layers making a total of six (three light layers and three dark layers) at depths of 15 cm, 38 cm, and 86 cm. Mixed
samples of both light and dark layers were also collected. For all samples, particle size distribution was determined by
hydrometer analysis (Ashworth et al., 2001).
    To establish the timing of the cave sediment deposition, additional box samples were collected directly from the
sediment profile in 10 cm sections for chemical analysis. These samples were shipped to Flett Research Ltd, Labo-
ratory, Winnipeg, Canada where 137Cs activity was measured at each section mid-point (5 cm, 15 cm, etc.) by gamma
spectrometry using high purity germanium detectors. Additional samples from site S-4 were also collected at 10 cm
intervals (midpoints at 5 cm, 15 cm, etc.) and tested for total elemental Pb concentration at the Tennessee Tech Univer-

22 • Journal of Cave and Karst Studies, March 2021
Hart
sity Water Center using inductively coupled plas-
ma atomic emission spectroscopy (USEPA, 1994).
Total Pb concentration in lake sediments has been
shown to track closely with the rise and fall of lead-
ed gasoline use in the United States (Juracek and
Ziegler, 2006). To shed light on the timing of cave
sediment deposition, Pb concentrations measured
in cave sediments in this study were compared to
Pb emissions data from the 1900s, for which the
timing is well-established. Recent sedimentation
in the cave was measured by driving rebar pins
vertically downward into the sediment and left for
a period of two years. After flood events, the rebar
stakes were checked to estimate the amount of
deposition or re-working.
RESULTS AND DISCUSSION
Figure 3. View of Capshaw Cave main passage showing cave stream and
location of flood-deposited sediments to the right of stream channel. Photo Character of the Sediment
taken near site S-6 in Figure 1. The alternating light and dark colored lamina-
tions at site S-4 have Munsell colors of 10Y 7/6 (yellow) and 10
Y 3/3 (very dark grayish-brown), respectively, and these colors
are consistent throughout the deposit (Fig. 4). There is evidence
of cross bedding and termination of layers, suggesting a complex
depositional history and at least some degree of re-working of sed-
iments. The rebar stake measurement at site S-4 indicated that
approximately 0.6 cm of vertical accretion occurred between 2013
and 2015 (0.3 cm y1), but this was likely too short of a period to
capture long-term trends.
A total of 23 alternating laminations in the upper 40 cm of the
profile vary in thickness from 0.5 cm to 2.0 cm and alternate in
dominant particle size between fine sand (yellow) and silty sand
(very dark grayish-brown). The median particle size diameter for
the fine sand samples is 0.2 mm and 0.08 mm for the silty sand (Fig.
5). Between 40 cm and 80 cm, silty sand layers increase in thick-
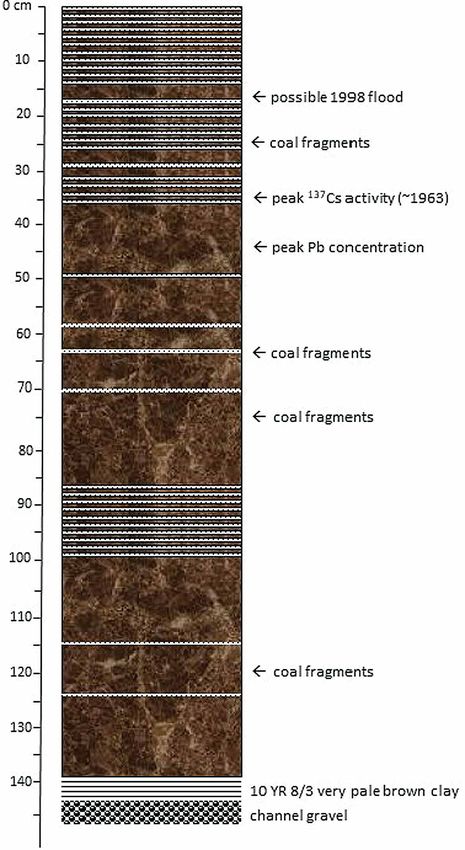
Figure 4. Sediment exposure at site S-4 in Capshaw
Cave, showing alternating layers of fine sand (yellow) Figure 5. Plot of grain size frequency distribution for fine sand (yellow) and
and silty sand (very dark grayish brown). Fine sand layers silty sand (very dark grayish brown) for cave sediment samples at site S-4.
have average thickness of 0.5 cm in the upper 40 cm of Three separate samples were collected from fine sand and silty sand layers at
the profile. Below 40 cm, silty sand layers increase to 5 depths of 15 cm, 38 cm, and 86 cm. Data plotted are averages of these three
to 10 cm in thickness and are separated by only a few samples taken from each dark and light layer that was sampled. The median
fine sand stringers. Only ~80 cm of the entire 140 cm of particle size diameter varied from 0.2 mm for fine sand to 0.08 mm for silty
sediment at this site is shown here. See Figure 5 for entire sand. The theoretical settling velocities for fine sand (2.0 cm s−1) are 40 times
stratigraphic column of site S-4. greater than for silty sand (0.05 cm s−1).
Journal of Cave and Karst Studies, March 2021 • 23Hart
ness (5 cm to 10 cm) and are separated by only four
(0.5 cm) fine sand stringers (Fig. 6). This change
in layer thickness may reflect changes in cave hy-
drology or changes in sediment availability within
the cave, possibly associated with land use chang-
es in the watershed. Between depths of 85 cm and
100 cm, another set of approximately 10 fine sand
stringers occur in close succession. From 100 cm
to 140 cm, the pattern again changes and the dark
silty-sand layers increase in thickness and are sep-
arated by only four thin, fine sand layers. Finally, at
a depth of 140 cm a firm 2.5 Y 8/3 (pale yellow) clay
overlies channel gravels.
SEDIMENTATION RATES AND FLOOD
FREQUENCY
Cesium-137 activity in the Capshaw Cave sed-
iments shows a defined spike at approximately 35
cm depth and a steep decline below that point (Fig.
7A and Table 1). This pattern is consistent with 137Cs
activity measured in lake sediments across North
America (Callender and Van Metre, 1997), and in
other areas, and matches the peak atomic testing
year of 1963. If this is the case, then the upper 35
cm of sediments were deposited after 1963, at a
minimum rate of 0.7 cm y1. Background 137Cs ac-
tivity was reached at the 45 cm measurement, and
so no further 137Cs measurements were made on
sediments below that level.
Total Pb concentrations from the Capshaw Cave
sediments show an obvious spike at 0.15 mg kg1
between 40 cm and 50 cm (Fig. 7B). All values for
Pb concentrations reported here are below USEPA
(1997) threshold level for possible adverse biologi-
cal effects (30.2 mg kg1). The entire total Pb curve
matches well with the Pb emissions curve, which
has a peak at around 1970 (USEPA, 2000) (Fig.
7C). This match between Pb concentration in the
cave sediments and Pb emissions suggests that
sediments can be dated based on the Pb emission
curve. The timing of deposition suggested by Pb
concentration tracks closely with the timing indicat-
ed by 137Cs activity in the same sediments (Fig. 7A
and 7B).
Figure 6. Generalized stratigraphic column for site S-4. Dark pattern shows
10Y 3/3 (very dark grayish brown) silty sand and light stippled pattern If each silty sand-fine sand sequence represents
shows layers of 10Y 7/6 (yellow) fine sand. Cross bedding and truncation one flood event, then approximately 23 flood events
of some layers does occur. Sediments above 35 cm were deposited after are recorded in the upper 35 cm to 40 cm of sed-
the 1963 137Cs peak fallout. Coal fragments found throughout the deposit
come from anthropogenic sources that became abundant after 1900. We
iments in Capshaw Cave. If the upper 40 cm was
interpret the 0 cm to 40 cm section to have more frequent flood events (note deposited between 1963 (the peak 137Cs fallout) and
the many fine sand layers) and a lower sedimentation rate, both of which 2013 (the sampling year), this would compute to a
may result from urbanization. A 2 cm thick silty sand layer at 15 cm depth flood return interval of 2.2 years for cave-filling flood
may represent an extreme flood event in 1998 that is known from the local
area. From 40 cm to 140 cm, floods appear less common and fine sand lay-
events. Between 40 cm and 85 cm, only 4 fine sand
ers are missing. This pre-urban period likely had fewer cave-filling floods, stringers are found, suggesting that cave floods
but a greater rate of sedimentation, perhaps due to erosion from gullied may have been less common before the 1960s;
farmland. Photo in Figure 4 shows the same site, but only down to ~80 cm.
24 • Journal of Cave and Karst Studies, March 2021Hart
however, be-
tween 86 cm and
100 cm depth 10
fine sand layers
are observed, in-
dicating a short
interval of more
frequent floods
(Fig. 6). There is
no control on dat-
ing of sediments
at this depth, so
an approximate
flood return inter-
val cannot be cal-
culated for these
layers.
Figure 7. (A) Activity level of the fallout radionuclide 137Cs in the Capshaw Cave sediment profile S-4. Measure-
Sand-sized
ments were made every 10 cm beginning at 5 cm. Cesium-137 units are disintegrations per minute per gram (DPM
g−1). The peak of atomic testing that released 137Cs into the atmosphere occurred in 1963 and is shown to occur at coal fragments
approximately 35 cm in this profile. Background 137Cs activity was reached at a depth of 45 cm, and thus no further are found through-
samples were tested below that depth. (B) Total Pb concentration measured in sediments at site S-4, at 10 cm in- out the Capshaw
tervals beginning with 5 cm depth. (C) Total Pb emissions from all sources 1900 to 2000. Data after 1970 are from
USEPA (2000) and data before 1970 are from Callender and Van Metre (1997).
sediment profile
S-4. Under mag-
Table 1. Data from 137Cs measurements, Flett Research Ltd, Laboratory, Winnipeg, Canada where 137Cs activity was measured
at each section mid-point (5 cm, 15 cm, etc.) by gamma spectrometry using high purity germanium detectors. DPM is
disintegrations per minute. 137Cs activity is plotted on Figure 7A.
Sample depth Dry ample Sample Count time Gammas 137
Cs Activity Error DPM
(cm) weight (g) thickness (mm) (sec) (min−1 g−1) (DPM g−1 dry weight) (g−1)
5 7.837 2.475 240000 0.112571 0.132436 0.043704
15 12.154 2.8 240000 0.028879 0.033975 0.064636
25 5.996 1.575 240000 0.139525 0.164146 0.062376
35 6.949 1.9 240000 0.338068 0.397726 0.091082
45 9.065 2.425 240000 0.004679 0.005505 0.085876
inifcation, coal fragments can be easily distinguished from quartz grains that make up most of the cave sediments. Coal
does not occur naturally in this watershed and its likely source is a coal-burning power plant that was in operation between
1929 and 2016. When in operation, a large pile of coal sat in the open on the plant parking lot, located 1.5 km upstream from
a swallet that feeds the cave. A small channelized stream runs behind the plant and leads directly to the swallet. Another
source for coal could have heating of private homes, however, this source may not have produced a large enough volume of
coal that would later be preserved in cave sediments. In either case, the presence of coal in the watershed does not extend
back any earlier than approximately 1900, and so the presence of coal in cave sediments shows that deposition occurred
sometime after 1900.
To summarize, 137Cs activity indicates that the upper 35 cm of sediment was deposited after the decade of the
1960s, at an approximate rate of 0.7 cm y1. These sediments were likely deposited during floods with recurrence in-
terval of approximately two years, assuming each flood layer represents one flood event. It is possible that sediments
receiving 137Cs fallout outside the cave, were then temporarily stored (in sinkholes, for example) before arriving in the
cave at their present locations. However, the year 1963 marks the earliest possible period of deposition for sediments
at the 35 cm depth. The total Pb concentration measured in cave sediments at site S-4 provides good agreement that
the upper 35 cm to 40 cm was deposited since the 1960s or 1970s. Finally, based on the presence of coal fragments,
the entire sequence of sediments at site S-4 was likely deposited after 1900. If this timing is true, then deposition of
sediment between 140 cm and 40 cm occurred at a rate no slower than 1.6 cm y1, which is more than twice the rate
from 1963 to 2013 according to 137Cs activity (0.7 cm y1).
Journal of Cave and Karst Studies, March 2021 • 25Hart
INTERPRETATION OF FLOOD EVENTS FROM SEDIMENT LAYERS
The median particle diameters for the fine sand (0.2 mm) and silty sand (0.08 mm) layers (Fig. 5) correspond to
an approximate settling velocity of 2.0 cm s1 for the fine sand and 0.05 cm s1 for the silty sand, a 40-fold difference.
These velocities indicate that fine sand and silty sand layers are deposited at different flood stages. The exact se-
quence of deposition is difficult to interpret without acquiring additional data, for example, direct measurement of water
velocity during floods and cave passage geometry would be helpful. While a fining-upward sequence is thought to be
typical in many flood deposits, observations in Capshaw Cave suggest another scenario. Evidence comes from the
simple observation that fine sand layers are always found on top of the sediment banks in Capshaw Cave after a flood,
indicating that it must be the last material deposited in a flood (for example, see the fine sand on the surface of Site-4
in Fig. 4). Based on these results, there is possibly more than one explanation for the nature of laminated sediments in
Capshaw Cave.
As water rises in the cave from runoff, velocities increase quickly, and some re-working of sediment may occur. This
re-working may be the cause of the cross bedding seen in some layers in Fig. 4. As the flood progresses, the rate of
flow into the cave exceeds the discharge leaving the cave, due to the narrow downstream constriction below the sump.
The constriction creates a damming effect and water is temporarily ponded in the cave, causing it to leave behind
flotsam plastered on the cave ceiling that is regularly observed after floods. During these times of ponding and lower
velocity, the finer silty sand is likely deposited. As the cave drains, velocities increase again and the fine sand is left
behind, often as very thin stringers that may only partially cover the dark silty sand.
The above interpretation is speculative, but perhaps represents the best understanding of these particular cave
sediments, and only applies to floods that fill the entire cave. Smaller floods that never reach pipe-full conditions would
not necessarily have the same sequence of deposition. These smaller floods may also re-work some of the lower sedi-
ments, distorting the overall interpretation. Thus, due to the fact that the cave fills to different heights depending on flood
volume, the assumption that each sequence of fine sand/silty sand layers represents one flood event may not be valid.
It is possible that some layers are the result of multiple events. The fact that the dark, silty sand units are thicker below
40 cm may be the result of different cave hydraulics that existed previously, for example, a tighter constriction below the
sump could cause ponding in the cave to last longer. However, it seems unlikely that the 5 cm to 10 cm thick silty sand
layers like those seen below 40 cm in Figure 6 each represent one flood event. It may be that several flood events are
represented in one of these thick silty sand layers, and the fine sand is missing either because it was reworked or was
not available to be deposited at that time.
CONCLUSIONS
Laminated sediments found in Capshaw Cave have two distinct mean particle size populations that indicate depo-
sition at different velocities. Truncated beds and cross bedding indicate that re-working of sediments does occur in the
cave, however, the amount of re-working must be minor since the regular pattern of laminations is preserved (Fig. 4).
Cesium-137 activity measured in the sediments shows a general trend of gradual vertical accretion at a rate of approx-
imately 0.7 cm y1 from 1963 to 2013. The concentration of total Pb in the cave sediments tracks with the rise and fall
of Pb emissions in the United States and corresponds generally to the timing of deposition indicated by 137Cs activity.
If each of the 23 fine sand/silty sand sequences between 0 cm and 40 cm represents one flood event, this equates to
an average flood return interval of 2.2 years. In the section from 40 cm to 80 cm, only 4 fine sand layers are found
between 5 cm to 10 cm beds of silty sand. This finding suggests that flooding was less frequent before the 1960s and
has increased with the growth of urbanization. Changes in cave hydrology that affect the drainage rate of the cave could
also have changed over this period. In addition, re-working of sediment and sediment availability may challenge the
assumption that each layer was deposited by a separate flood event. Anthropogenic coal fragments found throughout
the entire depth of the deposit at site S-4 show that these sediments were deposited after coal burning became com-
mon in the watershed, about 1900 based on historical records. The rate of sedimentation in Capshaw Cave appears
to have declined after the 1960s, at the same time that cave floods became more common (Fig. 6). This could be the
result of urban growth after the 1960s, which led to more runoff and flooding and less sediment erosion, as agricultural
fields were replaced by pavement. Pre-1960s land use was primarily agriculture and early air photos (1939) show a
landscape scarred by gullies, capable of producing large volumes of sediment. More detailed sedimentological analysis
of sediments and more precise dating methods (e.g., 7Be) could aid in better understanding the nature of recent cave
sediment deposition.
ACKNOWLEDGMENTS
Many thanks to John Pegram, Clinton Elmore, Annabelle Dempsey, Luke Hornby, and Chuck Sutherland for help in
sample collection and photography. Photo in Figure 3 by Chuck Sutherland; photo in Figure 4 by Clinton Elmore.
26 • Journal of Cave and Karst Studies, March 2021Hart
REFERENCES
Ashworth, J., Keyes, D., Kirk, R., and Lessard, R., 2001, Standard procedure in the hydrometer method for particle size analysis: Communica-
tions in Soil Science and Plant Analysis, v. 32, no. 5-6, p. 633–642. https://doi.org/10.1081/CSS-100103897
Asmerom, Y., Polyak, V.J., and Burns, S.J., 2010, Variable winter moisture in the southwestern United States linked to rapid glacial climate
shifts: Nature Geoscience, v. 3, no. 2, p. 114–117. https://doi.org/10.1038/ngeo754
Badertscher, S., Borsato, A., Frisia, S., Cheng, H., Edwards, R.L., Tüysüz, O., and Fleitmann, D, 2014, Speleothems as sensitive recorders of
volcanic eruptions–the Bronze Age Minoan eruption recorded in a stalagmite from Turkey: Earth and Planetary Science Letters, v. 392, p.
58–66. https://doi.org/10.1016/j.epsl.2014.01.041
Boch R., Cheng H., Spötl C., Edwards R.L., Wang X., and Häuselmann P., 2011, NALPS: a precisely dated European climate record 120-60 ka:
Climate of the Past, v. 7, p. 1247–1259. https://doi.org/10.5194/cp-7-1247-2011
Bosch, R.F., and White, W.B., 2007, Lithofacies and transport of clastic sediments in karstic aquifers: in Sasowsky, I. and Mylroie, eds., Studies
of Cave Sediments, Physical and Chemical Records of Paleoclimate, The Netherlands, Springer, p. 1–22. https://doi.org/10.1007/978-1-4020-
5766-3_1
Brinkmann, R. and Reeder P., 1995, The relationship between surface soils and cave sediments: an example from west central Florida, USA:
Cave and Karst Science, v. 22, no. 3, p. 95–102.
Broderick C.A., Wicks C.M., and Paylor R.L., 2017, Testing the effectiveness of Beryllium-7 as a tracer of the movement of sediment over short
periods along a cave stream in Hidden River Cave, Kentucky U.S.A: Journal of Cave and Karst Studies, v. 79, no. 2, p. 84–88. https://doi.
org/10.4311/2016ES0115
Bull, P.A., 1978, A study of stream gravels from a cave: Agen Allwedd, South Wales, Zietschrift für Geomorphologie, v. 22, no. 3, p. 275–296.
Bull, P.A., 1981, Some fine-grained sedimentation phenomena in caves, Earth Surface Processes and Landforms, v. 6, p. 11–22. https://doi.
org/10.1002/esp.3290060103
Callender, E., and Van Metre, P.C., 1997, Reservoir sediment cores show U.S. lead declines: Environmental Science & Technology, v. 31, p.
424A–428A. https://doi.org/10.1021/es972473k
Clark-Balzan, L.A., Candy, I., Schwenninger, J. L., Bouzouggar, A., Blockley, S., Nathan, R., and Barton, R.N.E., 2012, Coupled U-series and
OSL dating of a Late Pleistocene cave sediment sequence, Morocco, North Africa: significance for constructing Palaeolithic chronologies:
Quaternary Geochronology, v. 12, p. 53–64. https://doi.org/10.1016/j.quageo.2012.06.006
Curry, W., 2003, Using cesium-137 to understand recent in cave sedimentation in the Tongass National Forest, Southeast Alaska [M.S. Thesis]:
Bowling Green, Western Kentucky University, 94 p.
Dogwiler, T., and Wicks, C.M., 2004, Sediment entrainment and transport in fluviokarst systems: Journal of Hydrology, v. 2951, p. 163–172.
https://doi.org/10.1016/j.jhydrol.2004.03.002
Drysdale, R., Zanchetta, G., Hellstrom, J., Maas, R., Fallick, A., Pickett, M., Cartwright I., and Piccini, L., 2006, Late Holocene drought respon-
sible for the collapse of Old World civilizations is recorded in an Italian cave flowstone: Geology, v. 342, p. 101–104. https://doi.org/10.1130/
G22103.1
Feist, S.K., 2017, Investigation of sediment pathways in Hidden River Cave, Kentucky, [Ph.D. Thesis]: Hamilton, Ontario, McMaster University,
69 p. https://doi.org/10.1130/abs/2016NC-275204
Gillieson, D., 1986, Cave sedimentation in the New Guinea highlands: Earth Surface Processes and Landforms, v. 11, p. 533–543. https://doi.
org/10.1002/esp.3290110508
Granger, D.E., Fabel, D., and Palmer, A.N., 2001, Pliocene−Pleistocene incision of the Green River, Kentucky, determined from radioactive
decay of cosmogenic 26Al and 10Be in Mammoth Cave sediments: Geological Society of America Bulletin, v. 1137, p. 825–836. https://doi.
org/10.1130/0016-7606(2001)1132.0.CO;2
Hart, E.A., 2006, Land use change and sinkhole flooding in Cookeville, Tennessee: Southeastern Geographer, v. 46, p. 35–50. https://doi.
org/10.1353/sgo.2006.0006
Hart, E.A., and Schurger, S.G., 2005, Sediment storage and yield in an urbanized karst aquifer: Geomorphology, v. 70, p. 85–96. https://doi.
org/10.1016/j.geomorph.2005.04.002
Juracek, K.E., and Ziegler, A.C., 2006, The legacy of leaded gasoline in bottom sediment of small rural reservoirs: Journal of Environmental
Quality, v. 356, p. 2092–2102. https://doi.org/10.2134/jeq2006.0128
Klimchouk, A.B., and Gudzenko, V.V., 1996, Chernobyl radiocaesium in a karst system, Marble Cave, Crimea: Environmental Geology, v. 283, p.
161–166. https://doi.org/10.1007/s002540050089
Mahler, B.J., Bennett, P.C., and Zimmerman, M., 1998, Lanthanide-labeled clay: a new method for tracing sediment transport in karst: Ground
Water, v. 36, no. 5, p. 835–843. https://doi.org/10.1111/j.1745-6584.1998.tb02202.x
Mahler, B.J., and Lynch, F.L., 1999, Muddy waters: temporal variation in sediment discharging from a karst spring: Journal of Hydrology, v. 214,
p. 165–178. https://doi.org/10.1016/S0022-1694(98)00287-X
McDermott, F., 2004, Palaeo-climate reconstruction from stable isotope variations in speleothems: a review: Quaternary Science Reviews, v.
237, p. 901–918. https://doi.org/10.1016/j.quascirev.2003.06.021
Meyer, M., Spötl, C., and Mangini, A., 2008, The demise of the Last Interglacial recorded in isotopically dated speleothems from the Alps: Qua-
ternary Science Reviews, v. 27, p. 476–496. https://doi.org/10.1016/j.quascirev.2007.11.005
Modrá, H., Gruberová, E., Konečný, O., Ulmann, V., Kaucká, P., Vlková, M., Tůma, A., Halešová, T., Kudělka, J., Geršl, M., and Pavlík, I., 2017,
Influx and concentration of triazine pesticides in the Amaterska cave system, Moravian Karst, Czech Republic: Journal of Soils and Sedi-
ments, v. 18, no. 2, p. 640–647. https://doi.org/10.1007/s11368-017-1831-0
Onac, B.P., Hutchinson, S.M., Geantă, A., Forray, F., Wynn, J., Giurgiu, A., and Coroiu, I., 2015, A 2500-y late Holocene multi-proxy record of
vegetation and hydrologic changes from a cave guano- clay sequence in SW Romania: Quaternary Research, v. 83, p. 437–48. https://doi.
org/10.1016/j.yqres.2015.01.007
Poreba, G.J., 2006, Caesium-137 as a soil erosion tracer: a review: Geochronometria, v. 25, p.37–46.
Sasowsky, I.D., and Mylroie, J., 2007, Studies of Cave Sediments, Physical and Chemical Records of Paleoclimate: The Netherlands, Springer,
329 p. https://doi.org/10.1007/978-1-4020-5766-3
Sasowsky, I.D., White, W.B., and Schmidt, V.A., 1995, Determination of stream-incision rate in the Appalachian plateaus by using cave-sediment
magnetostratigraphy: Geology, v. 235, p. 415–418. https://doi.org/10.1130/0091-7613(1995)0232.3.CO;2
Schiegl, S., Goldberg, P., Bar-Yosef, O., and Weiner, S., 1996, Ash deposits in Hayonim and Kebara caves, Israel: macroscopic, microscopic
and mineralogical observations, and their archaeological implications: Journal of Archaeological Science, v. 235, p. 763–781. https://doi.
org/10.1006/jasc.1996.0071
Journal of Cave and Karst Studies, March 2021 • 27Hart Spötl, C., and Mangini, A., 2002, Stalagmite from the Austrian Alps reveals Dansgaard-Oeschger events during isotope stage 3: Implications for the absolute chronology of Greenland ice cores: Earth and Planetary Science Letters, v. 203, p. 507−518. https://doi.org/10.1016/S0012- 821X(02)00837-3 Šroubek, P., J.F. Diehl, J.F., and Kadlec, J., 2007, Historical climatic record from flood sediments deposited in the interior of Spirálka Cave, Czech Republic: Palaeogeography, Palaeoclimatology, Palaeoecology, v. 251, p. 547–562. https://doi.org/10.1016/j.palaeo.2007.05.001 Šroubek, P., Diehl, J.F., Kadlec, J., and Valoch, K., 2001, A Late Pleistocene palaeoclimatic record based on mineral magnetic properties of the entrance facies sediments of Kulna Cave, Czech Republic: Geophysical Journal International, v. 147, p. 247–262. https://doi.org/10.1046/ j.0956-540x.2001.01527.x Stanton, R.K., Murray, A.S., and Olley, J.M., 1992, Tracing the source of recent sediment using environment magnetism and radionuclides in the karst of the Jenolan Caves, Australia: International Association of Hydrological Sciences Publication Number 210, p. 125–133. Stock, G.M., Anderson, R.S., and Finkel, R.C., 2004, Pace of landscape evolution in the Sierra Nevada, California, revealed by cosmogenic dating of cave sediments: Geology, v. 323, p. 193–196. https://doi.org/10.1130/G20197.1 Surić, M., Juračić, M., and Horvatinčić, N., 2016, Comparison of 14C and 230Th/234U dating of speleothems from submarine caves in the Adriatic Sea (Croatia): Acta Carsologica, v. 33, p. 239–248. https://doi.org/10.3986/ac.v33i2.302 Thompson, P., Schwarcz, H.P., and Ford, D.C., 1976, Stable isotope geochemistry, geothermometry, and geochronology of speleothems from West Virginia: Geological Society of America Bulletin, v. 87, p. 1730–1738. https://doi.org/10.1130/0016-7606(1976)872.0. CO;2 USEPA, 1994, Method 200.7: Determination of metals and trace elements in water and wastes by inductively coupled plasma-atomic emission spectrometry: Revision 4.4, Cincinnati, OH. USEPA, 1997, The incidence and severity of sediment contamination in surface waters of the United States: Vol. 1, National Sediment Quality Survey. EPA/823/R-97/006. USEPA, Washington, DC. USEPA, 2000, National air pollutant emission trends, 1900–1998: EPA/454/R-00/002. USEPA, Washington, DC: https://nepis.epa.gov/Exe/ ZyPDF.cgi/2000ETJA.PDF?Dockey=2000ETJA.PDF (accessed October 2019). Walling, D.E. and He, Q., 1999, Improved models for estimating soil erosion rates from cesium-137 measurements: Journal of Environmental Quality, v. 282, p. 611–622. https://doi.org/10.2134/jeq1999.00472425002800020027x White, W.B., 2007, Cave sediments and paleoclimate: Journal of Cave and Karst Science, v. 69, no. 1, p. 76–93. Zhang, X.J., Zhang, G.H., Liu, B.L. and Liu, B., 2016, Using cesium-137 to quantify sediment source contribution and uncertainty in a small wa- tershed: Catena, v. 140, p. 116–124. https://doi.org/10.1016/j.catena.2016.01.021 28 • Journal of Cave and Karst Studies, March 2021
You can also read