The hidden influence of large particles on ocean colour - Nature
←
→
Page content transcription
If your browser does not render page correctly, please read the page content below
www.nature.com/scientificreports
OPEN The hidden influence of large
particles on ocean colour
Emlyn J. Davies1*, Sünnje L. Basedow2 & David McKee3
Optical constituents in the ocean are often categorized as water, phytoplankton, sediments and
dissolved matter. However, the optical properties of seawater are influenced, to some degree, by
scattering and absorption by all particles in the water column. Here we assess the relevant size
ranges for determining the optical properties of the ocean. We present a theoretical basis supporting
the hypothesis that millimetre-size particles, including zooplankton and fish eggs, can provide a
significant contribution to bulk absorption and scattering of seawater and therefore ocean color.
Further, we demonstrate that existing in situ instruments are not capable of correctly resolving the
impact of such large particles, possibly leading to their optical significance being overlooked. These
findings refresh our perspective on the potential of ocean color and invite new applications of remote
sensing for monitoring life close to the ocean surface.
The oceans are home to a vast array of organisms with sizes spanning many orders of magnitude1. Particle size
distributions (PSDs), graphically represented in Fig. 1, broadly follow a power law covering everything from
viruses to whales, with abundances decreasing logarithmically with s ize2–5. Each particle sub-population typi-
cally follows a log-normal distribution, with the sum forming the overall power law and with scope for devia-
tions from power law when a particular sub-population becomes unusually dominant e.g. in the case of an algal
bloom or a zooplankton s warm3. Changes in sub-population concentrations affect the power-law exponent, J, of
the total size distribution and alter the relative contributions of large and small particles to the total absorption,
scattering or backscattering. Optically clear oceanic waters will generally present lower particle concentrations
than productive or turbid coastal waters, and increased abundance of large flocculated material closer to the
coast often causes the slope of the PSD to become shallower than offshore phytoplankton-dominated waters6–11.
Ocean color remote sensing from satellites is now routinely used for measurements of global-scale primary
production12–14. Climate-driven changes in phytoplankton photosynthesis can be estimated from time-series of
such estimates15,16. Determination of the content of the near-surface ocean based on its color comes, unsurpris-
ingly, with some substantial assumptions and simplifications regarding interactions between particles and light,
often leading to a debate over the accuracy of the vital global climate processes that are inferred17. Fully under-
standing the various contributions to ocean color signals is crucial for developing robust algorithms required for
climate and ecosystem applications, and calibration/validation of new remote sensing t echniques18,19.
The optical properties of the ocean are traditionally considered to be determined by the effect of dis-
solved organic materials and numerically abundant phytoplankton, detritus and other sediment and colloi-
dal particles2,20,21. However, recent evidence suggests that larger but less abundant particles such as mm-sized
particles (including zooplankton) may also be present in high concentrations near the s urface22, so much so
that they can influence ocean colour s ignals23–27. However, a discrepancy between remote sensing signals and
in situ inherent optical property (IOP) measurements remains23. It appeared that remote sensing signals could
have be influenced by large particle absorption while IOP measurements may not have been sensitive to this
class of particles. In the field, one can visually observe large particles suspended in seawater with the naked eye,
especially in coastal environments, and it is possible to detect their presence with simple cameras (Fig. 2). There
are also several recorded and anecdotal observations of relatively large zooplankton, such as Calanus spp. and
krill species, causing seawater to visually turn “a conspicuous reddish hue”28 or “yellowish tint”29. This raises
the intriguing possibility that the ocean optics community has overlooked large particles as an important set of
contributors to ocean colour signals.
Here we address two fundamentally important questions: (1) Is there a sound theoretical basis to support the
suggestion that large (mm-class), but relatively sparse, coloured particles can significantly influence bulk IOPs
of seawater? (2) If large particles are theoretically capable of influencing IOPs, why might in situ sensors fail to
resolve their impact? The first issue can be investigated using Mie m odelling2 following the approach of Davies
30
et al. . There it was demonstrated that scattering and backscattering signals can be influenced by a broad range
1
SINTEF Ocean, Trondheim, Norway. 2The Arctic University of Norway, Tromsø, Norway. 3University of Strathclyde,
Glasgow, UK. *email: emlyn.davies@sintef.no
Scientific Reports | (2021) 11:3999 | https://doi.org/10.1038/s41598-021-83610-5 1
Vol.:(0123456789)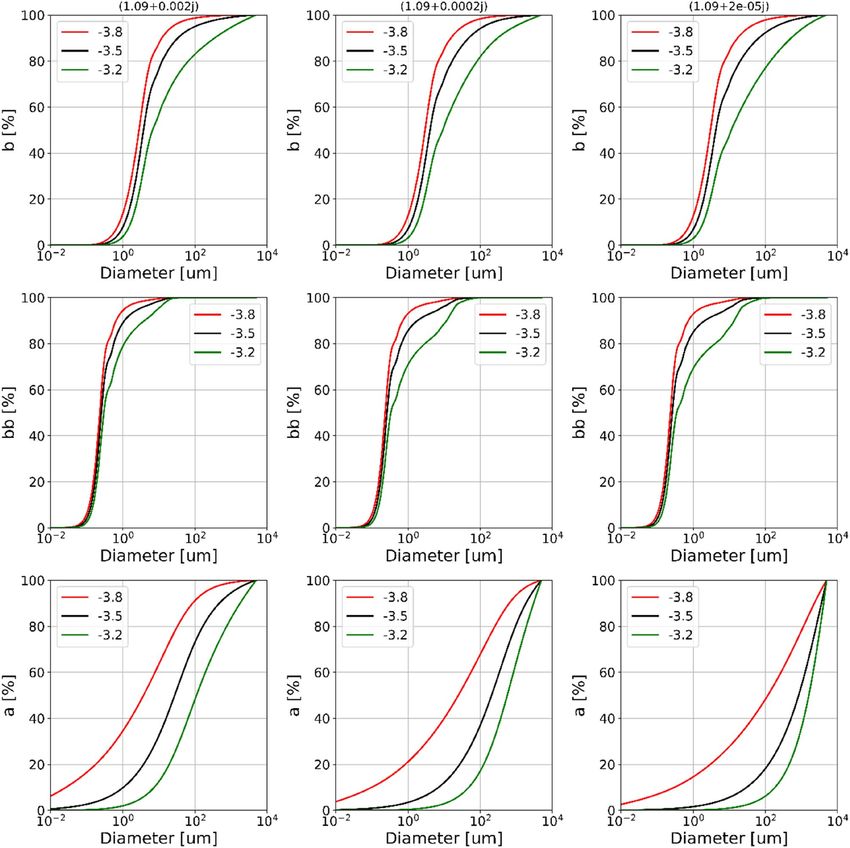
www.nature.com/scientificreports/
Figure 1. Natural particle size distributions in the ocean broadly follow a power law over many orders of
magnitude, from viruses and bacteria to fish and whales. Non-living material contained in the PSD may
also include marine snow, detritus, sediment and microplastic. The power law PSD is the sum of log-normal
distributions for each sub-population, four examples of which are illustrated in this figure. N is the number
of particles of diameter, D; K is the number of 1 µm particles per volume; J is the slope of the power-law
distribution.
of particle sizes (0.02–2000 µm). However, the effect of varying the imaginary refractive index, ni, on absorption
was only very briefly examined and was shown to reduce the largest significant size for backscattering to ~ 150 µm
for ni = 0.001i. This effect requires further elucidation, and the general sensitivity of the absorption coefficient to
particle size has not been systematically explored in this manner. The second question is more difficult to fully
resolve, but we show that small sample volumes of IOP sensors are potentially a limiting factor in capturing the
effect of large colored particles on bulk IOPs.
Results
Do large particles influence bulk optical properties? We examined the effect of varying particle size
and imaginary refractive index, ni, on efficiency factors for scattering, backscattering and absorption (Fig. 3).
This was modelled using Mie theory, and expands on previous sensitivity studies2,30 to account for the full range
of particle sizes and PSD slopes—we discuss the limitations of this approach within the Methods section. It
appeared that large particles can be highly efficient absorbers, even if they are only lightly colored (low ni). Par-
ticle scattering efficiency for large particles converges towards 2 when ni is zero (non-absorbing) but drops by
almost 50% when ni increases (Fig. 3a). The impact of ni is less significant for backscattering (Fig. 3b), with only
small decreases observed for particles in the range 1–100 μm and is only significant for the highest value of ni
used. In contrast, absorption efficiency is highly dependent on ni, with large particles (> 100 μm) reaching satura-
tion efficiency close to 1 when ni increases. In all cases it is the efficiencies of the largest particles that exhibit the
most sensitive responses to changes in the imaginary refractive index.
For the sake of simplicity, we model PSDs using the power law function: N(D) = KD−J (introduced with
Fig. 1). Natural particle PSDs have been shown to have power law slopes varying by as much as 2.64–6.6833, but
values for coastal waters typically fall within a more restricted range of 3.2–3.834. We used this more conservative
range of power law slopes along with a range of realistic ni values to establish the potential impact of imaginary
refractive index on cumulative contributions to bulk IOPs (Fig. 4). Note that this conservative approach repre-
sents a reduced range of variability in PSD slope. We also operate under the assumption that refractive indices
are consistent across the entire particle population and that the PSD is well represented by a power law, both of
which are major simplifications on the complexity found in nature. More complex models should be considered
for further s tudy35,36, however, we deem simplification necessary at this stage to keep the parameter space of our
predictions to a level that allows broad applicability. The range of particle diameters contributing significantly
to each IOP is identifiable from the point at which the cumulative distribution reaches an asymptotic value.
In some of the modelled cases the cumulative distribution does not reach either the upper or lower asymptote
(Fig. 4), indicating that the significant size range extends beyond the range of particle diameters simulated here.
The impact of ni on the range of particle sizes contributing to scattering (top row) and backscattering (middle
row) was limited for the three PSD slopes considered here. However, the range of particle sizes contributing
to absorption was strongly dependent on ni and extends well beyond 103 μm (1 mm) in all but one of the cases
simulated here (Fig. 4, bottom row).
Generally, the significant size range affecting absorption is greater than for both scattering and backscat-
tering, and in a number of cases potentially extends well beyond the mm size class (Fig. 4, bottom row). More
importantly, we demonstrate that there are plausible circumstances where large, but numerically sparse colored
particles can influence bulk IOPs, particularly absorption, and therefore affect remote sensing reflectance signals.
It appears that there is no single value of maximum particle size affecting IOPs in general, or even for a specific
IOP. The value varies with size distribution, refractive index and IOP. For answering our second question, why
Scientific Reports | (2021) 11:3999 | https://doi.org/10.1038/s41598-021-83610-5 2
Vol:.(1234567890)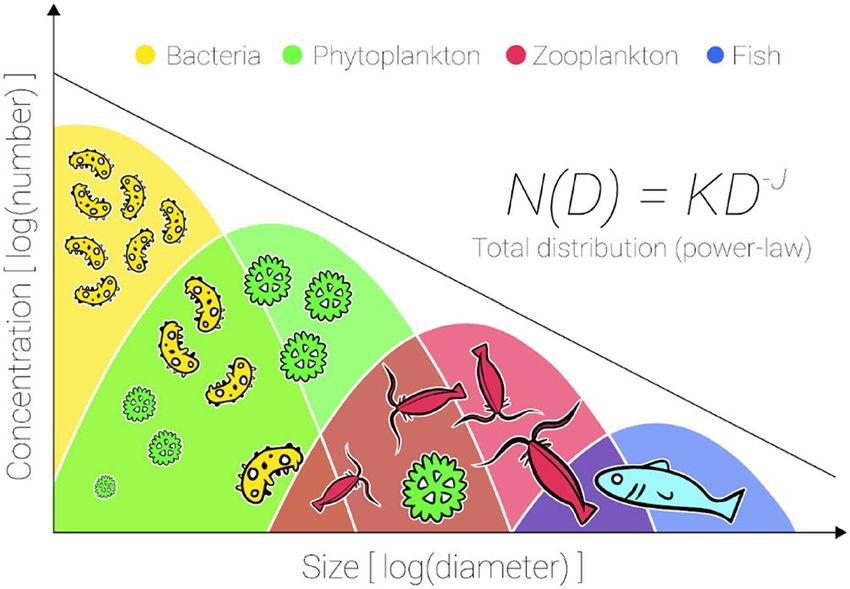
www.nature.com/scientificreports/
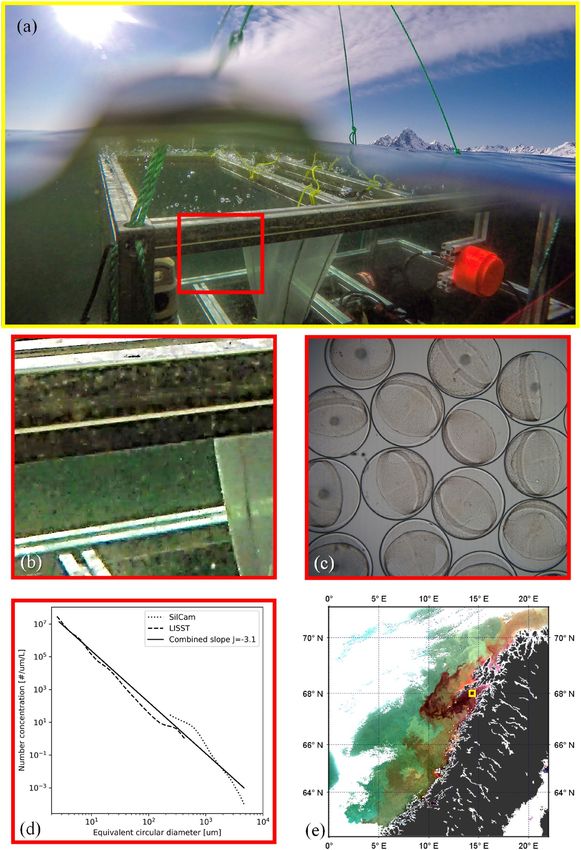
Figure 2. (a) A still image from a GoPro video captures a wave breaking over an instrument cage deployed off the Norwegian
coast in April 2019. The image shows very high abundances of large particles, in this case primarily fish eggs and copepods,
absorbing and scattering light. (b) Zooming in to an enhanced underwater region of the photo highlights the high abundance
of large particles. (c) Fish eggs like these are visually coloured a light brown, preferentially absorbing blue light and are
typically ~ 1.2 mm in diameter. (d) Analysis of images from an in situ Silhouette Camera31 and LISST-100x32 mounted on
the frame allows enumeration of high abundances of large particles, showing the average size distribution in the upper 10 m
below the sea surface. (e) An enhanced RGB image from the MODIS satellite from 5th April 2019 reveals strongly coloured
waters in this region during the same period (data: NASA GSFC, processed by McKee using SeaDAS v7, cruise support from
NEODAAS (PML) gratefully acknowledged).
Scientific Reports | (2021) 11:3999 | https://doi.org/10.1038/s41598-021-83610-5 3
Vol.:(0123456789)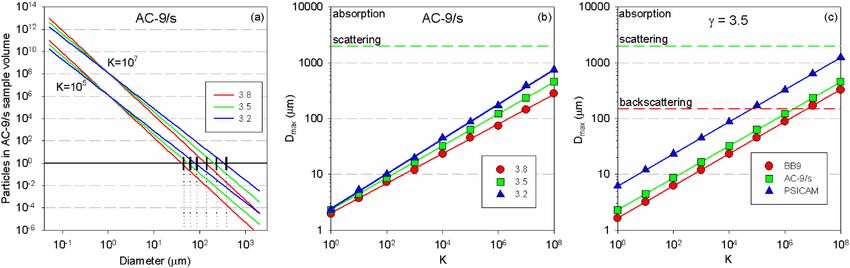
www.nature.com/scientificreports/
Figure 3. Increasing the imaginary refractive index (ni) reduces efficiency factors for (a) scattering, and (b)
backscattering for particle sizes greater than 1–10 μm. (c) Increasing ni results in particles achieving saturation
efficiency (close to an absorption efficiency of 1) at smaller diameters.
we fail to resolve the impact of large particles in IOPs, we consider maximum contributing particle diameters
of 150 µm for backscattering, 2000 µm for scattering and > 10,000 µm for absorption. It needs to be emphasised
that these are crude approximations only, however, these values are consistent with the previous results of Davies
et al.30, considering ni values used in this study.
Why do we miss large particles with optical sensors? In situ optical sensors typically have sample
volumes of the order of ml. The WETLabs BB9 has an effective sample volume of ~ 4 ml, the WETLabs AC-
9/s (25 cm pathlength) has an illuminated sample volume of ~ 12.5 ml, while a benchtop sensor such as the
PSICAM37 has a sample volume of 400 ml. These sample volumes are too limiting to correctly capture the effect
of mm-sized particles with relatively low in situ number densities. Carder and Costello first pointed out that
small sample volumes and the skewed natural PSDs will mean that IOP measurements are biased towards small
particles but did not provide a theoretical framework to quantify the e ffect38. Simply multiplying the PSD by the
relevant sample volume provides the number density of each size class within a particular instrument’s sample
volume—effectively the probability of finding a particle of that size within the sample volume. Figure 5a shows
the effect of scaling several example PSDs for the sample volume of the AC-9/s. For each combination of size dis-
tribution and sensor, there is a maximum particle diameter, Dmax, at which the concentration of particles within
the sample volume drops below unity. Dmax is the largest particle size that the sensor is able to sample properly
for that PSD, with larger particle sizes being systematically under-sampled due to the restricted sample volume.
Low values of the PSD slope return higher Dmax values for a given sensor volume (Fig. 5b), while larger sample
volumes provide higher Dmax values for a given PSD slope (Fig. 5c). Similarly, higher concentrations (higher K
values) return higher values of Dmax. In all cases considered here, which cover a very broad set of conditions, Dmax
for these sensors is generally < 1000 µm (1 mm) meaning that these sensors are incapable of adequately sampling
the larger size classes that have been shown above (Fig. 4) to be potentially significant contributors to bulk IOPs.
For reference, a recent study42 found PSDs for UK coastal waters that are broadly consistent with K = 105. In that
case both the AC-9/s and the PSICAM would have significantly under-sampled the size ranges required for scat-
tering and absorption, while it is likely that there may have been a less conspicuous under-sampling of particles
required for backscattering by the BB9.
Discussion
Ocean colour remote sensing reflectance signals are primarily a function of the bulk inherent optical properties
of seawater and the materials found dissolved and suspended within the water column. Using Mie theory, we
have clearly identified the physical basis through which large, coloured particles can affect bulk IOPs, particularly
absorption, and therefore impact on remote sensing reflectance signals. The potential impact of one species of
zooplankton on ocean colour signals has previously been d iscussed23. The results presented here generalise the
situation to include the whole variety of mm-class colored particles found in the ocean, including other species
of copepods, krill, fish eggs, fish larvae, and non-living suspended particulate material.
Here we have assumed power law PSDs of spherical particles with uniform refractive index distributions.
Natural particle populations will present much more variation in refractive index, particle shape and structure,
and PSD. For example, swarming and mass spawning events may breach the power law PSD, leading to even
greater significance for these particles. This level of natural complexity means it is not possible to define a single
size range for optical significance, but our approach does allow us to clearly state that mm-class particles are likely
to make a significant contribution to bulk IOPs, particularly absorption, in many naturally occurring situations.
We have also demonstrated that standard in situ sampling approaches are biased towards smaller, more
abundant particles and therefore tend to under report the impact of large particles. Large-scale or right hand
truncation is often overlooked but is relatively common when sampling from power law d istributions39, and
can negatively affect associated population estimates. It is not immediately obvious how sample averaging may
overcome this systematic bias. In situ sensors are typically used in a depth-profiling mode, thereby limiting
time available to perform multiple measurements at any given depth. It would, of course, be possible to extend
the time held at any specific depth to increase the effective volume sampled. However, the passage of a large
Scientific Reports | (2021) 11:3999 | https://doi.org/10.1038/s41598-021-83610-5 4
Vol:.(1234567890)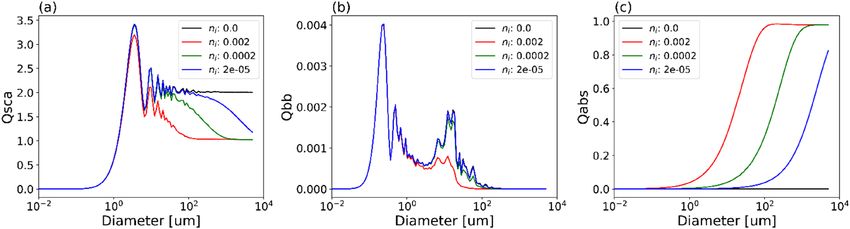
www.nature.com/scientificreports/
Figure 4. Changing imaginary refractive index (columns) on cumulative contributions to (top row) scattering,
(middle row) backscattering, and (bottom row) absorption. Red, black and green lines represent PSD slopes of
3.8, 3.5 and 3.2 respectively. Failure to reach a horizontal asymptote implies that the range of significant particle
sizes extends beyond the range of sizes simulated here (0.001–5000 µm).
particle through the sample volume of an AC-9/s causes a spike in readings that is generally not sampled equally
at all wavebands. Similarly, passing large particles generate spikes in specific BB9 outputs. Here the issue is that
each channel of the sensor observes an independent sample volume and, again, there is no consistent sampling
of these occasional large particles. Interestingly, the spikes caused by such under-sampling have already been
utilised to estimate presence of large particles40,41, but the impact of such spikes on the actual measurement of
IOPs has yet to be addressed.
The benchtop PSICAM instrument is typically used to measure samples in triplicate. Extending the effective
sample volume by increasing the number of samples processed is prohibitively time consuming. There are also
potential artefacts associated with some species groups, e.g. zooplankton and krill, actively evading both in-flow
and net sampling systems42,43. Current sampling procedures are clearly inadequate for resolving the influence of
sparse large particles in a quantitative manner. This measurement bias potentially explains why the ocean optics
community has so far overlooked the impact of large particles on ocean colour signals. The tendency of in situ
observations to favour the impact of small, highly abundant particles would likely have the effect of providing
confirmation bias that the smaller size range was dominant and naturally inhibit systematic investigation of the
Scientific Reports | (2021) 11:3999 | https://doi.org/10.1038/s41598-021-83610-5 5
Vol.:(0123456789)www.nature.com/scientificreports/
Figure 5. (a) Scaling PSD by sensor sample volume enables identification of the maximum particle diameter
( Dmax) for which there is likely to be at least one particle in the sample volume. D max varies with both PSD
slope and concentration scaling. (b) Lower PSD slope values increase D max for a given sensor volume. In
all cases modelled here, the AC-9/s sensor does not sample the full range of particles needed to completely
measure either scattering (2000 µm) or absorption (> 10,000 µm). (c) Sensors with different sample volumes
will sample different parts of the size distribution. Larger sensor volumes (PSICAM > AC-9/s > BB9) result in
higher Dmax values for a given size distribution. The BB9 captures all sizes potentially relevant for backscattering
measurements (150 µm) in only two of the cases shown here. In all other cases the optical sensor volume is
too small to adequately capture all of the particles that contribute to the total scattering or absorption, with
absorption being significantly more under-sampled than the other two IOPs.
effect of larger particle sizes. However, the fact that a satellite sensor effectively samples massive volumes per
pixel (100s of m2 multiplied by the optical depth) means that there is likely to be a mismatch between in situ and
satellite observations where there are significant numbers of large, coloured particles.
New approaches to in situ IOP sensing must be developed to overcome the restricted sample volume issue.
In the absence of such technology, there is a clear need to focus effort on measuring size and refractive index
distributions over much broader size ranges than have previously been attempted. Technology to measure PSDs
already partially exists in the form of laser diffraction32, flow cytometers34, flow cytobot44, flow cam7, holographic
cameras45, other underwater imaging31,46, with combinations of these required to cover the full range of relevant
sizes1,9. There are promising techniques emerging to determine real refractive indices from flow cytometry34
and microscopic imaging47,48. There is also scope to establish imaginary refractive indices for large particles
such as Calanus spp. and krill using the PSICAM to measure their absorption23 and adapting existing inversion
approaches49. It has recently been demonstrated that is is possible to relate measured PSDs and refractive index
distributions to measured bulk I OPs50, so there are good grounds for pursuing this approach to ultimately link
single particle measurements to ocean color satellite observations.
The results presented here demonstrate a need to renew our appreciation of the range of materials that have
the potential to control ocean colour signals, and thus the interpretation of satellite ocean color observations. A
requirement to carefully consider the extent to which measurements of in situ IOPs and particle size distributions
fully capture the contribution of larger particles is also strikingly evident. Taken in combination, these results
present an emerging opportunity to explore new applications of ocean color remote sensing in, for example,
monitoring swarming (e.g. well-known krill swarms in the Southern Ocean) and spawning events (e.g. massive
larval releases in major fishing grounds). The results also justify further development of in situ technology to
enable full identification of all materials contributing to the optical properties of the ocean water.
We have shown that fundamental limitations in the measurement of bulk optical properties have contrib-
uted to the overlooked role of large particles in determining those signals. It is not currently possible to fully
determine the relative optical significance of large particles as there are a number of contributing factors that
will vary from sample to sample, some of which are not routinely available as practical measurements. However,
the results presented here provide a new perspective necessary to support resolution of the dichotomy between
experimental data and the evidence of visual observation of ocean color, and opens the door to a number of
new avenues of research.
Methods
Observational data presented in Fig. 1. Figure 1c was obtained by microscope during laboratory stud-
ies of Cod egg development at SINTEF SeaLab (Trondheim, Norway), and provided courtesy of Bjørn Henrik
Hansen (SINTEF Ocean).
The particle size distribution in Fig. 1d was obtained from both the LISST-100x32 and the SINTEF S ilCam31
from a profiling frame lowered at 25 cm/s vertically through the water column.
Figure 1e contains an enhanced RGB image produced from MODIS data supplied by the Ocean Biology
Processing Group at NASA GSFC. Real-time support from NEODAAS (NERC Earth Observation Data Acqui-
sition and Analysis Service) enabled (cloud-free) MODIS satellite overpasses over the duration of the period in
which the in situ observations were made. To generate the RGB image, wavebands 547 nm, 488 nm, and 443 nm
Scientific Reports | (2021) 11:3999 | https://doi.org/10.1038/s41598-021-83610-5 6
Vol:.(1234567890)www.nature.com/scientificreports/
were used, with each color scaled to include 95% of all pixels. A gamma correction of 0.9 was applied to the blue
channel to improve contrast.
Mie theory modelling. Particles in the ocean are generally more complex than simple homogeneous
spheres, and natural PSDs are a complex mixture of sub-populations of widely varying composition and num-
ber densities. Replicating this level of natural complexity in a modelled environment is not currently possible.
Moreover, it is not required to establish the type of fundamental behaviours discussed in this paper. This requires
a model that can provide predictions of the volume scattering function (to obtain ratios of backscattering and
total scattering), and absorption (including the effects of complex refractive index on scattering). While there is
much debate over the assumptions of homogeneous spheres for ocean p articles10,35,51–53, Mie theory is a reason-
able first approximation for estimating bulk optical properties of natural particles2,34,50,54 and power-law (Junge)
PSDs are similarly reasonable as a first approximation2,3,7,33,53.
The inputs for Mie calculations are particle diameter, D, and the complex refractive index, m = nr + ini where
the real part, nr , represents the relative phase velocity of light, and the imaginary part ni , represents extinction
of light due to absorption. Following the implementation of Bohren and Huffman55 produces attenuation (extinc-
tion) and scattering efficiencies, Qext and Qsca respectively. The absorption efficiency is then derived from
Qabs = Qext − Qsca. Mie calculations also produce values for the scattering phase function, β̃(θ ), which is a normal-
ized volume scattering function, such that the integral over all angles is 1. The backscattering efficiency, Qbb, is
π
obtained from: Qbb = Qsca ∫ β̃(θ )sinθdθ where the term inside the integral represents the fraction of light
π/2
scattered in backwards directions greater than 90 degrees. Bulk IOPs for the entire particle assemblage are cal-
culated using:
∞ πD2
i(m) = ∫ Qi (D, m)N(D)dD
0 4
where i is one of the set (a, b, c, bb) representing absorption, scattering, attenuation and backscattering
r espectively2.
Calculations were performed using an incident wavelength of 670 nm (in air), a real refractive index of 1.09
(in water), 150 log-spaced diameters from 0.001 to 5000 µm, and an angular resolution of 0.5°.
Received: 28 July 2020; Accepted: 5 February 2021
References
1. Lombard, F. et al. Globally consistent quantitative observations of planktonic ecosystems. Front. Mar. Sci. 6, 196. https://doi.
org/10.3389/fmars.2019.00196 (2019).
2. Stramski, D. & Kiefer, D. A. Light scattering by microorganisms in the open ocean. Prog. Oceanogr. 28, 343–383 (1991).
3. Jonasz, M. & Fournier, G. Approximation of the size distribution of marine particles by a sum of log-normal functions. Limnol.
Oceanogr. 41, 744–754 (1996).
4. Sheldon, R. W., Prakash, A. & Sutcliffe, W. H. The size distribution of particles in the ocean. Limnol. Oceanogr. 17, 327–340 (1972).
5. Alldredge, A. L., Passow, U. & Logan, B. E. The abundance and significance of a class of large, transparent organic particles in the
ocean. Deep Res. Part I. https://doi.org/10.1016/0967-0637(93)90129-Q (1993).
6. Bowers, D. G., Binding, C. E. & Ellis, K. M. Satellite remote sensing of the geographical distribution of suspended particle size in
an energetic shelf sea. Estuar. Coast. Shelf Sci. 73, 457–466 (2007).
7. Reynolds, R. A., Stramski, D., Wright, V. M. & Woźniak, S. B. Measurements and characterization of particle size distributions in
coastal waters. J. Geophys. Res. 115, C08024. https://doi.org/10.1029/2009JC005930 (2010).
8. Stramski, D., Boss, E., Bogucki, D. & Voss, K. J. The role of seawater constituents in light backscattering in the ocean. Prog. Oceanogr.
61, 27–56 (2004).
9. Stemmann, L. & Boss, E. Plankton and particle size and packaging: from determining optical properties to driving the biological
pump. Ann. Rev. Mar. Sci. 4, 263–290 (2012).
10. Reynolds, R. A., Stramski, D. & Neukermans, G. Optical backscattering by particles in Arctic seawater and relationships to particle
mass concentration, size distribution, and bulk composition. Limnol. Oceanogr. 61, 1869–1890 (2016).
11. Woźniak, S. B. et al. Optical variability of seawater in relation to particle concentration, composition, and size distribution in the
nearshore marine environment at Imperial Beach, California. J. Geophys. Res. Ocean 115, 1–19 (2010).
12. Platt, T. & Sathyendranath, S. Oceanic primary production: Estimation by remote sensing at local and regional scales. Science
(80-.). https://doi.org/10.1126/science.241.4873.1613 (1988).
13. Sathyendranath, S. et al. Estimation of new production in the ocean by compound remote sensing. Nature. https://doi.
org/10.1038/353129a0 (1991).
14. Joint, I. & Groom, S. B. Estimation of phytoplankton production from space: current status and future potential of satellite remote
sensing. J. Exp. Mar. Biol. Ecol. 250, 233–255 (2000).
15. Behrenfeld, M. J. et al. Climate-driven trends in contemporary ocean productivity. Nature. https://doi.org/10.1038/nature05317
(2006).
16. Boyce, D. G., Lewis, M. R. & Worm, B. Global phytoplankton decline over the past century. Nature. https://doi.org/10.1038/natur
e09268 (2010).
17. McQuatters-Gollop, A. et al. Is there a decline in marine phytoplankton?. Nature. https://doi.org/10.1038/nature09950 (2011).
18. Werdell, P. J. et al. Aerosol measurements by SPEXone on the NASA PACE mission: expected retrieval capabilities. J. Quant.
Spectrosc. Radiat. Transf. 160, 186–212 (2018).
19. Hasekamp, O. P. et al. Aerosol measurements by SPEXone on the NASA PACE mission: expected retrieval capabilities. J. Quant.
Spectrosc. Radiat. Transf. 227, 170–184 (2019).
20. Mobley, C. Chapter 3: Optical Properties of Water. In Light and Water: Radiative Transfer in Natural Waters (eds Mobley, C. D.,
Mobley, C. D. & Preisendorfer, R. W.) (Academic Press, Cambridge, 1994).
21. Stramski, D. & Mobley, C. D. Effects of microbial particles on oceanic optics: a database of single-particle optical properties. Limnol.
Oceanogr. https://doi.org/10.4319/lo.1997.42.3.0538 (1997).
Scientific Reports | (2021) 11:3999 | https://doi.org/10.1038/s41598-021-83610-5 7
Vol.:(0123456789)www.nature.com/scientificreports/
22. Behrenfeld, M. J. et al. Global satellite-observed daily vertical migrations of ocean animals. Nature. https://doi.org/10.1038/s4158
6-019-1796-9 (2019).
23. Basedow, S. L. et al. Remote sensing of zooplankton swarms. Sci. Rep. https://doi.org/10.1038/s41598-018-37129-x (2019).
24. McKinna, L. I. W. Three decades of ocean-color remote-sensing Trichodesmium spp. in the World’s oceans: a review. Prog. Oceanogr.
https://doi.org/10.1016/j.pocean.2014.12.013 (2015).
25. Gower, J., Hu, C., Borstad, G. & King, S. Ocean color satellites show extensive lines of floating sargassum in the gulf of Mexico.
IEEE Trans. Geosci. Remote Sens. 44, 3619–3625 (2006).
26. Wang, M. et al. The great Atlantic Sargassum belt. Science (80-.) https://doi.org/10.1126/science.aaw7912 (2019).
27. Hou, W., Carder, K. L., & Costello, D. K. Scattering phase function of very large particles in the ocean. In Proceedings of the SPIE
2963, Ocean Optics XIII (1997).
28. Sars, G. O. An Account of the Crustacea of Norway. Vol VI. Copepoda, Calanoida (Bergen Museum, Bergen, 1903).
29. Bullen, G. E. Mackerel and Calanus. Nature. https://doi.org/10.1038/091531a0 (1913).
30. Davies, E. J., McKee, D., Bowers, D., Graham, G. W. & Nimmo-Smith, W. A. M. Optically significant particle sizes in seawater.
Appl. Opt. 53, 1067–1074 (2014).
31. Davies, E. J., Brandvik, P. J., Leirvik, F. & Nepstad, R. The use of wide-band transmittance imaging to size and classify suspended
particulate matter in seawater. Mar. Pollut. Bull. 115, 105–114 (2017).
32. Agrawal, Y. C. & Pottsmith, H. C. Instruments for particle size and settling velocity observations in sediment transport. Mar. Geol.
168, 89–114 (2000).
33. Jonasz, M. & Fournier, G. R. Light Scattering by Particles in Water: Theoretical and Experimental Foundations (Elsevier, Amsterdam,
2007). https://doi.org/10.1016/B978-0-12-388751-1.X5000-5.
34. Agagliate, J., Röttgers, R., Twardowski, M. S. & McKee, D. Evaluation of a flow cytometry method to determine size and real
refractive index distributions in natural marine particle populations. Appl. Opt. https://doi.org/10.1364/AO.57.001705 (2018).
35. Dall’Olmo, G., Westberry, T. K., Behrenfeld, M. J., Boss, E. & Slade, W. H. Significant contribution of large particles to optical
backscattering in the open ocean. Biogeosciences 6, 947–967 (2009).
36. Risović, D. Two-component model of sea particle size distribution. Deep Res. Part I. https://doi.org/10.1016/0967-0637(93)90123
-K (1993).
37. Röttgers, R., Häse, C. & Doerffer, R. Determination of the particulate absorption of microalgae using a point-source integrating-
cavity absorption meter: verification with a photometric technique, improvements for pigment bleaching, and correction for
chlorophyll fluorescence. Limnol. Oceanogr. Methods. https://doi.org/10.4319/lom.2007.5.1 (2007).
38. Carder, K. L. & Costello, D. K. Optical effects of large particles. In Ocean Optics (eds Spinrad, R. W. et al.) (Oxford University Press,
Oxford, 1994).
39. Pickering, G., Bull, J. M. & Sanderson, D. J. Sampling power-law distributions. Tectonophysics. https://doi.org/10.1016/0040-
1951(95)00030-Q (1995).
40. Briggs, N. T., Slade, W. H., Boss, E. & Perry, M. J. Method for estimating mean particle size from high-frequency fluctuations in
beam attenuation or scattering measurements. Appl. Opt. 52, 6710–6725 (2013).
41. Giering, S. L. C. et al. Sinking organic particles in the ocean—flux estimates from in situ optical devices. Front. Mar. Sci. 6, 834.
https://doi.org/10.3389/fmars.2019.00834 (2020).
42. Clark, R. A. A critical comparison of two long-term zooplankton time series from the central-west North Sea. J. Plankton Res. 23,
27–39 (2001).
43. Richardson, A. J., John, E. H., Irigoien, X., Harris, R. P. & Hays, G. C. How well does the continuous plankton recorder (CPR)
sample zooplankton? A comparison with the longhurst hardy plankton recorder (LHPR) in the northeast Atlantic. Deep Res. Part
I Oceanogr. Res. Pap. 51, 1283–1294 (2004).
44. Olson, R. J. & Sosik, H. M. A submersible imaging-in-flow instrument to analyze nano-and microplankton: imaging flowcytobot.
Limnol. Oceanogr. Methods 5, 195–203 (2007).
45. Graham, G. W. & Nimmo Smith, W. A. M. The application of holography to the analysis of size and settling velocity of suspended
cohesive sediments. Limnol. Oceanogr. Methods 8. https://doi.org/10.4319/lom.2010.8.1 (2010).
46. Picheral, M. et al. The underwater vision profiler 5: an advanced instrument for high spatial resolution studies of particle size
spectra and zooplankton. Limnol. Oceanogr. Methods 8, 462–473 (2010).
47. Grant, S. D., Richford, K., Burdett, H. L., McKee, D. & Patton, B. R. Low-cost, open-access quantitative phase imaging of algal cells
using the transport of intensity equation. R. Soc. Open Sci. 7, 191921. https://doi.org/10.1098/rsos.191921 (2020).
48. Grant, S. D., Cairns, G. S., Wistuba, J. & Patton, B. R. Adapting the 3D-printed Openflexure microscope enables computational
super-resolution imaging. F1000Research 8, 2003 (2019).
49. Stramski, D., Morel, A. & Bricaud, A. Modeling the light attenuation and scattering by spherical phytoplanktonic cells: a retrieval
of the bulk refractive index. Appl. Opt. https://doi.org/10.1364/ao.27.003954 (1988).
50. Agagliate, J., Lefering, I. & McKee, D. Forward modeling of inherent optical properties from flow cytometry estimates of particle
size and refractive index. Appl. Opt. https://doi.org/10.1364/ao.57.001777 (2018).
51. Bohren, C. F. & Singham, S. B. Backscattering by nonspherical particles: a review of methods and suggested new approaches. J.
Geophys. Res. https://doi.org/10.1029/90JD01138 (1991).
52. Slade, W. H., Boss, E. & Russo, C. Effects of particle aggregation and disaggregation on their inherent optical properties. Opt.
Express 19, 7945–7959 (2011).
53. Graham, G. W., Davies, E. J., Nimmo-Smith, W. A. M., Bowers, D. G. & Braithwaite, K. M. Interpreting LISST-100X measurements
of particles with complex shape using digital in-line holography. J. Geophys. Res. Ocean 117, 1–20 (2012).
54. Agrawal, Y. C., Whitmire, A., Mikkelsen, O. A. & Pottsmith, H. C. Light scattering by random shaped particles and consequences
on measuring suspended sediments by laser diffraction. J. Geophys. Res. Ocean 113, 1–11 (2008).
55. Bohren, C. F. & Huffman, D. R. Absorption and Scattering of Light by Small Particles (Absorption and Scattering of Light by Small
Particles. Wiley, Hoboken, 1998). https://doi.org/10.1002/9783527618156.
Acknowledgements
This study was financed by the Norwegian Research Council through the Stressor project (project no. 287043/
E40). The authors would like to thank Mats Nordaas Olsen for making the illustration in Figure 1.
Author contributions
All three authors have contributed equally to writing the text throughout the document. E.D. has performed the
Mie Theory modelling and produced Figs. 2, 3 and 4. D.M. has performed instrument sample volume statistical
calculations and produced Fig. 5. S.B. has contributed to linking biological processes and previous observations
of relevance as supporting evidence to the hypotheses presented, and in expanding the application of our findings.
Scientific Reports | (2021) 11:3999 | https://doi.org/10.1038/s41598-021-83610-5 8
Vol:.(1234567890)www.nature.com/scientificreports/
Competing interests
The authors declare no competing interests.
Additional information
Correspondence and requests for materials should be addressed to E.J.D.
Reprints and permissions information is available at www.nature.com/reprints.
Publisher’s note Springer Nature remains neutral with regard to jurisdictional claims in published maps and
institutional affiliations.
Open Access This article is licensed under a Creative Commons Attribution 4.0 International
License, which permits use, sharing, adaptation, distribution and reproduction in any medium or
format, as long as you give appropriate credit to the original author(s) and the source, provide a link to the
Creative Commons licence, and indicate if changes were made. The images or other third party material in this
article are included in the article’s Creative Commons licence, unless indicated otherwise in a credit line to the
material. If material is not included in the article’s Creative Commons licence and your intended use is not
permitted by statutory regulation or exceeds the permitted use, you will need to obtain permission directly from
the copyright holder. To view a copy of this licence, visit http://creativecommons.org/licenses/by/4.0/.
© The Author(s) 2021
Scientific Reports | (2021) 11:3999 | https://doi.org/10.1038/s41598-021-83610-5 9
Vol.:(0123456789)You can also read