Understanding Hg Distribution in Sediments From the Santos and São Vicente Estuarine System, Southeastern Brazil
←
→
Page content transcription
If your browser does not render page correctly, please read the page content below
Understanding Hg Distribution in Sediments From
the Santos and São Vicente Estuarine System,
Southeastern Brazil
Bianca Sung Mi Kim ( bianca.kim@usp.br )
Universidade de São Paulo https://orcid.org/0000-0003-2186-3764
Tailisi Hoppe Trevizani
USP: Universidade de Sao Paulo
José Lourenço Friedmann Angeli
USP: Universidade de Sao Paulo
Eduardo Siegle
USP: Universidade de Sao Paulo
Michel Michaelovich de Mahiques
USP: Universidade de Sao Paulo
Rubens Cesar Lopes Figueira
USP: Universidade de Sao Paulo
Research Article
Keywords: Baixada Santista, mercury, contamination, total organic carbon, ICP-OES, pollution
Posted Date: August 3rd, 2021
DOI: https://doi.org/10.21203/rs.3.rs-661008/v1
License: This work is licensed under a Creative Commons Attribution 4.0 International License.
Read Full License
Page 1/17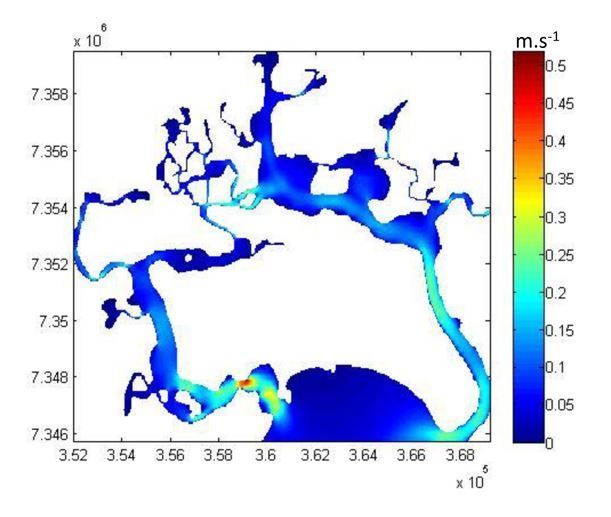
Abstract
The Santos and São Vicente Estuarine System (SSVES) is a region with great economic importance in
southeastern Brazil. It contains petrochemical and metallurgical industrial complexes and the largest
commercial harbor in South America, which have made the region vulnerable to degradation by chemical
pollutants, such as mercury (Hg). This study is the first to evaluate the environmental parameters that
control the spatial distribution of Hg in the surface sediments of the SSVES which is influencied mainly
by hydrodynamics. The innermost part of the estuarine system, where weaker currents lead to an
environment with more sediment deposition, has anomalous Hg concentrations resulting from historical
anthropogenic activities. Althought there is a low probability of negative effects of Hg in organisms, this
element demonstrates greater mobility and bioavailability in the environment, indicating the need for
monitoring Hg for the conservation of this region.

Highlights
Hg distribution was strongly influenced by hydrodynamics of the estuarine system

The concentrations found were mainly linked to organic matter and carbonates

The innermost estuarine system presented higher levels of mercury

1. Introduction
Mercury (Hg) is a highly toxic, persistent and, nonbiodegradable contaminant. It is recognized worldwide
due to its absence of biological function and ability to be biomagnified in the food chain (e.g., Shi et al.
2005; Syversen and Kaur 2012; Gao et al. 2016). It can be released into the environment by natural and
man-made sources and, atmospheric deposition in one of the main routes, leadind to aquatic ecosystems
(Le et al., 2017; Seixas et al., 2012; USEPA, 1997). The atmospheric emission from industrial waste are a
major concern and, the awareness of Hg poisoning started in the early 1950s with Minamata disease.
This disease was discovered by to the consumption of fish and shellfish contaminated with methyl
mercury compounds, discharged into the ecosystem as factory wastes. Among the most important
effects were neurological and biochemical symptoms (Hachiya, 2006; Minamata Disease Municipal
Museum, 2007). Due to strict regulations, the use of Hg has been reduced over time; nonetheless, high
concentrations are still found in the environment, even in remote locations (Le et al., 2017; Wirdinmyer et
al., 2014), especially in sediments (Boening, 2000; Fleck et al., 2016; Gao et al., 2016; Wang et al., 2021).

In aquatic systems, trace elements, such as Hg, have a high affinity for the solid phase and are adsorbed
onto suspended particles. Moreover, flocculation, coagulation and coprecipitation may remove them from
the water column and deposit them in the sediment (Kim et al., 2018; Rodríguez-Barroso et al., 2009;
Unda-Calvo et al., 2019). Thus, sediments act as sinks of suspended and particulate materials playing a
critical role in the Hg cycle (Birch, 2017; Hakanson, 1980). Despite being considered ultimate sinks of
pollutants, sediments can also act as a source of contamination once environmental characteristics
                                                   Page 2/17
change in the water column (Schintu et al., 2015). This can also change the speciation, in which is
dependent on environmental parameters, converting inorganic species to others that are far more labile
and toxic, such as methylmercury (Chakraborty et al., 2016; Deng et al., 2013).
Due to the proximity to potential sources of Hg, coastal and estuarine regions have increasingly been
degraded by chemical inputs (Gao et al., 2021; Kehrig et al., 2006). There are many studies assessing
heavy metal contamination in sediments, but the evaluation and relationship of Hg with surrounding
factors are uncommon, specially in highly urbanized regions. In Brazil, some studies were conduted in
others estuarine/coastal environments, such as Patos Lagoon (Quintana et al., 2020), Guanabara Bay
(Wasserman et al., 2000), Todos os Santos Bay (Fostier et al., 2016) and Tapajós River (Lino et al., 2019),
but at Baixada Santista, despite its economic significance, studies assessing Hg contamination are still
scarce.
The Baixada Santista, which is located in the Santos and São Vicente Estuarine System (SSVES),
southeastern Brazil is a region with great economic importance due to the presence of a important
industrial area (Cubatão Industrial Complex) and the largest commercial harbor of South America
(Santos Port) (Azevedo et al., 2009; CETESB, 2008; Kim et al., 2019). Santos Port, covering a total area of
7.8 milions m2 and 15960 meters of pier extention, is responsible for more than 27% of the national trade,
with a flux of almost U$ 99 billions and approximately 103 millions ton per year (SANTOS, 2021). The
Cubatão Industrial Complex gathers companies of five sectors including petrochemical, steel, mill,
chemical, fertilizers and logistics with a total production more than 15 millions ton in 2019 (CIESP, 2019).
Besides the economic importance, more than 40% of the SSVES territory is protected by conservation
units since it is part of Atlantic rainforest biome (São Paulo, 2013).
Facing the challenges proposed by the 14th goal of 17 Sustainable Development Goals (SDGs), aiming
conservation and sustainability of the oceans, increasing scientific knowledge, the determination of Hg
levels is crucial for the assessment of pollution status and conservation of SSVES, considering that
human pressure into the environment and economic activities must coexist. Thus, this study aims to
evaluate the environmental parameters that control the spatial distribution of Hg levels in the surface
sediments of the SSVES.
2. Materials And Methods
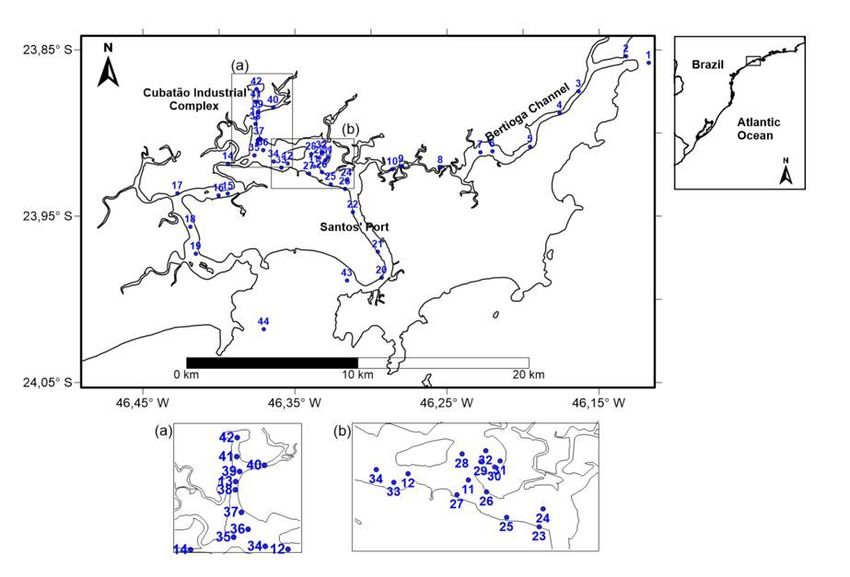
In the summer of 2014, a total of 47 superficial sediment samples were collected along the SSVES using
a stainless steel Van Veen grab (Figure.1). All samples were freeze-dried and homogenized for further
analysis at the Laboratory of Marine Inorganic Chemistry at the University of São Paulo (LaQIMar).
Grain size analyses (< 0.063 mm) were conducted through wet sieving using a 0.063 mm mesh sieve.
Total organic carbon (TOC) was determined in subsamples, after acidification, in an elemental analyzer
(EA) coupled with an isotopic ratio mass spectrometer (IRMS).
Page 3/17Total Hg (organic and inorganic) was determined by the cold vapor technique SW 846 US EPA 7471 A
(USEPA, 1998). Hg was reduced to the elemental state and aerated from solution in a closed system and
analyzed by cold vapor generation coupled with inductively coupled plasma optical emission
spectrometry (VGA-ICP-OES). Quality control was assessed by subjecting a certified reference material
ERM (European Reference Materials) – Estuarine Sediment CC580 n° 0369 (n = 7), to the same analytical
procedure. The method had accuracy and precision, with a relative standard deviation of 7% and recovery
of 97%. In addition, the detection limit of the method (DL) was obtained (DL = 0.006 mg kg− 1; m = 0.6 g; v
= 45 mL), and all samples were above this value.
To better understand estuarine hydrodynamics and relate them to local sediment dynamics, a numerical
model was applied to the estuarine system based on the model presented in Seiler et al. (2020). The
hydrodynamic numerical model was Delft3D (developed by Deltares). The model domain covered the
whole estuarine system with three main channels and the adjacent inner shelf. Boundary conditions
included offshore water levels and riverine inputs throughout the domain. Further details on the model
application and validation can be found in Seiler et al. (2020).The results were analyzed based on the
flow characteristics at each site of interest.
3. Results And Discussion
The levels and spatial distribution of Hg are presented in Fig. 2. The results were compared with the
predicted values for dredging materials established by Brazilian legislation (CONAMA 454/2012) because
the region is subjected to periodical dredging of its navigation channels. This regulation, as well as other
sediment quality guidelines (e.g., Long et al., 1995; Macdonald et al., 1996), designates a level 1, below
which there is a low probability of negative effects on organism and a level 2, above which there is a high
probability of negative effects on the organisms. The comparison shows that 23 samples, that is, 48.9%
of the total samples, presented concentrations between the two levels (0.3–1.0 mg kg− 1) and only two
samples showed values above level 2 (1.0 mg kg− 1).
The mean ± standard deviation (SD), median and range of geochemical tributes, such as mud content
(%mud), CaCO3 content (% CaCO3) and TOC, are presented in Table 1.
Table 1
Statistical Descriptive values for geochemical
parameters
% mud % CaCO3 TOC
Mean ± SD 63.5 ± 32.3 17.5 ± 12.4 3.15 ± 2.3
Median 69.4 15.7 2.6
Min 1.7 3.1 0.3
Max 99.3 66.8 10.8
Page 4/17The results of the hydrodynamic model (Fig. 3) show the distribution of currents within the estuary, with
the most dynamic areas being the main estuarine channels and weaker currents are observed in the
upper estuary. Such a pattern seems to control the Hg distribution in which areas of higher current
velocities present lower Hg concentrations. Samples with higher Hg values are found in areas with
weaker currents, leading to a depositional environment that favors sedimentation and organic matter
concentration.
The high correlation between Hg and TOC is widely reported due to the strong affinity with TOC, which is
also associated with the fine-grained fraction (e.g., Chakraborty et al. 2014; Gao et al. 2016). Moreover,
the concentration of Hg in the sediment is strongly influenced by the solubility of the sedimentary organic
material, especially fulvic acids (Bergkvist, 2001). This acid is released when the organic material is
decomposed by microorganisms or by fluctuations in the amount of water surrounding the environment,
which produces low molecular weight organic acids (Johansson and Tyler, 2001).
Once regions with higher Hg concentrations have weaker hydrodynamics, becoming essentially
depositional environments, the sediment has a high degree of compaction, resulting in a lower oxygen
level and less interstitial water. These environmental settings prevent decomposition, resulting in organic
material of higher molecular weight (Johansson and Tyler, 2001).
Two positive significant correlations (p < 0.05) were observed between Hg and TOC by removing outlier
samples (#36 with [Hg] = 7.69 mg kg− 1 and #45 with [Hg] = 1.45 mg kg− 1) from the data set (Fig. 4).
Nonetheless, when the prediction interval (Kim et al., 2017) was applied, the correlations were statistically
equal (α = 0.05). In addition to these correlations, seven samples (triangles) presented low Hg levels and
high TOC contents. These samples are located inside the Bertioga channel, a pristine region surrounded
by well-developed mangrove forests. Sample #42, which located at the innermost part of the SSVES, did
not fit any correlation once it was in a confined area with a punctual anthropogenic source.
Several studies apply the enrichment factor (e.g., Duodu et al., 2016; Kim et al., 2017; Zhang et al., 2016)
to evaluate the concentration of a particular metal in sediment. This procedure involves normalization
with reference elements to reduce the variability caused by grain size. Taking the sample located inside
the Bertioga channel (#73, [Hg] = 0.06 mg kg− 1) as a reference, due to the pristine conditions of this
region, the enrichment factor (EF) was calculated for all samples (Fig. 5), and the results ranged from
0.91 to 115.0. The latter corresponds to sample #36 and is not shown in the graphic.
The EF results indicated strongly enriched samples, but they were not all in agreement with the
comparison to the CONAMA 454/2012 thresholds. These high EF values may be attributed to the
background Hg value, which is a natural contribution that is almost absent compared to contaminated
samples.
Values of Al, Cu, Fe, Pb, Sc, V, and Zn were taken from (Kim et al., 2019) and a principal component
analysis was performed to understand the relationship between Hg and the other analyzed parameters
and infer possible sources and pathways, from the interelement contribution of each variable (Table 2).
Page 5/17Taking into consideration that the SSVES is an estuarine environment, multiple forces coexist, and strong
marine and lithogenic contributions may hinder other possible influences, so PCA can increase the
sensitivity of the analysis.
As several authors reported (e.g., Kim et al., 2020; Siepak and Sojka, 2017; Zhao et al., 2016), the
lithogenic contribution, represented here by dimension 1 (Table 2), shows the strong contribution of Al, Fe,
Sc and V and corresponds to the weathering and leaching of the rocks. Dimension 2 could be considered
a marine component because most of the calcium carbonate has a biogenic origin and plays an
important role as a dilutant material of the trace elements. Dimensions 3 and 4 showed higher
contributions of Cu, Pb and Zn, indicating an anthropogenic influence, as already recorded in previous
studies (Kim et al., 2019). Higher contributions of Hg were observed in the fifth component,
demonstrating that dimensiona 3 to 5 grouped elements were linked to an anthropogenic origin.
Dimension 5 contributed 6.38% of the variance, but the Hg contribution accounted for 69.02, followed by
TOC (12.11) and carbonate (4.68), which was not negligible.
Table 2
The variance percent and metal contribution of each dimension of the Principal Component Analysis.
Dim.1 (49.04%) Dim.2 (16.01%) Dim.3 (9.81%) Dim.4 (7.32%) Dim.5 (6.38%)
Al 13.51 0.06 4.69 0.48 3.62
Cu 11.39 4.75 5.55 1.20 0.74
Fe 14.46 0.00 0.85 0.00 0.88
Pb 7.49 6.59 16.75 4.96 0.62
Sc 14.73 0.03 2.83 1.03 1.89
V 13.86 0.80 3.81 0.30 0.97
Zn 5.90 6.25 27.09 0.04 3.04
Hg 0.99 5.01 23.11 0.19 69.02
%mud 11.42 4.66 3.84 0.09 1.70
% CaCO3 0.26 26.43 1.20 44.09 4.68
TOC 0.93 14.24 9.98 47.61 12.11
TN 5.05 31.15 0.28 0.00 0.70
Dimension 5 showed strong contributions of Hg, TOC and carbonate, a comparison with the marine
dimension (dimension 2) is given in Fig. 6. Sample #36, as described above, presented high and positive
values for dimension 5 but negative values for dimension 2, suggesting that Hg is linked to high
molecular weight organic matter. Normally, elements linked to carbonate and bicarbonate have a more
labile character (Chakraborty et al., 2014) and are easily available in the environment. Samples #5, #6
Page 6/17and #9, which were collected in Bertioga channel, a pristine region, presented high values for dimension 2
and positive values for dimension 5. This element in these samples may be in its organic form of low
molecular weight, and due to its higher mobility, we hypothesize that this element is bioavailable.
Due to its characteristics, such as high mobility, affinity with organic matter and stability, Hg is generally
not degraded in the environment, especially in the methylated form (Methyl-Hg), which is easily
assimilated by marine biota (Bearhop et al., 2000; Seixas et al., 2009). Moreover, methyl-Hg has proven its
biomagnification capacity and is the most toxic form of Hg (Bearhop et al., 2000; Chouvelon et al., 2017;
Seixas et al., 2009). Almost all mercury that is accumulated in fish is methylated and, consequently
predatory biota, at the top of the aquatic food chain, such as marine mammals, tunas and sharks, are
exposed to higher Hg concentrations (Teffer et al. 2014; Chouvelon et al., 2017). Even with low Hg
concentrations, biomagnification has been observed in marine trophic webs, which is a cause of great
concern, since the trophic pathway is the main Hg absorption path for top predators and humans (Hall et
al., 1997; Lavoie et al., 2013; Le et al., 2017; Zhang et al., 2012).
By comparison with other studies in Brazil and around the world, without outliers, this study showed the
highest Hg levels (Table 3), except for the study by Gao et al. (2016) in China, that includes results of Hg
in the Yellow River, which is in the process of recovering from past pollution activities, and the study by
Scanu et al. (2016), with in sediments from the northern coastal region of Lazio, Italy, that is known for
anomalously high Hg concentrations due to decades of mining and industrial activities. These results
show that the SSVES can also show anomalous concentrations of Hg resulting from the history of
anthropogenic activities in the region.
Table 3
Comparison of the levels of Hg (mg kg− 1) in different coastal/marine
areas
Location Range (mg kg− 1) Reference
Mucuripe harbor - Brazil < 0.03–0.04 Buruaem et al. (2012)
Pecém Harbour - Brazil < 0.03–0.04 Buruaem et al. (2012)
Yellow River - China 0.005–2.663 Gao et al. (2016)
Campos Basin - Brazil 0.002–0.052 Araujo et al. (2017)
Tyrrhenian sea - Italy 0.03–2.2 Scanu et al. (2016)
Western North America < 0.01–0.030 Fleck et al. (2016)
SSVES 0.02–0.88 This study
4. Conclusions
Page 7/17The mercury distribution in the SSVES is dependent on several factors. The accumulation and spatial
distribution of Hg in surface sediments is strongly influenced by hydrodynamics. The highest levels were
found in the innermost part of the estuarine system, where weaker currents lead to an environment with
more deposition. The lowest levels were found in the Bertioga channel, which is considered pristine,
where well developed mangrove forests are found.
Although most samples have Hg levels below which there is a low probability of negative effects for
organisms, this element is related to total organic carbon and carbonate, demonstrating greater mobility
and bioavailability in the environment, especially in the Bertioga Channel. This fact highlights the need
for Hg monitoring in this estuary, which has anomalous Hg concentrations resulting from a history of
anthropogenic activities.
Declarations
Ethics approval and consent to participate
Not applicable
Consent for publication
Not applicable
Availability of data and materials
Trace metals data not included in the manuscript can be found
at: https://doi.org/10.1016/j.marpolbul.2019.04.040 . All other data generated or analysed during this
study are included in this published article
Competing interests
The authors declare that they have no competing interests
Funding
This study was financed in part by the Coordenação de Aperfeiçoamento de Pessoal de Nível Superior –
Brasil (CAPES) – Finance Code 001 and from FAPESP (2017/08987-0, 2011/50581-4, 2009/01211-0).
Authors’ contribution
BSMK analyzed and interpreted data and wrote major part of the manuscript. THV and JLFA reviewed
and contributed in writing. ES performed hydrodynamic analysis and interpretation. MMM and RCLF were
responsible for funding acquisition, project administration and supervision. All authors read and
approves the final manuscript
Acknowledgments
Page 8/17We thank the Oceanographic Institute of University of São Paulo (IOUSP) and the Laboratory of Inorganic
Marine Chemistry (LaQIMar). E.S., M.M.M. and R.C.L.F. are CNPq research fellows.
References
1. Araujo BF, Hintelmann H, Dimock B, Almeida MG, Rezende CE. Concentrations and isotope ratios of
mercury in sediments from shelf and continental slope at Campos Basin near Rio de Janeiro, Brazil.
Chemosphere 2017;178:42–50. https://doi.org/10.1016/j.chemosphere.2017.03.056.
2. Azevedo JS, Fernandez WS, Farias LA, Fávaro DTI, Braga ES. Use of Cathorops spixii as bioindicator
of pollution of trace metals in the Santos Bay, Brazil. Ecotoxicology 2009, 18: 577-586. doi:
10.1007/s10646-009-0315-4.
3. Bearhop S, Phillips RA, Thompson DR, Waldron S, Furness RW. Variability in mercury concentrations
of great skuas Chataracta skua: the influence of colony, diet and trophic status inferred from stable
isotope signatures. Mar. Ecol. Prog. Ser. 2000, 195: 261–268. doi: 10.3354/meps195261.
4. Bergkvist B. Changing of lead and cadmium pools of Swedish forest soils. Water, Air, Soil Pollut
Focus 2001;1:371–83. https://doi.org/10.1023/A:1017522119797.
5. Birch GF. Determination of sediment metal background concentrations and enrichment in marine
environments – A critical review. Sci Total Environ 2017;580:813–31.
https://doi.org/10.1016/j.scitotenv.2016.12.028.
6. Boening DW. Ecological effects, transport, and fate of mercury: A general review. Chemosphere
2000;40:1335–51. https://doi.org/10.1016/S0045-6535(99)00283-0.
7. Buruaem LM, Hortellani MA, Sarkis JE, Costa-Lotufo LV, Abessa DMS. Contamination of por zone
sediments by metals from Large Marine Ecosystems of Brazil. Mar Pollut Bull, 2012, 64:479-488.
doi: http://dx.doi.org/10.1016/j.marpolbul.2012.01.017
8. CETESB (Companhia de Tecnologia de Saneamento Ambiental). Sistema estuarino de Santos e São
Vicente, Secretaria do meio ambiente, São Paulo. 2021. 183p
9. CIESP (Centro de Industrias do Estado de São Paulo). Relatório anual 2019: O desafio é produzir o
futuro com resiliência. 2019, 18p. Available in: <
http://www.ciesp.com.br/cubatao/files/2020/12/Relat%C3%B3rio-Anual-2019-Alta-
resolu%C3%A7%C3%A3o.pdf>
10. Chakraborty P, Sharma B, Raghunath Babu P V., Yao KM, Jaychandran S. Impact of total organic
carbon (in sediments) and dissolved organic carbon (in overlying water column) on Hg sequestration
by coastal sediments from the central east coast of India. Mar Pollut Bull 2014;79:342–7.
https://doi.org/10.1016/j.marpolbul.2013.11.028.
11. Chakraborty P, Vudamala K, Chennuri K, Armoury K, Linsy P, Ramteke D, et al. Mercury profiles in
sediment from the marginal high of Arabian Sea: an indicator of increasing anthropogenic Hg input.
Environ Sci Pollut Res 2016;23:8529–38. https://doi.org/10.1007/s11356-015-5925-1.
Page 9/1712. Chouvelon T, Brach-Papa C, Auger D, Bodin N, Bruzac S, Crochet S, Degroote M, Hollanda SJ, Hubert
C, Knoery J, Munschy C, Puech A, Rozuel E, Thomas B, West W, Bourjea J, Nikolic N. Chemical
contaminants (trace metals, persistent organic pollutants) in albacore tuna from western Indian and
south-eastern Atlantic Oceans: Trophic influence and potential as tracers of populations. Sci. Total
Environ. 2017, 596–597: 481–495. doi: 10.1016/j.scitotenv.2017.04.048.
13. Deng H, Wang D, Chen Z, Xu S, Zhang J, Delaune RD. A comprehensive investigation and assessment
of mercury in intertidal sediment in continental coast of Shanghai. Environ Sci Pollut Res
2013;20:6297–305. https://doi.org/10.1007/s11356-013-1665-2.
14. Duodu GO, Goonetilleke A, Ayoko GA. Comparison of pollution indices for the assessment of heavy
metal in Brisbane River sediment. Environ Pollut 2016;219:1077–91.
https://doi.org/10.1016/j.envpol.2016.09.008.
15. Fleck JA, Marvin-DiPasquale M, Eagles-Smith CA, Ackerman JT, Lutz MA, Tate M, et al. Mercury and
methylmercury in aquatic sediment across western North America. Sci Total Environ 2016;568:727–
38. https://doi.org/10.1016/j.scitotenv.2016.03.044.
16. Fostier AH, Costa FN, Korn GA. Assessment of mercury contamination based on mercury distribution
in sediment , macroalgae , and seagrass in the Todos os. Environ Sci Pollut Res 2016;23:19686–95.
https://doi.org/10.1007/s11356-016-7163-6.
17. Gao B, Han L, Hao H, Zhou H. Pollution characteristics of mercury (Hg) in surface sediments of major
basins, China. Ecol Indic 2016;67:577–85. https://doi.org/10.1016/j.ecolind.2016.03.031.
18. Gao Y, Qiao Y, Xu Y, Zhu L, Feng J. Assessment of the transfer of heavy metals in seawater , sediment
, biota samples and determination the baseline tissue concentrations of metals in marine organisms.
Environ Sci Pollut Res 2021;28:28764–76.
19. Hachiya N. The history and the present of Minamata disease - Entering the second half a century.
Japan Med Assoc J 2006;49:112–8.
20. Hakanson L. An ecological risk index for aquatic pollution control. A sedimentological approach.
Water Res 1980;14:975–1001. https://doi.org/10.1016/0043-1354(80)90143-8.
21. Hall BD, Bodaly RA, Fudge RJP, Rudd JWM, Rosenberg D.M. Food as the dominant pathway of
methylmercury uptake by fish. Water Air Soil Poll. 1997, 100:13–24. doi: 10.1023/A:1018071406537.
22. Johansson K, Tyler G. Impact of atmospheric long range transport of lead, mercury and cadmium on
the Swedish forest environment. Water, Air Soil Pollut 2001:279–
97. https://doi.org/10.1023/A:1017528826641.
23. Kehrig HÁ, Hauser-Davis RA, Seixas TG, Pinheiro AB, Di Beneditto APM. 2016. Mercury species,
selenium, metallothioneins and glutathione in two dolphins from the southeastern Brazilian coast:
Mercury detoxification and physiological differences in diving capacity. Environ. Pollut. 2016, 213:
785-792. doi: 10.1016/j.envpol.2016.03.041.
24. Kim BSM, Angeli JLF, Ferreira PAL, de Mahiques MM, Figueira RCL. Critical evaluation of different
methods to calculate the Geoaccumulation Index for environmental studies: A new approach for
Page 10/17Baixada Santista – Southeastern Brazil. Mar Pollut Bull 2018;127:548–52.
https://doi.org/10.1016/j.marpolbul.2017.12.049.
25. Kim BSM, Angeli JLF, Ferreira PAL, Mahiques MM, Figueira RCL. A multivariate approach and
sediment quality index evaluation applied to Baixada Santista, Southeastern Brazil. Mar Pollut Bull
2019;143:72–80. https://doi.org/10.1016/j.marpolbul.2019.04.040.
26. Kim BSM, Angeli JLF, Ferreira PAL, Sartoretto JR, Miyoshi C, Mahiques MM, et al. Use of a
chemometric tool to establish the regional background and assess trace metal enrichment at
Baixada Santista - southeastern Brazil. Chemosphere 2017;166:372–9.
https://doi.org/10.1016/j.chemosphere.2016.09.132.
27. Kim BSM, Figueira RCL, Angeli JLF, Ferreira PAL, Mahiques MM, Bícego MC. Insights into leaded
gasoline registered in mud depocenters derived from multivariate statistical tool : southeastern
Brazilian coast. Environ Geochem Health 2020;1. https://doi.org/10.1007/s10653-020-00669-1.
28. Lavoie RA, Jardine TD, Matthew MC, Kidd KA, Campbell LM. Biomagnification of mercury in aquatic
food webs: a worldwide meta-analysis. Environ. Sci. Technol. 2013, 47:13385–13394. doi:
10.1021/es403103t.
29. Le DQ, Tanaka K, Dung LV, Siau YF, Lachs L, Kadir STSA, Sano Y, Shirai K. Biomagnification of total
mercury in the mangrove lagoon foodweb in east coast of Peninsula, Malaysia. Regional Studies
Mar. Sci. 2017, 16:49–55. doi: 10.1016/j.rsma.2017.08.006.
30. Lino AS, Kasper D, Guida YS, Thomaz JR, Malm O. Total and methyl mercury distribution in water,
sediment, plankton and fish along the Tapajós River basin in the Brazilian Amazon. Chemosphere
2019;235:690–700. https://doi.org/10.1016/j.chemosphere.2019.06.212.
31. Long ER, Macdonald DD, Smith SL, Calder FD. Incidence of adverse biological effects within ranges
of chemical concentrations in marine and estuarine sediments. Environ Manage 1995;19:81–97.
https://doi.org/10.1007/BF02472006.
32. Macdonald DD, Carr RS, Calder FD, Long ER, Ingersoll CG. Development and evaluation of sediment
quality guidelines for Florida coastal waters. Ecotoxicology 1996;5:253–78.
https://doi.org/10.1007/BF00118995.
33. Minamata Disease Municipal Museum. Minamata Disease: Its History and Lessons. 1st ed.
Minamata, Kumamoto: Minamata City Planning Division; 2007.
34. Quintana G, Mirlean N, Costa K, Johannesson K. Mercury distributions in sediments of an estuary
subject to anthropogenic hydrodynamic alterations ( Patos Estuary ,. Environ Monit Assess
2020;192:192–266.
35. Rodríguez-Barroso MR, Benhamou Y, El Moumni B, El Hatimi I, García-Morales JL. Evaluation of
metal contamination in sediments from north of Morocco: Geochemical and statistical approaches.
Environ Monit Assess 2009;159:169–81. https://doi.org/10.1007/s10661-008-0620-z.
36. Santos (Santos Port Authority). Mensário Estatístico: Maio/2021. Available in:
< http://intranet.portodesantos.com.br/docs_codesp/doc_codesp_pdf_site.asp?id=132997>
Page 11/1737. São Paulo. Secretaria do meio ambiente (SMA). ZEE Baixada Santista: zoneamento ecológico-
econômico – setor costeiro da Baixada Santista. SMA, Coordenadoria de Planejamento Ambiental,
São Paulo, 103pp. Available in: <
http://arquivos.ambiente.sp.gov.br/cpla/2011/05/ZEE_PUBLICACAO.pdf>
38. Scanu S, Piazzolla D, Frattarelli FM, Mancini E, Tiralongo F, Brundo MV, et al. Mercury Enrichment in
Sediments of the Coastal Area of Northern Latium, Italy. Bull Environ Contam Toxicol 2016;96:630–
7. https://doi.org/10.1007/s00128-016-1776-9.
39. Schintu M, Buosi C, Galgani F, Marrucci A, Marras B, Ibba A, et al. Interpretation of coastal sediment
quality based on trace metal and PAH analysis, benthic foraminifera, and toxicity tests (Sardinia,
Western Mediterranean). Mar Pollut Bull 2015;94:72–
83. https://doi.org/10.1016/j.marpolbul.2015.03.007.
40. Seiler, L.; Figueira, R.C.L.; Schettini, C.A.F.; Siegle, E. 2020. Three-dimensional hydrodynamic modeling
of the Santos-São Vicente-Bertioga estuarine system, Brazil. Regional Studies in Marine Science, 37:
101348. https://doi.org/10.1016/j.rsma.2020.101348
41. Shi J, Liang L, Jiang G, Jin X. The speciation and bioavailability of mercury in sediments of Haihe
River, China. Environ Int 2005;31:357–65. https://doi.org/10.1016/j.envint.2004.08.008.
42. Siepak M, Sojka M. Application of multivariate statistical approach to identify trace elements
sources in surface waters: a case study of Kowalskie and Stare Miasto reservoirs, Poland. Environ
Monit Assess 2017;189. https://doi.org/10.1007/s10661-017-6089-x.
43. Syversen T, Kaur P. The toxicology of mercury and its compounds. J Trace Elem Med Biol
2012;26:215–26. https://doi.org/10.1016/j.jtemb.2012.02.004.
44. Teffer AK, Staudinger MD, Taylor DL, Juanes F. Trophic influences on mercury accumulation in top
pelgaic predators from offshore New England waters of the northwest Atlantic Ocean. Mar. Environ.
Res. 2014, 101: 124–134. doi: 10.1016/j.marenvres.2014.09.008.
45. Unda-Calvo J, Ruiz-Romera E, Fdez-Ortiz de Vallejuelo S, Martínez-Santos M, Gredilla A. Evaluating
the role of particle size on urban environmental geochemistry of metals in surface sediments. Sci
Total Environ 2019;646:121–33. https://doi.org/10.1016/j.scitotenv.2018.07.172.
46. USEPA (Unitec States Environmental Protection Agency). 1997. Mercury Study Report to Congress,
vols. 1–8. Washington (DC), Office of Air Quality Planning and Standards and Office of Research and
Development, Report no. EPA-452/R-97–005.
47. USEPA. Method 7471B. Mercury in solid or semisolid waste (Manual cold-vapor technique). 1998.
48. Wang M, Liu X, Yang B, Fei Y, Yu J, An R, et al. Heavy metal contamination in surface sediments from
lakes and their surrounding topsoils of China. Environ Sci Pollut Res 2021;28:29118–30.
49. Wasserman JC, Freitas-Pinto AAP, Amouroux D. Mercury Concentrations in Sediment Profiles of a
Degraded Tropical Coastal Environment. Environ Technol 2000;21:297–
305. https://doi.org/10.1080/09593332108618117.
50. Wiedinmyer C, Yokelson RJ, Gullett BK. Global emissions of trace gases, particulate matter, and
hazardous air pollutants from open burning of domestic waste. Environ. Sci. Technol. 2014,
Page 12/1748:9523–9530. doi: 10.1021/es502250z.
51. Zhang L, Campbell LM, Johnson TB. Seasonal variation in mercury and food web biomagnification
in Lake Ontario, Canada. Environ. Pollut. 2012, 161:178-184. doi: 10.1016/j.envpol.2011.10.023.
52. Zhang R, Guan M, Shu Y, Shen L, Chen X, Zhang F, et al. Historical record of lead accumulation and
source in the tidal flat of Haizhou Bay, Yellow Sea: Insights from lead isotopes. Mar Pollut Bull
2016;106:383–7. https://doi.org/10.1016/j.marpolbul.2016.02.046.
53. Zhao G, Ye S, Yuan H, Ding X, Wang J. Distribution and contamination of heavy metals in surface
sediments of the Daya Bay and adjacent shelf, China. Mar Pollut Bull 2016;112:420–6.
https://doi.org/10.1016/j.marpolbul.2016.07.043.
Figures
Figure 1
Santos and São Vicente Estuarine System and sampling locations Grain size analyses (< 0.063 mm)
were conducted through wet sieving using a 0.063 mm mesh sieve. Total organic carbon (TOC) was
determined in subsamples, after acidification, in an elemental analyzer (EA) coupled with an isotopic ratio
Page 13/17mass spectrometer (IRMS). Note: The designations employed and the presentation of the material on this
map do not imply the expression of any opinion whatsoever on the part of Research Square concerning
the legal status of any country, territory, city or area or of its authorities, or concerning the delimitation of
its frontiers or boundaries. This map has been provided by the authors.
Figure 2
(a) Levels and; (b) spatial distribution of Hg (mg kg-1) in the study area Note: The designations employed
and the presentation of the material on this map do not imply the expression of any opinion whatsoever
Page 14/17on the part of Research Square concerning the legal status of any country, territory, city or area or of its
authorities, or concerning the delimitation of its frontiers or boundaries. This map has been provided by
the authors.
Figure 3
Model averaged current velocity magnitude in the SSVES over a neap-spring tide cycle. Note: The
designations employed and the presentation of the material on this map do not imply the expression of
any opinion whatsoever on the part of Research Square concerning the legal status of any country,
territory, city or area or of its authorities, or concerning the delimitation of its frontiers or boundaries. This
map has been provided by the authors.
Page 15/17Figure 4
Correlation between TOC and levels of Hg (mg kg-1)
Figure 5
Enrichment factors of Hg at SSES without the sample #36.
Page 16/17Figure 6
Scatter plot of the dimension (Dim) 2 and 5 from the PCA of samples from SSVES
Page 17/17You can also read