Sustaining weight loss among adults with obesity using a digital meal planning and food purchasing platform for 12, 24, and 36 months: a ...
←
→
Page content transcription
If your browser does not render page correctly, please read the page content below
Hu et al. Nutrition Journal    (2021) 20:8
https://doi.org/10.1186/s12937-021-00666-9

 RESEARCH                                                                                                                                           Open Access

Sustaining weight loss among adults with
obesity using a digital meal planning and
food purchasing platform for 12, 24, and 36
months: a longitudinal study
Emily A. Hu1*, Mahesh Pasupuleti1, Viet Nguyen1, Jason Langheier1 and Dexter Shurney2

  Abstract
  Background: Previous studies have shown that lifestyle changes, such as diet and exercise, can lead to weight loss,
  resulting in dramatic improvements in overall health and chronic disease risk. However, while many traditional
  dieting, food tracking and weight loss coaching programs result in short-term weight loss, there is less evidence of
  their effectiveness on sustaining weight loss over time.
  Methods: We conducted a retrospective analysis of 1,740 adults with obesity who used Foodsmart, a digital
  personalized dietary assessment, meal planning and food purchasing platform. Participants reported age, gender, at
  least three measures of weight, and their diet using a food frequency questionnaire. We defined sustained weight
  loss as participants who lost 5 % of initial weight between their first and second reported weights and lost weight
  or maintained weight between second and third reported weights. A healthy eating score, Nutriscore, was
  calculated to assess overall diet quality. We used multivariate logistic regression models to examine the association
  between user characteristics and odds of sustained weight loss.
  Results: Over a median of 25 months, the mean (standard deviation) change in weight among participants was −
  6.2 (19.8) pounds. In total, 39.3 % (684/1,740) of participants lost at least 5 % of their initial weight, and 22.4 %
  percent (389/1,740) of participants sustained weight loss. In the fully-adjusted logistic regression model, we found
  that obesity class 2 (odds ratio, OR: 1.69, 95 % confidence interval, CI: 1.27–2.24, P < 0.001), obesity class 3 (OR: 2.23,
  95 % CI: 1.68–2.97, P < 0.001), baseline diet quality (OR: 1.06, 95 % CI: 1.02–1.09, P < 0.001), and greater change in
  diet quality (OR: 1.10, 95 % CI: 1.07–1.14, P < 0.001) were significantly associated with sustained weight loss.
  Conclusions: This study characterized and demonstrated the utility of Foodsmart, a digital platform that gives
  personalized nutrition recommendations and meal planning tools, in sustained weight reduction among users with
  obesity.
  Keywords: Obesity, Digital, Nutrition, Meal planning, Weight loss, Weight maintenance, Sustained, Dietary score,
  Mobile app

* Correspondence: emily.hu@foodsmart.com
1
 Zipongo, Inc, DBA Foodsmart, 595 Pacific Ave, 4th Floor, San Francisco, CA
94133, USA
Full list of author information is available at the end of the article

                                        © The Author(s). 2021 Open Access This article is licensed under a Creative Commons Attribution 4.0 International License,
                                        which permits use, sharing, adaptation, distribution and reproduction in any medium or format, as long as you give
                                        appropriate credit to the original author(s) and the source, provide a link to the Creative Commons licence, and indicate if
                                        changes were made. The images or other third party material in this article are included in the article's Creative Commons
                                        licence, unless indicated otherwise in a credit line to the material. If material is not included in the article's Creative Commons
                                        licence and your intended use is not permitted by statutory regulation or exceeds the permitted use, you will need to obtain
                                        permission directly from the copyright holder. To view a copy of this licence, visit http://creativecommons.org/licenses/by/4.0/.
                                        The Creative Commons Public Domain Dedication waiver (http://creativecommons.org/publicdomain/zero/1.0/) applies to the
                                        data made available in this article, unless otherwise stated in a credit line to the data.
Hu et al. Nutrition Journal   (2021) 20:8                                                                          Page 2 of 8

Background                                                         Given the paucity of studies examining the sustainability
Obesity is a growing public health and economic burden           of weight loss after more than 12 months, the aim of this
as it is a leading cause of chronic illnesses and mortality,     study was to examine the effectiveness of a digital nutri-
resulting in extraordinary healthcare costs [1–3]. While         tion, meal planning, and food purchasing tool in weight
prevention of obesity and weight gain is crucial to redu-        loss after 12, 24, and 36 months among users with obesity.
cing the incidence of serious chronic illnesses, efforts to
reverse obesity are just as urgent as the prevalence of          Methods
obesity increases [4, 5]. Among people with obesity, los-        Foodsmart
ing weight and maintaining a healthy weight can prevent          Foodsmart™ is a digital nutrition platform that encour-
future comorbidities and health complications [6].               ages lasting behavior change through personalization of
   Changes in lifestyle behaviors such as diet and physical      nutrition and meal/recipe recommendations and
activity are frequently used in weight loss interventions [7].   through altering the food purchasing environment to
Large behavior change trials such as the Diabetes Preven-        provide healthy eating options. The two main compo-
tion Program (DPP) have shown that changes in lifestyle          nents are FoodSmart and FoodsMart, which both use
can have dramatic effects on health and chronic disease,         behavior change theory to facilitate access and engage-
often related to weight reduction [8, 9]. However, fre-          ment with affordable, tasty, and healthy food (Fig. 1).
quently people who lose weight from lifestyle interventions        The FoodSmart component contains the in-app Nutri-
like DPP regain weight after 12 months, which can have ad-       quiz, a food frequency questionnaire (based on the National
verse health consequences and be more costly due to re-          Cancer Institute’s Diet History Questionnaire) which users
peatedly returning to weight loss programs [10, 11]. Weight      take to report their dietary habits, and that provides imme-
cycling may put additional stress on the cardiovascular sys-     diate feedback on areas they can improve upon as well as
tem through negative effects on blood pressure levels, heart     personalized meal and recipe planning based on the Nutri-
rate, sympathetic activity, glucose, lipids, and insulin [11].   quiz results. The Nutriquiz also ascertains demographic in-
   Digital technologies have been incorporated into obes-        formation, weight, and clinical conditions. The user can
ity prevention and weight loss strategies as they have           retake the Nutriquiz at any time, allowing them to monitor
become integrated into everyday life for many individ-           their progress on diet and weight. The other component is
uals [12, 13]. While many diet tracking and nutrition            FoodsMart, which helps alter the user’s food purchasing en-
education mobile applications have been successful in            vironment through personalized meal planning. Users can
achieving weight loss among individuals with overweight          add to their grocery list within the app and then use inte-
or obesity, there is less evidence on how successful they        grated online ordering and delivery of groceries, meal kits,
are in maintaining weight loss [14].                             and prepared foods. Customized grocery discounts on
   Furthermore, the majority of commercial nutrition             healthier options help the user save money and further
mobile apps focus on nutrition education, coaching, or           nudges the user to make healthier choices.
diet monitoring and logging [15]. However, a multi-                Foodsmart is available through certain health plans
pronged approach that addresses an individual’s environ-         and employers, who provide this product as an option or
ment to break down barriers to healthy eating through            benefit for their members/employees to enroll in. It is
knowledge, access, and cost may be more successful in            available on web, iOS, and Android.
creating lasting behavior change. In addition to helping
educate and track an individual’s dietary and weight             Study population
progress, altering the food purchasing and cooking en-           We conducted a longitudinal, retrospective analysis of 1,
vironment is a macro-level change that can facilitate            740 adults with obesity living in the U.S. who used Foods-
healthier choices in grocery shopping and meal plan-             mart between January 2013 and April 2020. As of April
ning. Brick-and-mortar grocery stores, from supermar-            2020, there were 888,999 users who had signed up for
kets to convenience stores, are subject to imbalanced            Foodsmart. Among all of the users, we excluded
advertising and product placement of unhealthy foods,            individuals who did not report weight (n = 562,276),
leading to impulse purchases [16]. The removal of ad-            individuals who reported extreme values for height (< 54
vertising of these tempting processed foods in an online         or > 78 inches) or weight (< 60 or > 400 pounds) (n = 25,
grocery ordering setting and nudges towards healthier            946), and individuals who did not have obesity [body mass
foods may change the environment to positively influ-            index (BMI) < 30 kg/m2] at first weight entry (n = 200,
ence the user to make healthier decisions. Previous              308). We further excluded individuals who did not report
studies have shown that higher frequency of cooking              weight at least three times and participants with less than
and eating at home is associated with healthier                  1 month between first and second or second and third
diet quality, fewer calories consumed, and greater               weight report (n = 98,729). The final analytic sample in-
weight loss [17–20].                                             cluded 1,740 users.
Hu et al. Nutrition Journal   (2021) 20:8                                                                    Page 3 of 8

 Fig. 1 Components of Foodsmart

Dietary Assessment                                            obesity class. Class 1 obesity was defined as a BMI be-
Dietary data were self-reported through Foodsmart. Upon       tween 30 and 34.9 kg/m2, class 2 was defined as a BMI
registration, users were prompted to fill out a dietary       of 35 to 39.9 kg/m2, and class 3 was defined as a BMI of
questionnaire called “Nutriquiz”, a 53-item food frequency    40 kg/m2 or higher.
questionnaire adapted from the National Cancer Institute         Our primary outcome was sustained weight loss,
Diet History Questionnaire, which has been previously         which we defined as losing 5 % of initial weight between
validated [21]. Information on sex, age, weight, and usual    first and second reported weights and additional weight
frequency of dietary intake (fruits, vegetables, whole        loss or no change between the second and third reported
grains, proteins, carbohydrates, fats, fiber, sodium, and     weights.
water) are collected through the Nutriquiz. A healthy diet       Duration of enrollment (in months) in Foodsmart was
score created by the Foodsmart research team called           calculated as the number of months between the first ac-
Nutriscore was calculated, which is derived from the Al-      tivity date and last activity date.
ternative Healthy Eating Index-2010, a previously vali-
dated score among several U.S. cohorts, and the
Commonwealth Scientific and Industrial Research               Statistical analysis
Organization (CSIRO) Healthy Diet Score [22, 23]. Partici-    We used descriptive analyses to examine baseline char-
pants were assigned a score from 0 to 10 (with 10 being       acteristics of the total study population and by whether
optimal) for each of seven components: fruits, vegetables     participants sustained weight loss or not. We reported
(excluding potatoes), protein ratio (white meat/vegetarian    categorical variables as frequencies (%) and continuous
protein to red/processed meat), carbohydrate ratio (total     variables as mean ± standard deviation (SD).
fiber to total carbohydrate), fat ratio (polyunsaturated to      To investigate long-term efficacy of Foodsmart on
saturated/trans fat), sodium, and hydration (percent of       sustained weight loss, we examined the percent of par-
daily fluid goal). A total Nutriscore (possible scores ran-   ticipants who sustained weight loss by the duration of
ging from 0 to 70) was calculated by summing the scores       their enrollment time (by 12, 24, and 36 months). Fur-
of the seven components. Change in Nutriscore was cal-        ther, we examined the percent of participants by each
culated as the difference between a participant’s first and   category of age, baseline obesity class, and change in
last Nutriscores. We categorized participants by whether      Nutriscore. We used chi-square tests to determine
their Nutriscore decreased or was stable (no improvement      whether differences within each category were statisti-
in diet quality) versus increased (improvement in diet        cally significantly different.
quality).                                                        Multivariate logistic regression models were used to
                                                              estimate odds ratios (OR) and 95 % confidence intervals
Measurement of Weight                                         (CI) of sustained weight loss adjusted for gender, age
Users were given the option to add weight and height          category, baseline obesity category, baseline Nutriscore
data when they first created their Foodsmart account          (per 2-point increase), and change in Nutriscore (per 2-
and could update their weight at any time during usage        point increase).
of the platform. Baseline BMI was calculated as first            We considered a P-value smaller than 0.05 to be sig-
weight entry in kilograms divided by height in meters         nificant for all tests. Stata version 16 was used for all
squared (kg/m2). We categorized participants by baseline      analyses (StataCorp, College Station, Texas).
Hu et al. Nutrition Journal (2021) 20:8 Page 4 of 8
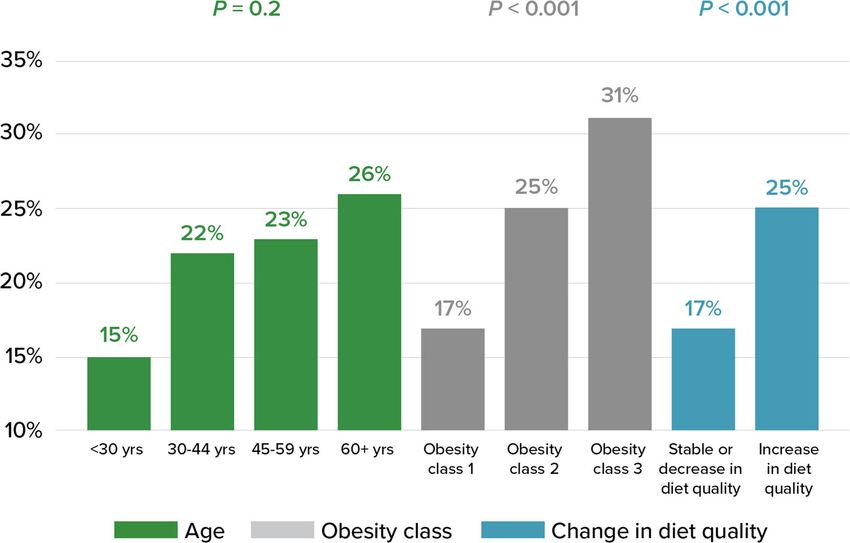
The study was declared exempt from Institutional Re- We also examined the percentage of participants who
view Board oversight by the Pearl Institutional Review sustained weight loss by categories of age, baseline obes-
Board given the retrospective design of the study and ity class, and improvement in Nutriscore (Fig. 3). The
less than minimal risk to participants. percent of participants who sustained weight loss in-
creased with age, baseline obesity class, and improve-
ment in diet quality, however was only statistically
Results significant for the latter two using chi-square tests (P <
Participant characteristics 0.05).
Baseline demographic characteristics and weight metrics
of the total study sample and stratified by whether par- Predictors of Sustained Weight Loss
ticipants had sustained weight loss are shown in Table 1. We examined predictors of sustained weight loss in
There were 1,740 participants included in the analysis, multivariate logistic regression (Table 2).
of which the mean age was 48 years and 16 % were male There was no significant association between gender
(Table 1). The mean and median enrollment length was and sustained weight loss (P = 0.1) or age and sustained
25 months. In total, 39.3 % (684/1,740) of participants weight loss (P = 0.2). Compared with individuals who were
lost at least 5 % of their initial weight in the first time in obesity class 1 at baseline, those who were in obesity
period, and 22.4 % percent (389/1,740) of participants class 2 and obesity class 3 had a 69 % and 123 %, respect-
sustained weight loss. Compared to participants who did ively, increased likelihood of sustained weight loss. Each
not sustain weight loss, participants who did sustain additional two-point increase in baseline Nutriscore was
weight loss were more likely to have been categorized in associated with a 6 % increased likelihood of sustained
a higher obesity class at baseline, have a higher change weight loss (OR: 1.06, 95 % CI: 1.02–1.09, P < 0.001) and
in Nutriscore, and experienced greater weight loss. each two-point increase in change in Nutriscore was asso-
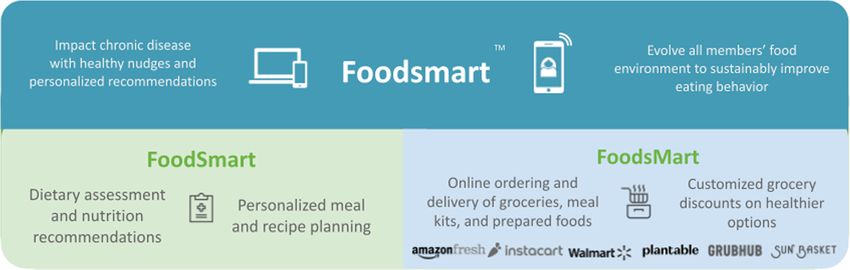
We examined the percent of participants who sus- ciated with 10 % increased likelihood of sustained weight
tained weight loss by cumulative enrollment time in loss (OR: 1.10, 95 % CI: 1.07–1.14, P < 0.001).
Fig. 2. Among all participants, 22.4 % sustained weight
loss. Among participants who were enrolled for greater Discussion
than 12, 24, and 36 months, the percent of participants We found that among 1,740 adults with obesity who
who sustained weight loss was, respectively, 21.7 %, used Foodsmart, a digital meal planning and food pur-
22.8 %, and 23.8 %. chasing platform, 22.4 % of participants sustained weight
Table 1 Baseline characteristics of all participants and by sustained weight loss
Total (n = 1,740) Did not sustain weight Sustained weight loss
loss (n = 1,351) (n = 389)
Age, yrs 48 ± 11 48 ± 11 49 ± 11
Male, % 16 % 16 % 18 %
Height, inches 66 ± 3 66 ± 3 66 ± 3
Baseline weight, lbs 225 ± 40 222 ± 39 235 ± 42
Baseline BMI, kg/m2 37 ± 6 36 ± 6 38 ± 6
Obesity class
Obesity class 1 (BMI 30.1–35 kg/m2) 51 % 54 % 39 %
Obesity class 2 (BMI 35.1–40 kg/m2) 25 % 25 % 28 %
2
Obesity class 3 (BMI > 40.1 kg/m ) 24 % 21 % 33 %
Baseline Nutriscore 30.3 ± 8.5 30.3 ± 8.6 30.5 ± 8.5
Final Nutriscore 33.7 ± 8.6 33.1 ± 8.6 35.7 ± 7.9
Change in Nutriscore 3.3 ± 7.9 2.8 ± 7.8 5.2 ± 8.0
Enrollment length, months 25 ± 10 25 ± 10 25 ± 10
Weight change, % -2.5 ± 8.6 0.2 ± 7.0 -12.1 ± 6.6
Weight change, lbs -6.2 ± 19.8 0.3 ± 15.4 -28.5 ± 17.2
Weight change from 1st to 2nd report, lbs -4.0 ± 15.6 -0.1 ± 13.7 -17.6 ± 14.4
Weight change from 2nd to 3rd report, lbs -2.1 ± 14.2 0.4 ± 14.4 -10.9 ± 9.2
Categorical variables were reported as frequencies (%) and continuous variables were reported as mean ± standard deviation (SD)
Abbreviations: BMI body mass index; kg kilograms; lbs pounds; m meterHu et al. Nutrition Journal (2021) 20:8 Page 5 of 8 Fig. 2 Percent of participants who sustained weight loss by cumulative enrollment time Fig. 3 Percent of participants who sustained weight loss by category of age, obesity class, and change in diet quality11 Chi-square tests were used to test for significant differences between groups within each category
Hu et al. Nutrition Journal        (2021) 20:8                                                                                    Page 6 of 8

Table 2 Factors contributing to sustained weight loss in                         aspects in a holistic manner. Foodsmart seeks to re-
multivariate logistic regression models                                          move these barriers by providing an online grocery
                                                 Multivariate          P         shopping experience to save time, discounts and
                                                 OR (95 % CI)                    deals, and meal planning features for personalized,
Male                                             1.33 (0.98–1.81)      0.1       healthy recipes. This type of model for food purchas-
Age                                              1.01 (1.00-1.02)      0.2       ing is especially relevant during the COVID-19 pan-
Baseline BMI                                                                     demic, where grocery shopping in brick-and-mortar
Obesity class 1                                  1 (ref.)
                                                                                 stores is discouraged and online shopping orders have
                                                                                 increased [29, 30]. The rise in online grocery ordering
Obesity class 2                                  1.69 (1.27–2.24)      < 0.001
                                                                                 and food purchasing/delivery may pave a new future
Obesity class 3                                  2.23 (1.68–2.97)      < 0.001   for how food is purchased [30].
Baseline Nutriscore (per 2 pt increase)          1.06 (1.02–1.09)      < 0.001      Foodsmart provides a toolkit of features that are per-
Change in Nutriscore (per 2 pt increase)         1.10 (1.07–1.14)      < 0.001   sonalized for the user and offers advice at almost every
Abbreviations: BMI body mass index; CI confidence interval; kg kilogram;         opportunity a user comes in contact with food to help
m meter; OR odds ratio; ref reference; yrs years                                 users eat healthier and has been shown to result in
                                                                                 weight loss among users with obesity [31]. Grounded in
                                                                                 the Theory of Change behavior theory model, the spe-
loss (lost 5 % of initial weight and then maintained the                         cific features of the platform are intended to target all
same weight or lost more weight). Sustained weight loss                          stages of behavior change (pre-contemplation, contem-
was observed consistently after 12 (21.7 %), 24 (22.8 %),                        plation, preparation, action, and maintenance) [32]. The
and 36 (23.8 %) months of engagement with the plat-                              Nutriquiz and meal planning features help target stages
form. Baseline obesity class, baseline Nutriscore, and                           of contemplation and preparation. They empower the
change in Nutriscore were predictors associated with                             user to eat healthier by equipping them with the nutri-
greater odds of sustained weight loss in multivariate re-                        tional knowledge of what opportunities there are for im-
gression models.                                                                 provement in their current diet and recommend recipes
  Lifestyle interventions to manage and prevent obesity                          personalized to their taste, preparing users to take an ac-
have been demonstrated to be effective in weight loss.                           tive role in shopping and eating healthier. The grocery
Programs such as the DPP lifestyle intervention have                             list, food ordering, rewards, and discounts are designed
been proven to be more effective than pharmacological                            to change actual shopping and eating behavior. When
interventions in preventing incident diabetes and re-                            users recognize that they are saving time and money,
sulted in weight loss [7]. Mobile health interventions                           eating healthier and feeling better, users are likely to
have also been found to be successful in the treatment                           maintain their changes in behavior to continue using the
adults with overweight or obesity; however, there is in-                         platform and eat healthy. As we found in our analyses, a
sufficient evidence on their effectiveness for weight loss                       reported increase in Nutriscore over time was associated
maintenance [14]. While many mobile nutrition and                                with greater odds of sustained weight loss. Greater en-
health apps help users self-monitor their dietary behav-                         gagement with the app is likely to improve the diet, as
iors and health outcomes or health coaching, few actu-                           represented by an increase in Nutriscore, which trans-
ally change the user’s environment to enable long term                           lates to weight loss and sustained weight loss.
changes in health behavior [24]. A review of web-based                              The present study has some limitations. This study
weight loss interventions among adults with overweight                           was observational, without an intervention or control
or obesity found that the percentage of weight loss                              group, and thus we cannot conclude a causal association
ranged from none to 5.8 % over a range of 3 to 18                                between the Foodsmart platform and sustained weight
months [25]. Among the studies that examined weight                              loss. However, the study seeks to explore which factors
maintenance, one study found that participants in the                            are associated with sustained weight loss among Foods-
Internet intervention lost on average 5.3 kg after the 4                         mart users. All measures of height, weight, and diet were
month intervention, but gained weight (0.7 kg) after an                          self-reported by participants. However, prior studies sug-
additional 12-month follow-up [26]. Another study                                gest that there is moderate to high agreement between
found that the internet support intervention group lost                          online self-reported and measured anthropometric data
8.4 kg over 6 months and after an additional 12-month                            [33]. Another limitation was that a very small sample of
follow-up, regained 0.8 kg [27].                                                 users entered their weight three times, leading to poten-
  Major barriers to healthy eating include access to                             tial selection bias. These users were most likely more
healthy food, time to shop, price, and selection of                              health- and weight-conscious and may not be represen-
healthy foods, especially among low income populations                           tative of all users. The time between weight entries was
[28]. Few interventions are designed to address these                            not standardized since users could enter their weight at
Hu et al. Nutrition Journal (2021) 20:8 Page 7 of 8
any time. Although we could not control for this, it Acknowledgements
allowed us to compare sustained weight loss at different Not applicable.
time periods, and we found the percent of people with Authors’ contributions
sustained weight loss was consistent at 12, 24, and 36 Emily A. Hu, Jason Langheier, and Dexter Shurney conceptualized the study
months. We did not have information on other poten- design; Mahesh Pasupuleti and Viet Nguyen supplied data; Emily A. Hu
analyzed data; Emily A. Hu drafted manuscript; Dexter Shurney and Jason
tially important predictors of weight loss such as phys- Langheier oversaw project. All authors read and approved the final
ical activity level, race, or socioeconomic status since manuscript.
this data was not collected in Foodsmart. Additionally,
Funding
we did not have data on pre-existing diseases or medica- The study was funded by Foodsmart.
tion use, nor menopausal status, which could play an
important role in weight change among females, espe- Availability of data and materials
cially among those with obesity [34]. The datasets generated and/or analysed during the current study are not
publicly available due to legal contracts with employer and health plan
There were also many strengths in this study. Foods- partners but are available from the corresponding author on reasonable
mart’s database contains about 1 million users’ data re- request.
lated to dietary responses, and a subset of them have
Ethics approval
weight data. Conducting a formal analysis in a large, The study was declared exempt from Institutional Review Board oversight by
real-world dataset like this allows us to leverage the the Pearl Institutional Review Board (#20-ZIPO-101) given the retrospective
power of technology to gain insights about how users re- design of the study and less than minimal risk to participants.
spond to new behavior-change technologies like Foods- Consent for publication
mart. While there are many commercial applications Not applicable.
that are targeting behavior-change through nutrition or
Competing interests
other lifestyle modifications, very rarely do they have the
EAH, MP, VN, JL, and DS are all current or former employees of Foodsmart
opportunity to examine their data to make statistical as- and have competing interests due to personal financial interests.
sociations that help the scientific field better understand
Author details
interventions and solutions used in the real world. An- 1
Zipongo, Inc, DBA Foodsmart, 595 Pacific Ave, 4th Floor, San Francisco, CA
other strength is that participants were enrolled with 94133, USA. 2Adventist Health, 1 Adventist Health Way, Roseville, CA 95661,
Foodsmart for extended periods (up to 55 months), USA.
allowing us to examine weight change and maintenance
Received: 17 November 2020 Accepted: 17 January 2021
within a time span of more than three years. We also
had a large sample size, allowing us to conduct subgroup
analyses. References
1. Seidell JC, Halberstadt J. The global burden of obesity and the challenges of
This study found that adults with obesity who used a prevention. Ann Nutr Metab. 2015;66(Suppl 2):7–12. doi:https://doi.org/10.
digital nutrition platform with personalized dietary rec- 1159/000375143.
ommendations and online meal planning, food ordering, 2. Tremmel M, Gerdtham UG, Nilsson PM, Saha S. Economic Burden of
Obesity: A Systematic Literature Review. Int J Environ Res Public Health. 2017;
grocery discounts and incentives were able to sustain 14(4):435. Published 2017 Apr 19. doi:https://doi.org/10.3390/
weight loss after 12, 24, and 36-month intervals. Add- ijerph14040435.
itional research through randomized controlled trials 3. GBD. 2015 Collaborators O, Afshin A, Forouzanfar MH, et al. Health Effects of
Overweight and Obesity in 195 Countries over 25 Years. N Engl J Med. 2017;
and cost-effectiveness studies are needed to elucidate 377(1):13–27. doi:https://doi.org/10.1056/NEJMoa1614362.
causal associations and to determine the economic im- 4. Hales CM, Fryar CD, Carroll MD, Freedman DS, Ogden CL. Trends in Obesity
pact of this type of digital technology. and Severe Obesity Prevalence in US Youth and Adults by Sex and Age,
2007–2008 to 2015–2016. JAMA. 2018;319(16):1723–5. doi:https://doi.org/10.
1001/jama.2018.3060.
5. Stokes A, Ni Y, Preston SH. Prevalence and Trends in Lifetime Obesity in the
Conclusions U.S., 1988–2014. Am J Prev Med. 2017;53(5):567–75. doi:https://doi.org/10.
In conclusion, this study demonstrated the clinical utility 1016/j.amepre.2017.06.008.
6. Bray GA, Frühbeck G, Ryan DH, Wilding JP. Management of obesity. Lancet.
of a digital platform that gives personalized nutrition 2016;387(10031):1947–56. doi:https://doi.org/10.1016/S0140-6736(16)00271-3.
recommendations and meal planning and grocery deliv- 7. Franz MJ, Boucher JL, Rutten-Ramos S, VanWormer JJ. Lifestyle weight-loss
ery tools in sustained weight reduction among users intervention outcomes in overweight and obese adults with type 2
diabetes: a systematic review and meta-analysis of randomized clinical trials.
with obesity. J Acad Nutr Diet. 2015;115(9):1447–63. doi:https://doi.org/10.1016/j.jand.
2015.02.031.
8. Knowler WC, Barrett-Connor E, Fowler SE, Hamman RF, Lachin JM, Walker
EA, et al. Reduction in the incidence of type 2 diabetes with lifestyle
Abbreviations intervention or metformin. N Engl J Med. 2002;346(6):393–403. PMID:
BMI: Body mass index; CI: Confidence interval; CSIRO: Commonwealth 11832527.
Scientific and Industrial Research Organization; DPP: Diabetes Prevention 9. Johnston BC, Kanters S, Bandayrel K, Wu P, Naji F, Siemieniuk RA, et al.
Program; kg: Kilograms; lbs: Pounds; m: Meter; OR: Odds ratio; SD: Standard Comparison of weight loss among named diet programs in overweight and
deviation obese adults: a meta-analysis. JAMA. 2014;312(9):923–33. PMID: 25182101.Hu et al. Nutrition Journal (2021) 20:8 Page 8 of 8
10. MacLean PS, Wing RR, Davidson T, Epstein L, Goodpaster B, Hall KD, et al. Habits? Front Psychol. 2020;11:1448. doi:https://doi.org/10.3389/fpsyg.2020.
NIH working group report: Innovative research to improve maintenance of 01448. Published 2020 Jun 5.
weight loss. Obesity (Silver Spring). 2015;23(1):7–15. PMID: 25469998. 31. Hu EA, Nguyen V, Langheier J, Shurney D. Weight reduction through a
11. Rhee EJ. Weight cycling and its cardiometabolic impact. J Obes Metab digital nutrition and food purchasing platform among obese users: A
Syndr. 2017;26(4):237–42. PMID: 31089525. longitudinal study [published online ahead of print, 2020 Aug 13]. J Med
12. Holmes WS, Moorhead SA, Coates VE, Bond RR, Zheng H. Impact of digital Internet Res. 2020. https://doi.org/10.2196/19634. doi:10.2196/19634.
technologies for communicating messages on weight loss maintenance: a 32. Prochaska JO, DiClemente. Stages and processes of self-change of smoking:
systematic literature review. Eur J Public Health. 2019;29(2):320–8. doi: Toward an integrative model of change. 1983;51(3):390–5. PMID: 6863699.
https://doi.org/10.1093/eurpub/cky171. 33. Pursey K, Burrows TL, Stanwell P, Collins CE. How accurate is web-based
13. Beleigoli AM, Andrade AQ, Cançado AG, Paulo MN, Diniz MFH, Ribeiro AL. self-reported height, weight, and body mass index in young adults? J Med
Web-Based Digital Health Interventions for Weight Loss and Lifestyle Habit Internet Res. 2014;16(1):e4. PMID: 24398335.
Changes in Overweight and Obese Adults: Systematic Review and Meta- 34. Proietto J. Obesity and weight management at menopause. Aust Fam
Analysis. J Med Internet Res. 2019;21(1):e298. doi:https://doi.org/10.2196/ Physician. 2017 Jun;46(6):368–70. PMID: 28609591.
jmir.9609. Published 2019 Jan 8.
14. Hutchesson MJ, Rollo ME, Krukowski R, et al. eHealth interventions for the
prevention and treatment of overweight and obesity in adults: a systematic
Publisher’s Note
Springer Nature remains neutral with regard to jurisdictional claims in
review with meta-analysis. Obes Rev. 2015;16(5):376–92. doi:https://doi.org/
published maps and institutional affiliations.
10.1111/obr.12268.
15. Villinger K, Wahl DR, Boeing H, Schupp HT, Renner B. The effectiveness of
app-based mobile interventions on nutrition behaviours and nutrition-
related health outcomes: A systematic review and meta-analysis. Obes Rev.
2019;20(10):1465–84. doi:https://doi.org/10.1111/obr.12903.
16. Barnes TL, Pelletier JE, Erickson DJ, Caspi CE, Harnack LJ, Laska MN.
Healthfulness of Foods Advertised in Small and Nontraditional Urban Stores
in Minneapolis-St. Paul, Minnesota, 2014. Prev Chronic Dis. 2016;13:E153. doi:
https://doi.org/10.5888/pcd13.160149. Published 2016 Nov 10.
17. Wolfson JA, Bleich SN. Is cooking at home associated with better diet
quality or weight-loss intention? Public Health Nutr. 2015;18(8):1397–406.
doi:https://doi.org/10.1017/S1368980014001943.
18. Wolfson JA, Leung CW, Richardson CR. More frequent cooking at home is
associated with higher Healthy Eating Index-2015 score. Public Health Nutr.
2020;23(13):2384–94. doi:https://doi.org/10.1017/S1368980019003549.
19. Karfopoulou E, Mouliou K, Koutras Y, Yannakoulia M. Behaviours associated
with weight loss maintenance and regaining in a Mediterranean population
sample. A qualitative study. Clin Obes. 2013;3(5):141–9. doi:https://doi.org/
10.1111/cob.12028.
20. Mills S, White M, Brown H. Health and social determinants and outcomes of
home cooking: a systematic review of observational studies. Appetite. 2017;
111:116–34.
21. Subar AF, Thompson FE, Kipnis V, Midthune D, Hurwitz P, McNutt S, et al.
Comparative validation of the Block, Willett, and National Cancer Institute
food frequency questionnaires: the Eating at America’s Table Study. Am J
Epidemiol. 2001;154(12):1089–99. PMID: 11744511.
22. Chiuve SE, Fung TT, Rimm EB, Hu FB, McCullough ML, Wang M, Stampfer
MJ, Willett WC. Alternative dietary indices both strongly predict risk of
chronic disease. J Nutr. 2012;142(6):1009–18. PMID: 22513989.
23. Hendrie GA, Baird D, Golley RK, Noakes M. The CSIRO Healthy Diet Score: An
online survey to estimate compliance with the Australian Dietary Guidelines.
Nutrients. 2017;9(1):47. PMID: 28075355.
24. West JH, Belvedere LM, Andreasen R, Frandsen C, Hall PC, Crookston BT.
Controlling Your “App"etite: How Diet and Nutrition-Related Mobile Apps
Lead to Behavior Change. JMIR Mhealth Uhealth. 2017;5(7):e95. doi:https://
doi.org/10.2196/mhealth.7410. Published 2017 Jul 10.
25. Arem H, Irwin M. A review of web-based weight loss interventions in
adults. Obes Rev. 2011;12(5):e236–43. doi:https://doi.org/10.1111/j.1467-
789X.2010.00787.x.
26. Cussler EC, Teixeira PJ, Going SB, et al. Maintenance of weight loss in
overweight middle-aged women through the Internet. Obesity (Silver
Spring). 2008;16(5):1052–60. doi:https://doi.org/10.1038/oby.2008.19.
27. Harvey-Berino J, Pintauro S, Buzzell P, Gold EC. Effect of internet support on
the long-term maintenance of weight loss. Obes Res. 2004;12(2):320–9. doi:
https://doi.org/10.1038/oby.2004.40.
28. Wolfson JA, Ramsing R, Richardson CR, Palmer A. Barriers to healthy food
access: Associations with household income and cooking behavior. Prev
Med Rep. 2019;13:298–305. doi:https://doi.org/10.1016/j.pmedr.2019.01.023.
Published 2019 Jan 31.
29. Di Renzo L, Gualtieri P, Pivari F, et al. Eating habits and lifestyle changes
during COVID-19 lockdown: an Italian survey. J Transl Med. 2020;18(1):229.
doi:https://doi.org/10.1186/s12967-020-02399-5. Published 2020 Jun 8.
30. Martin-Neuninger R, Ruby MB. What Does Food Retail Research Tell Us
About the Implications of Coronavirus (COVID-19) for Grocery PurchasingYou can also read